Pinehurst neighborhood in San Jose, California (CA), 95136 detailed profile
Settings
X

Business Search - 14 Million verified businesses
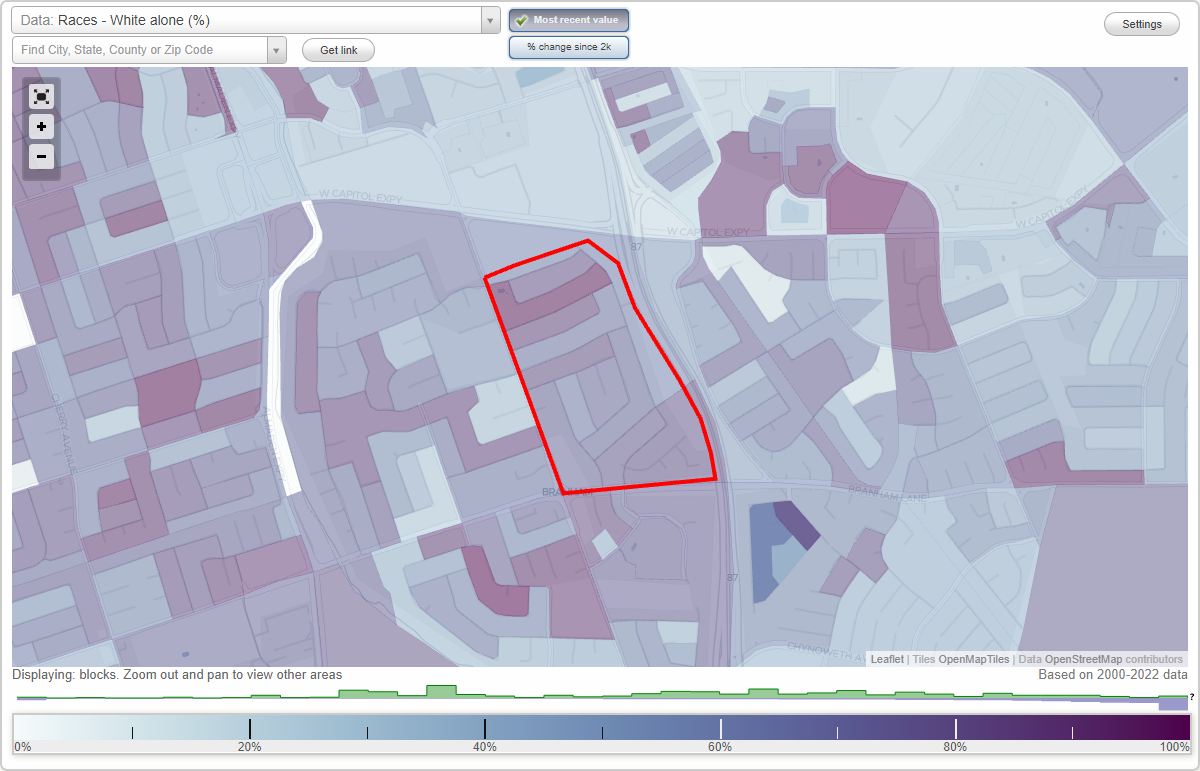
Area: 0.194 square miles
Population: 1,280
Population density:
| Pinehurst: | 6,601 people per square mile |
| San Jose: | 5,554 people per square mile |

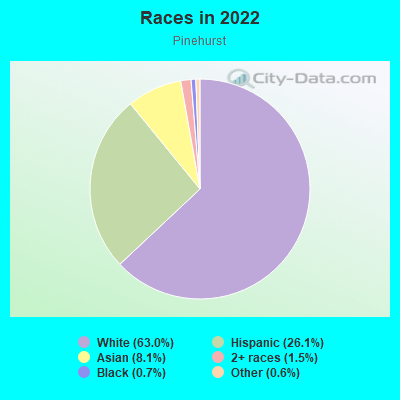
- 82263.0%White
- 34026.1%Hispanic or Latino
- 1068.1%Asian
- 201.5%Two or more races
- 90.7%Black
- 80.6%Some other race
Median household income in 2022:
| Pinehurst: | $190,214 |
| San Jose: | $133,835 |
Distribution of median household income
![Distribution of median household income]()
- 23Less than $10,000
- 22$10,000 to $19,999
- 20$20,000 to $29,999
- 10$30,000 to $39,999
- 14$40,000 to $49,999
- 8$50,000 to $59,999
- 16$60,000 to $74,999
- 53$75,000 to $99,999
- 49$100,000 to $124,999
- 8$125,000 to $149,999
- 94$150,000 to $199,999
- 159$200,000 or more

Distribution of owner-occupied house/condo value
![Distribution of owner-occupied house/condo value]()
- 5Less than $50,000
- 6$500,000 to $749,999
- 52$750,000 to $999,999
- 287$1,000,000 or more

Distribution of rent paid by renters
![Distribution of rent paid by renters]()
- 10$500 to $599
- 27$1,250 to $1,499
- 9$1,500 to $1,999
- 100$2,000 or more

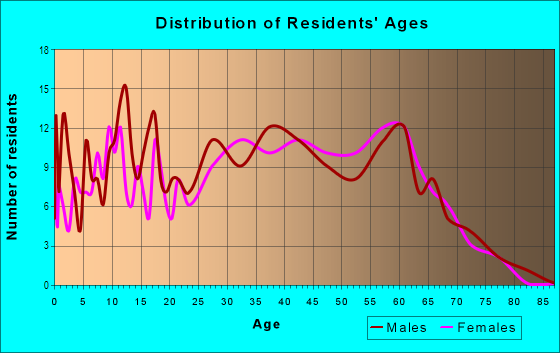
| Males: | 522 |
| Females: | 757 |
Males:
| This neighborhood: | 45.3 years |
| Whole city: | 37.6 years |
| This neighborhood: | 36.8 years |
| Whole city: | 39.1 years |
Average household size:
| Pinehurst: | 3.3 people |
| San Jose: | 2.9 people |
Percentage of family households:
| Pinehurst: | 51.7% |
| San Jose: | 49.9% |
| Here: | 66.3% |
| San Jose: | 53.0% |
Percentage of married-couple families with children (among all households):
| Pinehurst: | 22.3% |
| San Jose: | 25.8% |
Percentage of single-mother households (among all households):
| Pinehurst: | 13.5% |
| San Jose: | 5.2% |
Percentage of never married males 15 years old and over:
Percentage of never married females 15 years old and over:
| Pinehurst: | 14.2% |
| San Jose: | 20.9% |
Percentage of never married females 15 years old and over:
| Pinehurst: | 19.2% |
| city: | 16.7% |
Percentage of people that speak English not well or not at all:
| Pinehurst: | 10.1% |
| San Jose: | 11.4% |
Percentage of people born in this state:
Percentage of people born in another U.S. state:
Percentage of native residents but born outside the U.S.:
Percentage of foreign born residents:
| Here: | 57.9% |
| San Jose: | 46.1% |
Percentage of people born in another U.S. state:
| Pinehurst: | 19.0% |
| San Jose: | 10.4% |
Percentage of native residents but born outside the U.S.:
| Here: | 0.8% |
| city: | 1.7% |
Percentage of foreign born residents:
| Here: | 22.4% |
| San Jose: | 41.8% |
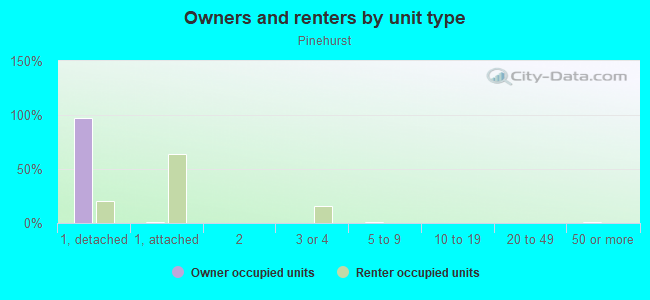
Owner-occupied
Renter-occupied

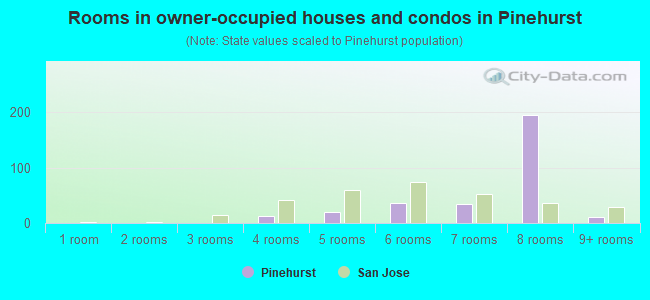
- Rooms in owner-occupied houses and condos in Pinehurst
- 01 room
- 02 rooms
- 03 rooms
- 134 rooms
- 205 rooms
- 376 rooms
- 347 rooms
- 1958 rooms
- 109+ rooms
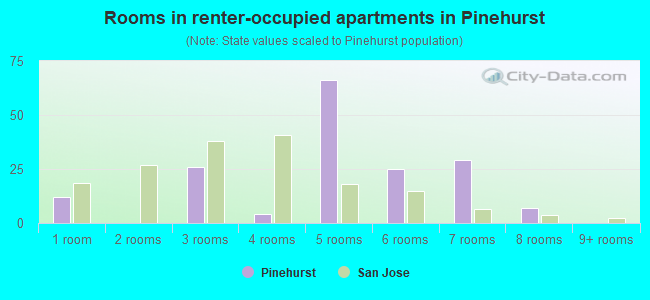
- Rooms in renter-occupied apartments in Pinehurst
- 121 room
- 02 rooms
- 263 rooms
- 44 rooms
- 665 rooms
- 256 rooms
- 297 rooms
- 78 rooms
- 09+ rooms
Owner-occupied
Renter-occupied
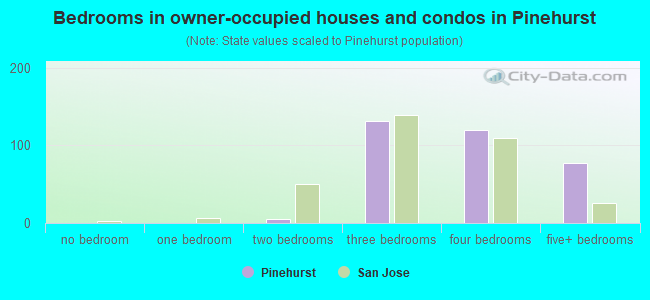
- Bedrooms in owner-occupied houses and condos in Pinehurst
- 0no bedroom
- 01 bedroom
- 52 bedrooms
- 1313 bedrooms
- 1204 bedrooms
- 775+ bedrooms
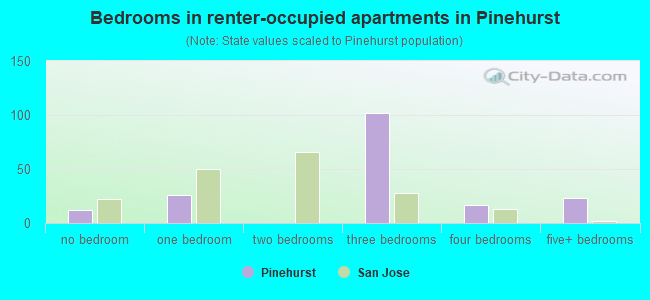
- Bedrooms in renter-occupied apartments in Pinehurst
- 12no bedroom
- 261 bedroom
- 02 bedrooms
- 1023 bedrooms
- 174 bedrooms
- 235+ bedrooms
Average number of cars or other vehicles available in houses/condos:
Average number of cars or other vehicles available in apartments:
| This neighborhood: | 2.3 |
| San Jose: | 2.3 |
Average number of cars or other vehicles available in apartments:
| Here: | 2.5 |
| city: | 1.6 |
Percentage of units with a mortgage:
| Pinehurst: | 34.5% |
| San Jose: | 66.9% |
Average estimated value of detached houses in 2022 (80.6% of all units):
| Pinehurst: | $1,234,354 |
| San Jose: | $1,532,815 |
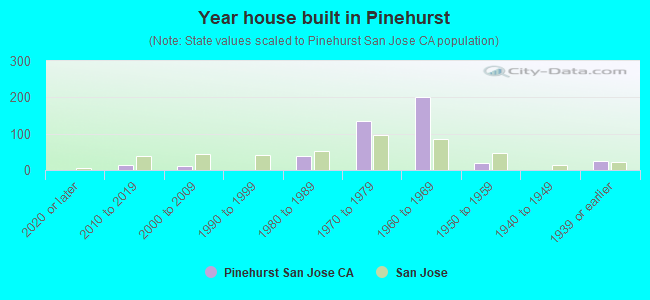
- Year house built in Pinehurst
- 02020 or later
- 142010 to 2019
- 122000 to 2009
- 01990 to 1999
- 391980 to 1989
- 1361970 to 1979
- 2001960 to 1969
- 201950 to 1959
- 01940 to 1949
- 261939 or earlier
City-data.com crime index for city in 2020 (higher means more crime):
| City: | 268.4 |
| U.S. average: | 219.5 |
Travel time to work (commute)
![Travel time to work (commute)]()
- 7Less than 5 minutes
- 265 to 9 minutes
- 2310 to 14 minutes
- 8315 to 19 minutes
- 5420 to 24 minutes
- 3625 to 29 minutes
- 11630 to 34 minutes
- 1335 to 39 minutes
- 2540 to 44 minutes
- 7545 to 59 minutes
- 3160 to 89 minutes
- 1290 or more minutes

Means of transportation to work
![Means of transportation to work]()
- 52.9%231Drove a car alone
- 25.9%113Carpooled
- 17.6%77Bus
- 6.2%27Long-distance train or commuter rail
- 6.0%26Light rail, streetcar or trolley
- 3.0%13Bicycle
- 1.6%7Walked
- 13.3%58Worked at home

Time leaving home to go to work
![Time leaving home to go to work]()
- 1112:00 a.m. to 4:59 a.m.
- 175:00 a.m. to 5:29 a.m.
- 135:30 a.m. to 5:59 a.m.
- 496:00 a.m. to 6:29 a.m.
- 436:30 a.m. to 6:59 a.m.
- 697:00 a.m. to 7:29 a.m.
- 577:30 a.m. to 7:59 a.m.
- 728:00 a.m. to 8:29 a.m.
- 388:30 a.m. to 8:59 a.m.
- 669:00 a.m. to 9:59 a.m.
- 2210:00 a.m. to 10:59 a.m.
- 1111:00 a.m. to 11:59 a.m.
- 2912:00 p.m. to 3:59 p.m.
- 364:00 p.m. to 11:59 p.m.

Occupations of males:
- Percentage of males in management occupations (except farmers):
Here: 23.2% city: 13.0%
- Percentage of males in business and financial operations occupations:
Here: 10.4% city: 4.6%
- Percentage of males in computer and mathematical occupations:
Here: 18.6% city: 13.6%
- Percentage of males in architecture and engineering occupations:
Here: 11.1% city: 10.2%
- Percentage of males in community and social services occupations:
Here: 2.1% city: 0.8%
- Percentage of males in legal occupations:
Here: 11.7% city: 0.8%
- Percentage of males in education, training, and library occupations:
Here: 4.3% city: 2.8%
- Percentage of males in arts, design, entertainment, sports, and media occupations:
Here: 1.7% city: 1.8%
- Percentage of males in healthcare practitioners and technical occupations:
Here: 2.4% city: 2.0%
- Percentage of males in service occupations:
Here: 3.3% city: 12.7%
- Percentage of males in sales and office occupations:
Here: 3.7% city: 12.8%
- Percentage of males in construction, extraction, and maintenance occupations:
Here: 9.0% city: 7.8%
- Percentage of males in production occupations:
Here: 11.2% city: 5.5%
- Percentage of males in transportation occupations:
Here: 5.9% city: 3.6%
- Percentage of males in material moving occupations:
Here: 4.3% city: 3.1%
Occupations of females:
- Percentage of females in management occupations (except farmers):
Here: 10.9% city: 11.0%
- Percentage of females in business and financial operations occupations:
Here: 7.5% city: 8.6%
- Percentage of females in computer and mathematical occupations:
Here: 6.0% city: 5.4%
- Percentage of females in architecture and engineering occupations:
Here: 7.0% city: 2.8%
- Percentage of females in life, physical, and social science occupations:
Here: 1.9% city: 1.7%
- Percentage of females in community and social services occupations:
Here: 4.0% city: 1.8%
- Percentage of females in education, training, and library occupations:
Here: 25.0% city: 8.1%
- Percentage of females in healthcare practitioners and technical occupations:
Here: 4.4% city: 6.8%
- Percentage of females in service occupations:
Here: 3.5% city: 21.7%
- Percentage of females in sales and office occupations:
Here: 32.5% city: 22.0%
- Percentage of females in construction, extraction, and maintenance occupations:
Here: 4.0% city: 0.2%
- Percentage of females in transportation occupations:
Here: 3.3% city: 0.7%
- Percentage of females in material moving occupations:
Here: 2.3% city: 1.5%
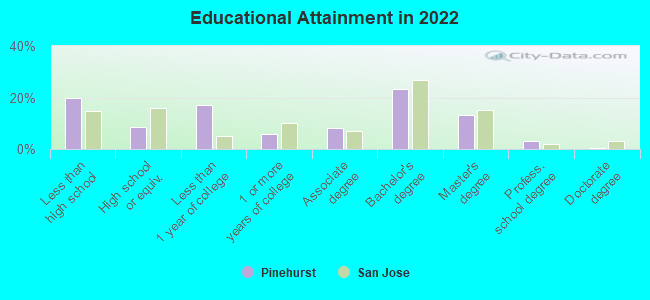
Education in this neighborhood (subdivision or community):
- Percentage of people 3 years and older in K-12 schools:
Pinehurst: 32.2% San Jose: 16.1%
- Percentage of people 3 years and older in undergraduate colleges:
Pinehurst: 2.8% San Jose: 6.5%
- Percentage of people 3 years and older in grad. or professional schools:
Pinehurst: 1.9% San Jose: 2.0%
- Percentage of students K-12 enrolled in private schools:
Pinehurst: 10.9% San Jose: 14.9%
Percentage of population below poverty level:
| Pinehurst: | 2.5% |
| San Jose: | 9.0% |
Median year owner moved in (as recorded in 2022):
| Pinehurst: | 1997 |
| San Jose: | 2008 |
Percentage of married-couple families with both working:
| Pinehurst: | 89.3% |
| San Jose: | 72.5% |
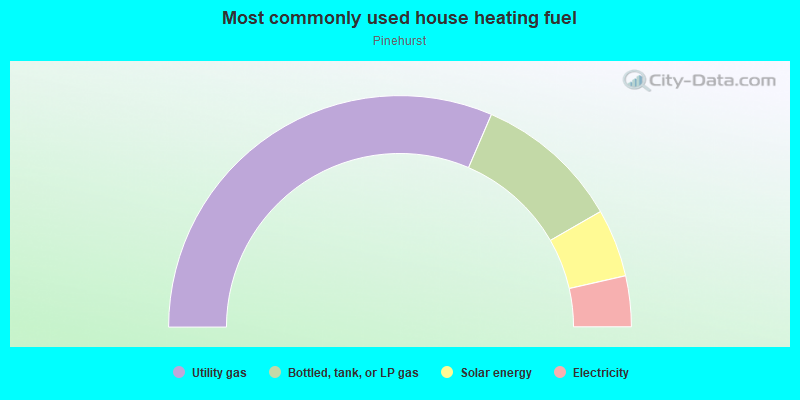
- 62.9%Utility gas
- 20.4%Bottled, tank, or LP gas
- 9.5%Solar energy
- 7.1%Electricity
Roads and streets:
Heppner Ln
Length: 0.67 miles
Directions: N-S, SE-NW, SW-NE
Address range: 3600 to 4529
Directions: N-S, SE-NW, SW-NE
Address range: 3600 to 4529
Haines Ave
Length: 0.35 miles
Directions: E-W, N-S, SE-NW, SW-NE
Address range: 4000 to 4399
Directions: E-W, N-S, SE-NW, SW-NE
Address range: 4000 to 4399
Midvale Ln
Length: 0.32 miles
Directions: E-W, SE-NW, SW-NE
Address range: 700 to 899
Directions: E-W, SE-NW, SW-NE
Address range: 700 to 899
Seabury Dr
Length: 0.25 miles
Direction: SW-NE
Address range: 768 to 899
Direction: SW-NE
Address range: 768 to 899
Lewiston Dr
Length: 0.23 miles
Directions: E-W, SW-NE
Address range: 700 to 873
Directions: E-W, SW-NE
Address range: 700 to 873
Wessex Dr
Length: 0.23 miles
Direction: SE-NW
Address range: 4100 to 4498
Direction: SE-NW
Address range: 4100 to 4498
Faraone Dr
Length: 0.21 miles
Directions: E-W, SW-NE
Address range: 600 to 799
Directions: E-W, SW-NE
Address range: 600 to 799
Upton Way
Length: 0.19 miles
Directions: E-W, SW-NE
Address range: 700 to 827
Directions: E-W, SW-NE
Address range: 700 to 827
Funston Dr
Length: 0.15 miles
Direction: SE-NW
Address range: 4100 to 4399
Direction: SE-NW
Address range: 4100 to 4399
Faraone Ct
Length: 0.09 miles
Directions: E-W, N-S, SE-NW
Address range: 4400 to 4599
Directions: E-W, N-S, SE-NW
Address range: 4400 to 4599
Upton Ct
Length: 0.08 miles
Direction: SE-NW
Address range: 700 to 799
Direction: SE-NW
Address range: 700 to 799
Clarkston Dr
Length: 0.06 miles
Directions: E-W, SW-NE
Directions: E-W, SW-NE
Bend Ave
Length: 0.06 miles
Direction: E-W
Address range: 700 to 761
Direction: E-W
Address range: 700 to 761
Selmac Ave
Length: 0.03 miles
Direction: E-W
Address range: 700 to 733
Direction: E-W
Address range: 700 to 733
Carnaby Ct
Length: 0.03 miles
Directions: N-S, SE-NW
Address range: 4500 to 4599
Directions: N-S, SE-NW
Address range: 4500 to 4599