Patterson Park neighborhood in Baltimore, Maryland (MD), 21224 detailed profile
Settings
X


Business Search - 14 Million verified businesses
Area: 0.223 square miles
Population: 1,326
Population density:
| Patterson Park: | 5,938 people per square mile |
| Baltimore: | 7,053 people per square mile |

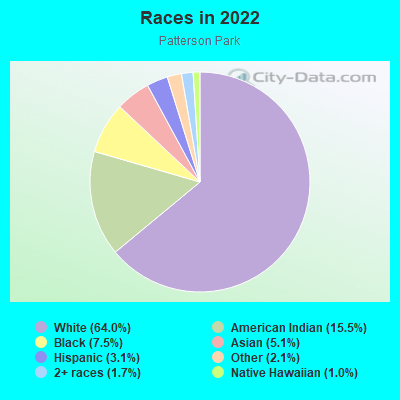
- 1,12164.0%White
- 27115.5%American Indian
- 1327.5%Black
- 905.1%Asian
- 553.1%Hispanic or Latino
- 362.1%Some other race
- 291.7%Two or more races
- 171.0%Native Hawaiian and Other
Pacific Islander
Distribution of median household income
![Distribution of median household income]()
- 148Less than $10,000
- 62$10,000 to $19,999
- 359$20,000 to $29,999
- 408$30,000 to $39,999
- 86$40,000 to $49,999
- 44$50,000 to $59,999
- 56$60,000 to $74,999
- 37$75,000 to $99,999
- 78$100,000 to $124,999
- 88$125,000 to $149,999
- 224$150,000 to $199,999
- 145$200,000 or more

Distribution of owner-occupied house/condo value
![Distribution of owner-occupied house/condo value]()
- 19Less than $50,000
- 310$50,000 to $99,999
- 371$100,000 to $149,999
- 43$150,000 to $199,999
- 34$200,000 to $249,999
- 85$250,000 to $299,999
- 235$300,000 to $399,999
- 42$400,000 to $499,999
- 34$500,000 to $749,999
- 18$750,000 to $999,999
- 23$1,000,000 or more

Distribution of rent paid by renters
![Distribution of rent paid by renters]()
- 17Less than $100
- 9$100 to $199
- 43$200 to $299
- 277$600 to $699
- 225$700 to $799
- 197$800 to $899
- 242$900 to $999
- 235$1,000 to $1,249
- 407$1,250 to $1,499
- 23$1,500 to $1,999
- 141$2,000 or more

Median rent in 2022:
| Patterson Park: | $2,482 |
| Baltimore: | $1,043 |
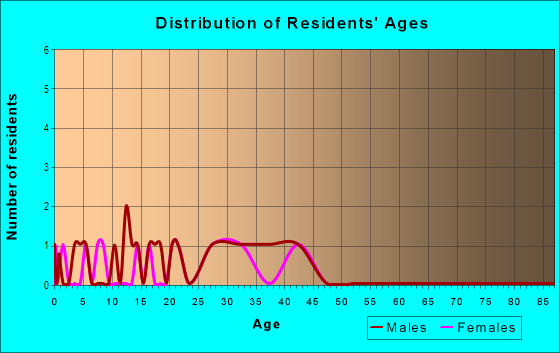
| Males: | 621 |
| Females: | 704 |
Males:
| This neighborhood: | 31.5 years |
| Whole city: | 35.0 years |
| This neighborhood: | 33.2 years |
| Whole city: | 38.2 years |
Average household size:
| Patterson Park: | 6.0 people |
| Baltimore: | 2.2 people |
Percentage of family households:
| Patterson Park: | 33.8% |
| Baltimore: | 34.2% |
| Here: | 24.8% |
| Baltimore: | 23.3% |
Percentage of married-couple families with children (among all households):
| Patterson Park: | 31.6% |
| Baltimore: | 22.4% |
Percentage of single-mother households (among all households):
| Patterson Park: | 71.3% |
| Baltimore: | 18.7% |
Percentage of never married males 15 years old and over:
Percentage of never married females 15 years old and over:
| Patterson Park: | 23.5% |
| Baltimore: | 25.1% |
Percentage of never married females 15 years old and over:
| Patterson Park: | 37.5% |
| city: | 27.5% |
Percentage of people that speak English not well or not at all:
| Patterson Park: | 0.0% |
| Baltimore: | 2.3% |
Percentage of people born in this state:
Percentage of people born in another U.S. state:
Percentage of native residents but born outside the U.S.:
Percentage of foreign born residents:
| Here: | 43.7% |
| Baltimore: | 64.4% |
Percentage of people born in another U.S. state:
| Patterson Park: | 48.3% |
| Baltimore: | 25.0% |
Percentage of native residents but born outside the U.S.:
| Here: | 1.0% |
| city: | 0.9% |
Percentage of foreign born residents:
| Here: | 7.1% |
| Baltimore: | 9.7% |
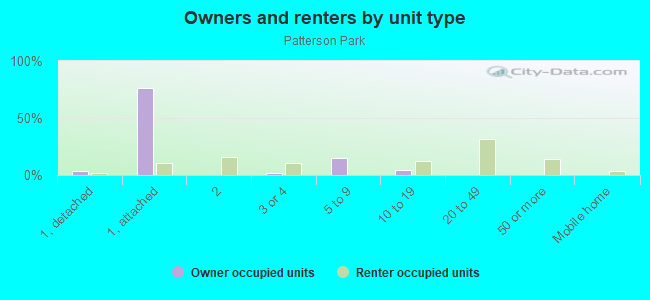
Owner-occupied
Renter-occupied


- Rooms in owner-occupied houses and condos in Patterson Park
- 01 room
- 02 rooms
- 473 rooms
- 1394 rooms
- 695 rooms
- 716 rooms
- 867 rooms
- 288 rooms
- 1609+ rooms
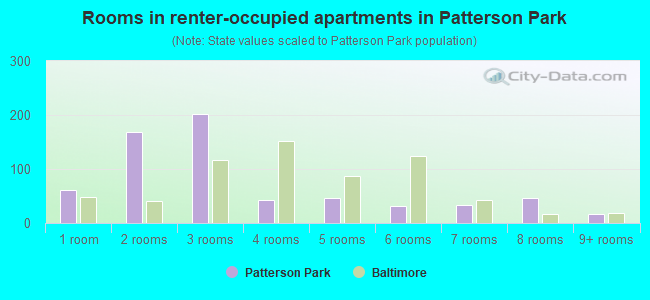
- Rooms in renter-occupied apartments in Patterson Park
- 611 room
- 1692 rooms
- 2013 rooms
- 434 rooms
- 465 rooms
- 316 rooms
- 337 rooms
- 468 rooms
- 169+ rooms
Owner-occupied
Renter-occupied
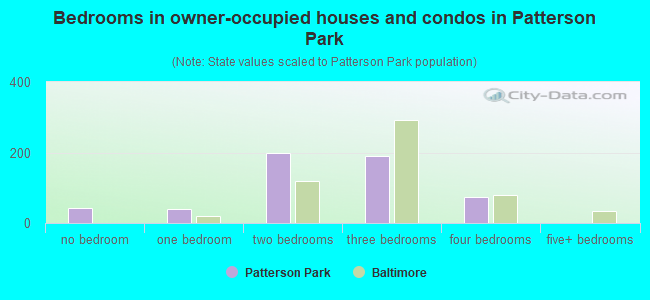
- Bedrooms in owner-occupied houses and condos in Patterson Park
- 42no bedroom
- 401 bedroom
- 1992 bedrooms
- 1893 bedrooms
- 734 bedrooms
- 05+ bedrooms
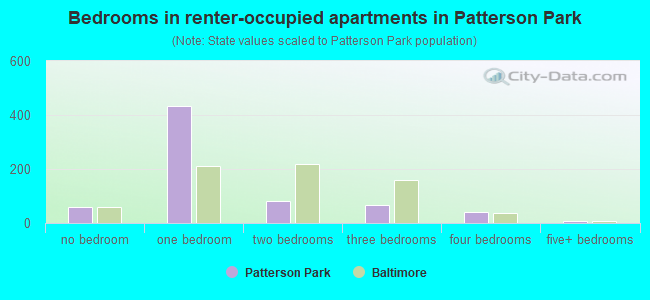
- Bedrooms in renter-occupied apartments in Patterson Park
- 61no bedroom
- 4341 bedroom
- 822 bedrooms
- 683 bedrooms
- 394 bedrooms
- 75+ bedrooms
Average number of cars or other vehicles available in houses/condos:
Average number of cars or other vehicles available in apartments:
| This neighborhood: | 1.5 |
| Baltimore: | 1.5 |
Average number of cars or other vehicles available in apartments:
| Here: | 2.3 |
| city: | 0.8 |
Percentage of units with a mortgage:
| Patterson Park: | 82.4% |
| Baltimore: | 64.3% |
Average estimated value of townhouses or other attached units in 2022 (92.9% of all units):
| This neighborhood: | $339,817 |
| city: | $206,258 |
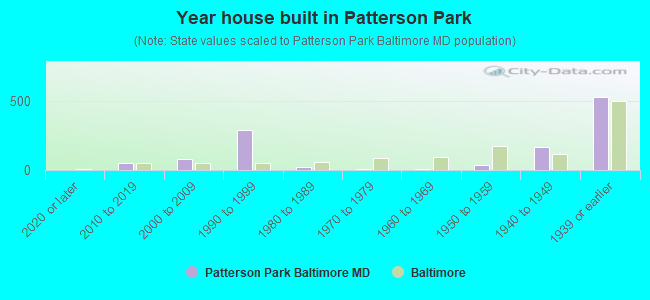
- Year house built in Patterson Park
- 02020 or later
- 532010 to 2019
- 792000 to 2009
- 2911990 to 1999
- 241980 to 1989
- 81970 to 1979
- 51960 to 1969
- 351950 to 1959
- 1691940 to 1949
- 5291939 or earlier
Travel time to work (commute)
![Travel time to work (commute)]()
- 13Less than 5 minutes
- 425 to 9 minutes
- 10710 to 14 minutes
- 14815 to 19 minutes
- 8120 to 24 minutes
- 6525 to 29 minutes
- 11630 to 34 minutes
- 2935 to 39 minutes
- 3840 to 44 minutes
- 10045 to 59 minutes
- 2960 to 89 minutes
- 1090 or more minutes

Means of transportation to work
![Means of transportation to work]()
- 74.8%787Drove a car alone
- 6.5%68Carpooled
- 1.8%19Bus
- 1.2%13Subway or elevated rail
- 0.9%10Long-distance train or commuter rail
- 4.0%42Light rail, streetcar or trolley
- 0.6%6Motorcycle
- 0.5%5Bicycle
- 7.9%83Walked
- 1.4%15Other means
- 14.3%151Worked at home

Time leaving home to go to work
![Time leaving home to go to work]()
- 1312:00 a.m. to 4:59 a.m.
- 245:00 a.m. to 5:29 a.m.
- 115:30 a.m. to 5:59 a.m.
- 466:00 a.m. to 6:29 a.m.
- 1046:30 a.m. to 6:59 a.m.
- 1037:00 a.m. to 7:29 a.m.
- 1547:30 a.m. to 7:59 a.m.
- 878:00 a.m. to 8:29 a.m.
- 678:30 a.m. to 8:59 a.m.
- 769:00 a.m. to 9:59 a.m.
- 1210:00 a.m. to 10:59 a.m.
- 1411:00 a.m. to 11:59 a.m.
- 3312:00 p.m. to 3:59 p.m.
- 104:00 p.m. to 11:59 p.m.

Occupations of males:
- Percentage of males in management occupations (except farmers):
Here: 14.6% city: 10.7%
- Percentage of males in business and financial operations occupations:
Here: 5.6% city: 5.9%
- Percentage of males in computer and mathematical occupations:
Here: 10.9% city: 6.1%
- Percentage of males in architecture and engineering occupations:
Here: 22.9% city: 2.9%
- Percentage of males in life, physical, and social science occupations:
Here: 3.3% city: 2.3%
- Percentage of males in community and social services occupations:
Here: 1.4% city: 1.6%
- Percentage of males in education, training, and library occupations:
Here: 1.0% city: 5.4%
- Percentage of males in arts, design, entertainment, sports, and media occupations:
Here: 5.6% city: 2.8%
- Percentage of males in service occupations:
Here: 6.8% city: 14.7%
- Percentage of males in sales and office occupations:
Here: 20.1% city: 14.2%
- Percentage of males in farming, fishing, and forestry occupations:
Here: 1.4% city: 0.1%
- Percentage of males in production occupations:
Here: 5.0% city: 4.2%
Occupations of females:
- Percentage of females in management occupations (except farmers):
Here: 7.8% city: 10.1%
- Percentage of females in business and financial operations occupations:
Here: 8.6% city: 6.6%
- Percentage of females in computer and mathematical occupations:
Here: 4.2% city: 2.4%
- Percentage of females in architecture and engineering occupations:
Here: 1.4% city: 0.9%
- Percentage of females in life, physical, and social science occupations:
Here: 7.6% city: 2.5%
- Percentage of females in community and social services occupations:
Here: 7.7% city: 3.6%
- Percentage of females in education, training, and library occupations:
Here: 10.4% city: 10.7%
- Percentage of females in arts, design, entertainment, sports, and media occupations:
Here: 7.0% city: 2.4%
- Percentage of females in healthcare practitioners and technical occupations:
Here: 28.4% city: 9.8%
- Percentage of females in service occupations:
Here: 8.6% city: 20.4%
- Percentage of females in sales and office occupations:
Here: 7.9% city: 22.3%
Percentage of people 16-64 in Armed Forces:
| Patterson Park: | 0.8% |
| Baltimore: | 0.4% |
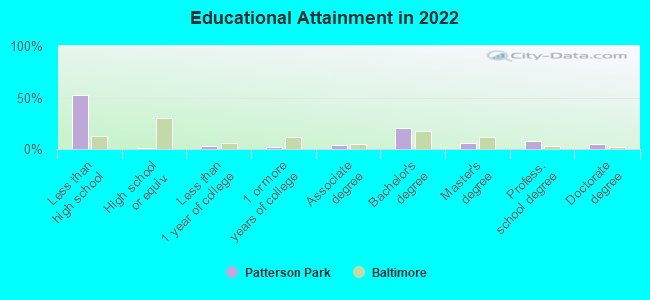
Education in this neighborhood (subdivision or community):
- Percentage of people 3 years and older in K-12 schools:
Patterson Park: 84.9% Baltimore: 14.7%
- Percentage of people 3 years and older in undergraduate colleges:
Patterson Park: 3.3% Baltimore: 6.0%
- Percentage of people 3 years and older in grad. or professional schools:
Patterson Park: 7.8% Baltimore: 2.8%
- Percentage of students K-12 enrolled in private schools:
Patterson Park: 13.2% Baltimore: 12.7%
Percentage of population below poverty level:
| Patterson Park: | 6.3% |
| Baltimore: | 18.5% |
Percentage of married-couple families with both working:
| Patterson Park: | 81.6% |
| Baltimore: | 79.2% |
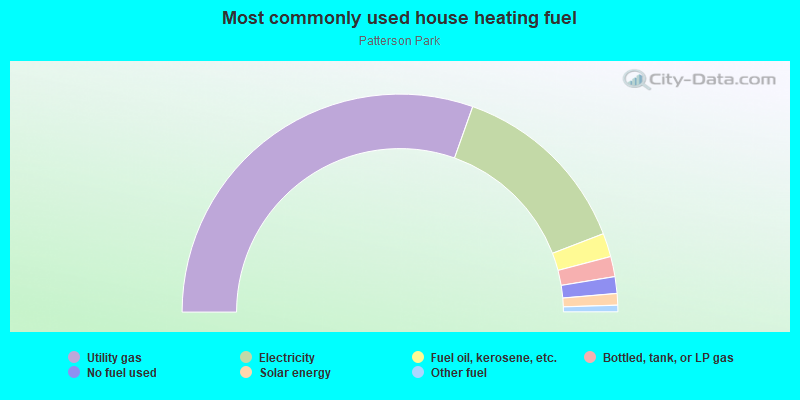
- 60.9%Utility gas
- 27.5%Electricity
- 3.5%Fuel oil, kerosene, etc.
- 3.0%Bottled, tank, or LP gas
- 2.5%No fuel used
- 1.7%Solar energy
- 1.0%Other fuel
Roads and streets:
S Linwood Ave
Length: 0.33 miles
Direction: N-S
Address range: 100 to 199
Direction: N-S
Address range: 100 to 199
Eastern Ave
Length: 0.25 miles
Direction: E-W
Address range: 2410 to 2699
Direction: E-W
Address range: 2410 to 2699
E Baltimore St
Length: 0.15 miles
Direction: E-W
Address range: 2400 to 2520
Direction: E-W
Address range: 2400 to 2520
S Ellwood Ave
Length: 0.07 miles
Direction: N-S
Address range: 300 to 399
Direction: N-S
Address range: 300 to 399