Parkway Center neighborhood in Las Vegas, Nevada (NV), 89106 detailed profile
Settings
X

Business Search - 14 Million verified businesses
Area: 0.750 square miles
Population: 2,067
Population density:
| Parkway Center: | 2,757 people per square mile |
| Las Vegas: | 5,792 people per square mile |

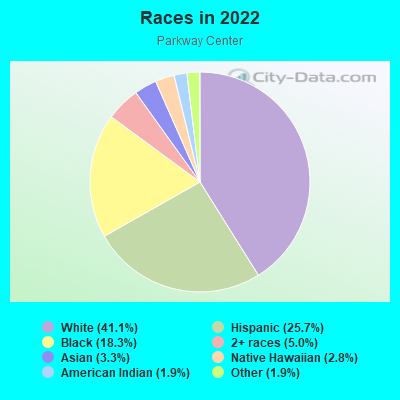
- 88541.1%White
- 55425.7%Hispanic or Latino
- 39318.3%Black
- 1075.0%Two or more races
- 713.3%Asian
- 612.8%Native Hawaiian and Other
Pacific Islander - 411.9%American Indian
- 411.9%Some other race
Distribution of median household income
![Distribution of median household income]()
- 119Less than $10,000
- 177$10,000 to $19,999
- 86$20,000 to $29,999
- 94$30,000 to $39,999
- 122$40,000 to $49,999
- 74$50,000 to $59,999
- 91$60,000 to $74,999
- 39$75,000 to $99,999
- 101$100,000 to $124,999
- 52$125,000 to $149,999
- 79$150,000 to $199,999
- 82$200,000 or more

Distribution of owner-occupied house/condo value
![Distribution of owner-occupied house/condo value]()
- 23Less than $50,000
- 17$50,000 to $99,999
- 7$100,000 to $149,999
- 124$150,000 to $199,999
- 81$200,000 to $249,999
- 181$250,000 to $299,999
- 29$300,000 to $399,999
- 97$400,000 to $499,999
- 62$500,000 to $749,999
- 14$750,000 to $999,999
- 74$1,000,000 or more

Distribution of rent paid by renters
![Distribution of rent paid by renters]()
- 12Less than $100
- 79$100 to $199
- 9$200 to $299
- 25$300 to $399
- 4$400 to $499
- 65$500 to $599
- 128$600 to $699
- 194$700 to $799
- 179$800 to $899
- 159$900 to $999
- 66$1,000 to $1,249
- 103$1,250 to $1,499
- 75$1,500 to $1,999
- 81$2,000 or more

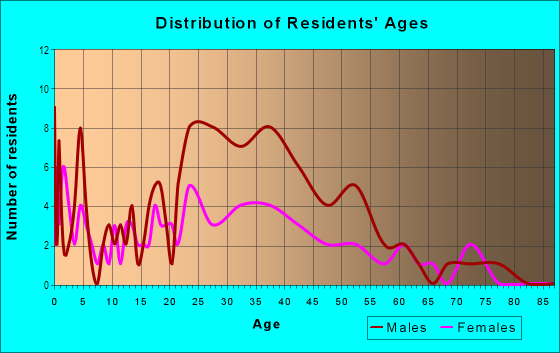
| Males: | 1,421 |
| Females: | 645 |
Males:
| This neighborhood: | |
| Whole city: |
| This neighborhood: | |
| Whole city: |
Percentage of family households:
| Parkway Center: | 35.0% |
| Las Vegas: | 45.8% |
| Here: | 29.9% |
| Las Vegas: | 40.9% |
Percentage of married-couple families with children (among all households):
| Parkway Center: | 16.6% |
| Las Vegas: | 23.4% |
Percentage of single-mother households (among all households):
| Parkway Center: | 19.7% |
| Las Vegas: | 10.1% |
Percentage of never married males 15 years old and over:
Percentage of never married females 15 years old and over:
| Parkway Center: | 44.5% |
| Las Vegas: | 19.7% |
Percentage of never married females 15 years old and over:
| Parkway Center: | 13.6% |
| city: | 17.0% |
Percentage of people that speak English not well or not at all:
| Parkway Center: | 3.4% |
| Las Vegas: | 7.0% |
Percentage of people born in this state:
Percentage of people born in another U.S. state:
Percentage of native residents but born outside the U.S.:
Percentage of foreign born residents:
| Here: | 35.6% |
| Las Vegas: | 27.3% |
Percentage of people born in another U.S. state:
| Parkway Center: | 45.0% |
| Las Vegas: | 49.8% |
Percentage of native residents but born outside the U.S.:
| Here: | 0.6% |
| city: | 1.9% |
Percentage of foreign born residents:
| Here: | 18.8% |
| Las Vegas: | 21.0% |
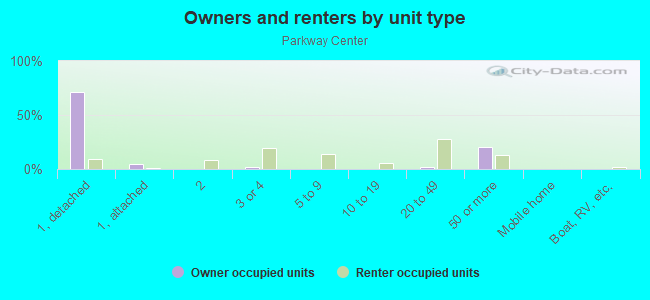
Owner-occupied
Renter-occupied

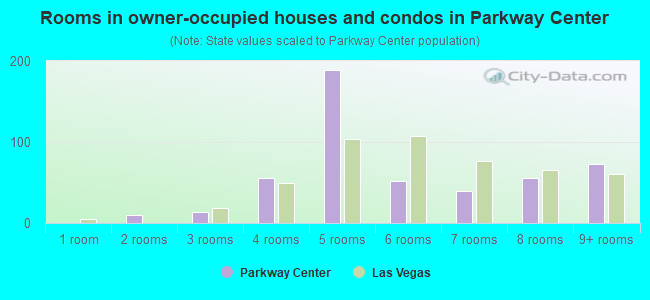
- Rooms in owner-occupied houses and condos in Parkway Center
- 01 room
- 102 rooms
- 133 rooms
- 554 rooms
- 1895 rooms
- 526 rooms
- 407 rooms
- 558 rooms
- 739+ rooms
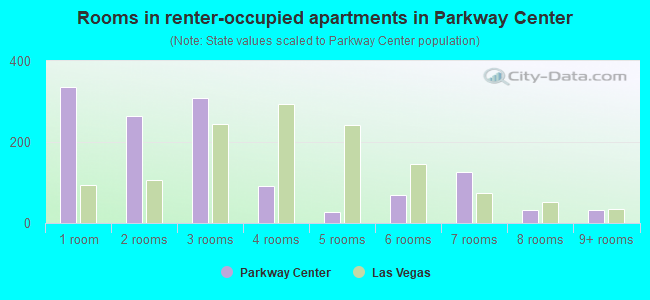
- Rooms in renter-occupied apartments in Parkway Center
- 3361 room
- 2642 rooms
- 3083 rooms
- 924 rooms
- 275 rooms
- 706 rooms
- 1257 rooms
- 338 rooms
- 329+ rooms
Owner-occupied
Renter-occupied
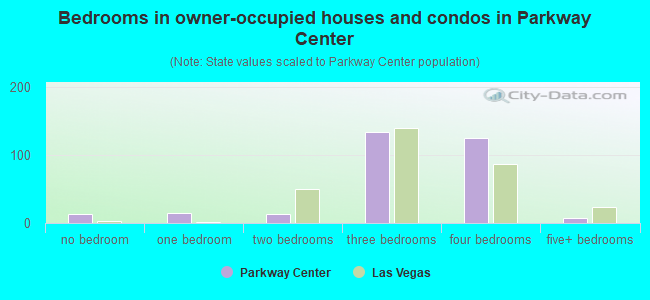
- Bedrooms in owner-occupied houses and condos in Parkway Center
- 13no bedroom
- 141 bedroom
- 132 bedrooms
- 1333 bedrooms
- 1254 bedrooms
- 75+ bedrooms
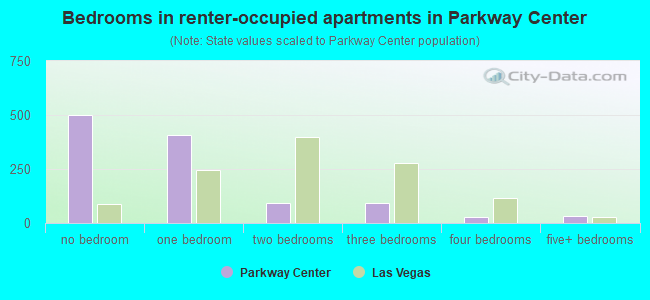
- Bedrooms in renter-occupied apartments in Parkway Center
- 502no bedroom
- 4061 bedroom
- 922 bedrooms
- 943 bedrooms
- 284 bedrooms
- 325+ bedrooms
Average number of cars or other vehicles available in houses/condos:
Average number of cars or other vehicles available in apartments:
| This neighborhood: | |
| Las Vegas: |
Average number of cars or other vehicles available in apartments:
| Here: | |
| city: |
Percentage of units with a mortgage:
| Parkway Center: | 70.2% |
| Las Vegas: | 69.3% |
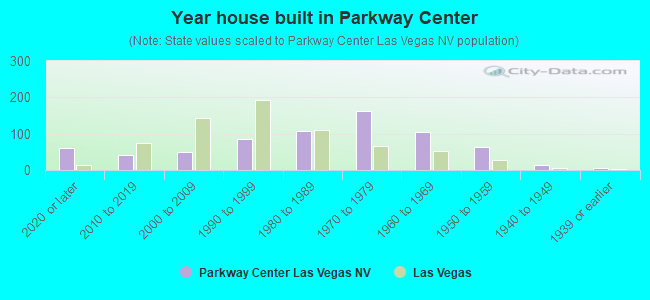
- Year house built in Parkway Center
- 602020 or later
- 402010 to 2019
- 492000 to 2009
- 841990 to 1999
- 1061980 to 1989
- 1621970 to 1979
- 1041960 to 1969
- 621950 to 1959
- 151940 to 1949
- 51939 or earlier
City-data.com crime index for city in 2020 (higher means more crime):
| City: | 280.7 |
| U.S. average: | 219.5 |
Travel time to work (commute)
![Travel time to work (commute)]()
- 5Less than 5 minutes
- 405 to 9 minutes
- 3910 to 14 minutes
- 4315 to 19 minutes
- 7420 to 24 minutes
- 1225 to 29 minutes
- 4730 to 34 minutes
- 2335 to 39 minutes
- 3345 to 59 minutes
- 1960 to 89 minutes
- 1290 or more minutes

Means of transportation to work
![Means of transportation to work]()
- 58.2%336Drove a car alone
- 18.2%105Carpooled
- 17.8%103Bus
- 0.3%2Long-distance train or commuter rail
- 0.2%1Ferryboat
- 2.1%12Taxi
- 0.9%5Motorcycle
- 2.8%16Bicycle
- 28.4%164Walked
- 18.2%105Other means
- 36.7%212Worked at home

Time leaving home to go to work
![Time leaving home to go to work]()
- 2312:00 a.m. to 4:59 a.m.
- 175:00 a.m. to 5:29 a.m.
- 175:30 a.m. to 5:59 a.m.
- 326:00 a.m. to 6:29 a.m.
- 356:30 a.m. to 6:59 a.m.
- 377:00 a.m. to 7:29 a.m.
- 177:30 a.m. to 7:59 a.m.
- 338:00 a.m. to 8:29 a.m.
- 118:30 a.m. to 8:59 a.m.
- 109:00 a.m. to 9:59 a.m.
- 810:00 a.m. to 10:59 a.m.
- 911:00 a.m. to 11:59 a.m.
- 2812:00 p.m. to 3:59 p.m.
- 524:00 p.m. to 11:59 p.m.

Occupations of males:
- Percentage of males in management occupations (except farmers):
Here: 9.0% city: 9.6%
- Percentage of males in business and financial operations occupations:
Here: 7.8% city: 3.6%
- Percentage of males in computer and mathematical occupations:
Here: 2.4% city: 3.4%
- Percentage of males in architecture and engineering occupations:
Here: 4.2% city: 1.8%
- Percentage of males in community and social services occupations:
Here: 3.8% city: 0.7%
- Percentage of males in legal occupations:
Here: 2.8% city: 0.9%
- Percentage of males in education, training, and library occupations:
Here: 5.4% city: 2.5%
- Percentage of males in arts, design, entertainment, sports, and media occupations:
Here: 12.3% city: 2.5%
- Percentage of males in healthcare practitioners and technical occupations:
Here: 1.4% city: 3.3%
- Percentage of males in service occupations:
Here: 8.1% city: 23.3%
- Percentage of males in sales and office occupations:
Here: 26.6% city: 16.6%
- Percentage of males in construction, extraction, and maintenance occupations:
Here: 4.0% city: 10.6%
- Percentage of males in production occupations:
Here: 49.3% city: 3.3%
- Percentage of males in material moving occupations:
Here: 10.5% city: 5.4%
Occupations of females:
- Percentage of females in management occupations (except farmers):
Here: 3.3% city: 8.5%
- Percentage of females in community and social services occupations:
Here: 89.4% city: 1.9%
- Percentage of females in legal occupations:
Here: 1.9% city: 1.5%
- Percentage of females in education, training, and library occupations:
Here: 88.8% city: 8.0%
- Percentage of females in arts, design, entertainment, sports, and media occupations:
Here: 8.6% city: 1.8%
- Percentage of females in healthcare practitioners and technical occupations:
Here: 2.5% city: 7.4%
- Percentage of females in service occupations:
Here: 23.3% city: 26.5%
- Percentage of females in sales and office occupations:
Here: 34.8% city: 30.5%
- Percentage of females in construction, extraction, and maintenance occupations:
Here: 3.8% city: 0.4%
- Percentage of females in production occupations:
Here: 32.1% city: 1.8%
- Percentage of females in transportation occupations:
Here: 2.2% city: 1.6%
Percentage of people 16-64 in Armed Forces:
| Parkway Center: | 0.1% |
| Las Vegas: | 1.0% |
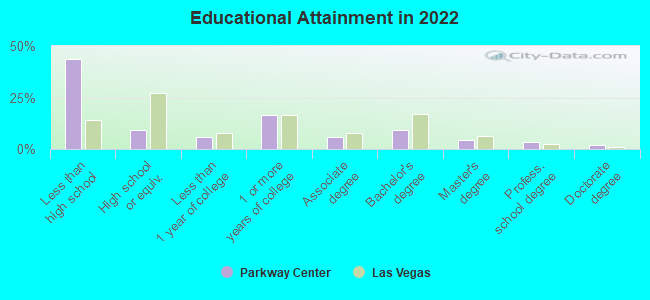
Education in this neighborhood (subdivision or community):
- Percentage of people 3 years and older in K-12 schools:
Parkway Center: 16.5% Las Vegas: 17.4%
- Percentage of people 3 years and older in undergraduate colleges:
Parkway Center: 5.0% Las Vegas: 4.2%
- Percentage of people 3 years and older in grad. or professional schools:
Parkway Center: 4.1% Las Vegas: 1.0%
- Percentage of students K-12 enrolled in private schools:
Parkway Center: 30.5% Las Vegas: 12.9%
Percentage of population below poverty level:
| Parkway Center: | 35.0% |
| Las Vegas: | 14.1% |
Percentage of married-couple families with both working:
| Parkway Center: | 223.4% |
| Las Vegas: | 62.0% |
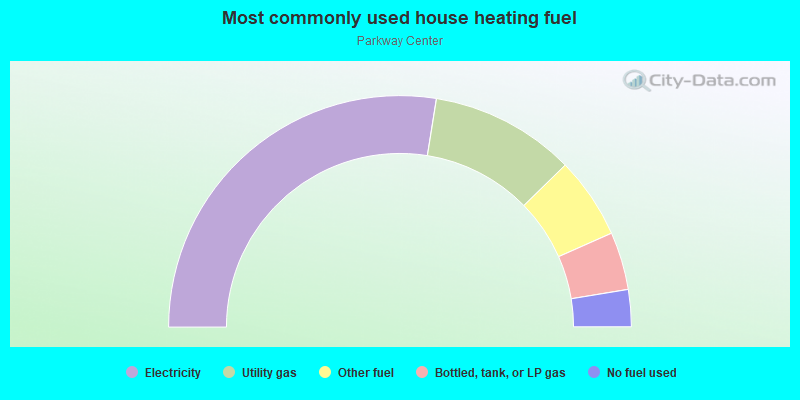
- 55.1%Electricity
- 20.3%Utility gas
- 11.4%Other fuel
- 8.1%Bottled, tank, or LP gas
- 5.2%No fuel used
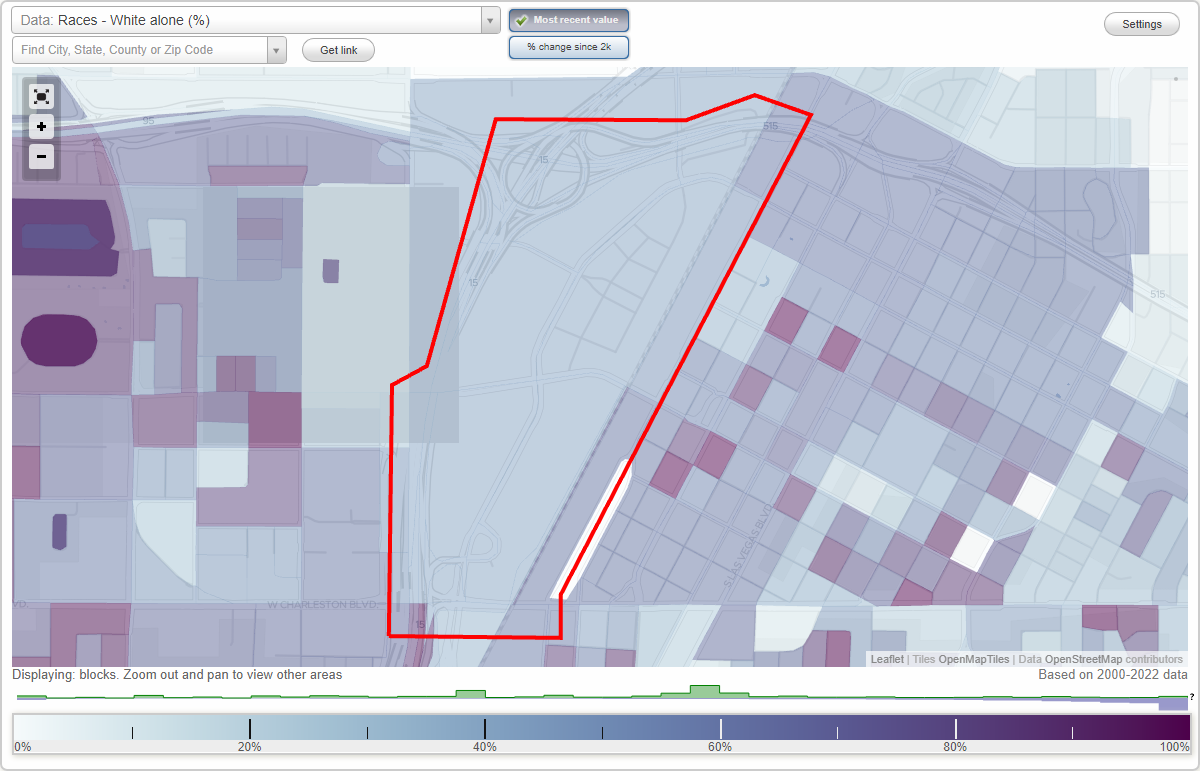
Limited-access highways (interstate or state) in this neighborhood:
I- 15 (Las Vegas Fwy)
Length: 2.64 miles
Directions: N-S, SW-NE
Address range: 24 to 810
Directions: N-S, SW-NE
Address range: 24 to 810
I- 515 (US Hwy 95, Oran K Gragson Expy, US Hwy 93)
Length: 1.52 miles
Direction: E-W
Address range: 411 to 895
Direction: E-W
Address range: 411 to 895
Oran K Gragson Expy (US Hwy 95)
Length: 0.22 miles
Direction: E-W
Direction: E-W
Roads and streets:
S Grand Central Pkwy
Length: 1.24 miles
Directions: E-W, N-S, SE-NW, SW-NE
Address range: 1 to 1079
Directions: E-W, N-S, SE-NW, SW-NE
Address range: 1 to 1079
W Bonneville Ave
Length: 0.66 miles
Directions: E-W, SE-NW
Address range: 1 to 1399
Directions: E-W, SE-NW
Address range: 1 to 1399
S Main St
Length: 0.64 miles
Directions: N-S, SW-NE
Address range: 1 to 719
Directions: N-S, SW-NE
Address range: 1 to 719
S Martin L King Blvd
Length: 0.51 miles
Direction: N-S
Address range: 500 to 1099
Direction: N-S
Address range: 500 to 1099
W Charleston Blvd
Length: 0.51 miles
Direction: E-W
Address range: 26 to 1510
Direction: E-W
Address range: 26 to 1510
N Main St
Length: 0.32 miles
Direction: SW-NE
Address range: 1 to 425
Direction: SW-NE
Address range: 1 to 425
W Ogden
Length: 0.26 miles
Directions: E-W, SE-NW
Address range: 1 to 299
Directions: E-W, SE-NW
Address range: 1 to 299
Discovery Dr
Length: 0.22 miles
Directions: E-W, SE-NW
Directions: E-W, SE-NW
Iron Horse Dr
Length: 0.20 miles
Directions: E-W, N-S, SE-NW, SW-NE
Directions: E-W, N-S, SE-NW, SW-NE
Desert Ln
Length: 0.13 miles
Direction: N-S
Address range: 1000 to 1099
Direction: N-S
Address range: 1000 to 1099
F St
Length: 0.11 miles
Direction: N-S
Address range: 100 to 199
Direction: N-S
Address range: 100 to 199
Alta Dr (W Bonneville Ave)
Length: 0.08 miles
Direction: E-W
Address range: 1400 to 1499
Direction: E-W
Address range: 1400 to 1499
Hastings Ave
Length: 0.05 miles
Direction: E-W
Address range: 1500 to 1516
Direction: E-W
Address range: 1500 to 1516
Railroad features:
Union Pacific RR
Length: 2.44 miles
Directions: N-S, SW-NE
Directions: N-S, SW-NE
Up RR
Length: 1.64 miles
Direction: SW-NE
Direction: SW-NE
Other features:
Las Vegas Crk
Length: 1.07 miles
Directions: E-W, N-S, SE-NW, SW-NE
Directions: E-W, N-S, SE-NW, SW-NE