Park (Lorraine) neighborhood in San Jose, California (CA), 95110 detailed profile
Settings
X

Business Search - 14 Million verified businesses
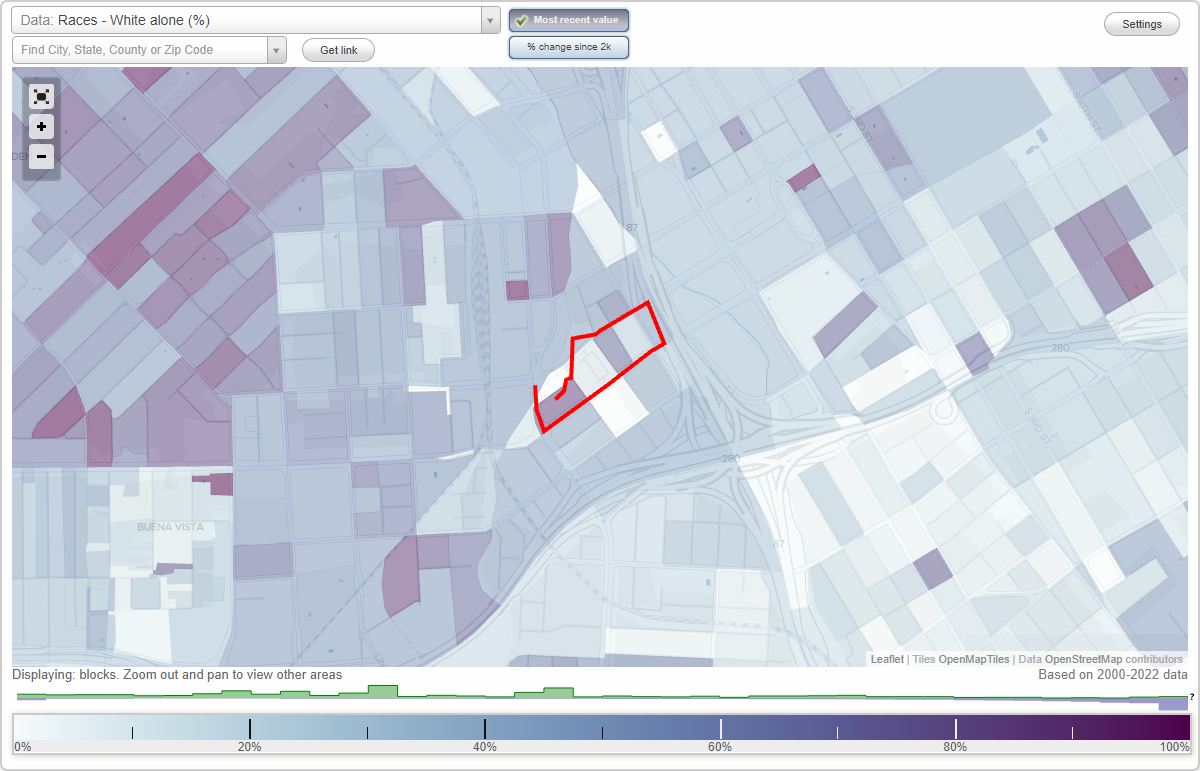
Area: 0.036 square miles
Population: 399
Population density:
| Park (Lorraine): | 11,134 people per square mile |
| San Jose: | 5,554 people per square mile |

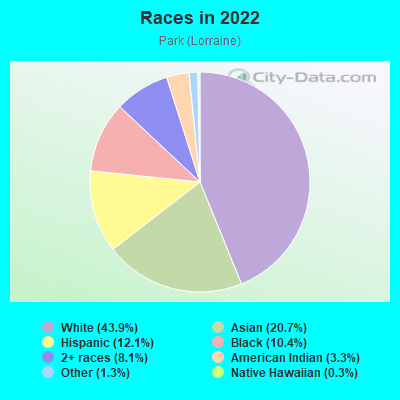
- 17443.9%White
- 8220.7%Asian
- 4812.1%Hispanic or Latino
- 4110.4%Black
- 328.1%Two or more races
- 133.3%American Indian
- 51.3%Some other race
- 10.3%Native Hawaiian and Other
Pacific Islander
Median household income in 2022:
| Park (Lorraine): | $141,562 |
| San Jose: | $133,835 |
Distribution of median household income
![Distribution of median household income]()
- 3Less than $10,000
- 9$10,000 to $19,999
- 2$20,000 to $29,999
- 14$30,000 to $39,999
- 14$40,000 to $49,999
- 3$50,000 to $59,999
- 3$60,000 to $74,999
- 29$75,000 to $99,999
- 12$100,000 to $124,999
- 10$125,000 to $149,999
- 33$150,000 to $199,999
- 126$200,000 or more

Distribution of owner-occupied house/condo value
![Distribution of owner-occupied house/condo value]()
- 2$50,000 to $99,999
- 4$300,000 to $399,999
- 3$400,000 to $499,999
- 8$500,000 to $749,999
- 34$750,000 to $999,999
- 48$1,000,000 or more

Distribution of rent paid by renters
![Distribution of rent paid by renters]()
- 2$200 to $299
- 32$300 to $399
- 14$500 to $599
- 8$700 to $799
- 3$800 to $899
- 4$900 to $999
- 14$1,000 to $1,249
- 3$1,250 to $1,499
- 3$1,500 to $1,999
- 126$2,000 or more

Median rent in 2022:
| Park (Lorraine): | $2,972 |
| San Jose: | $2,001 |
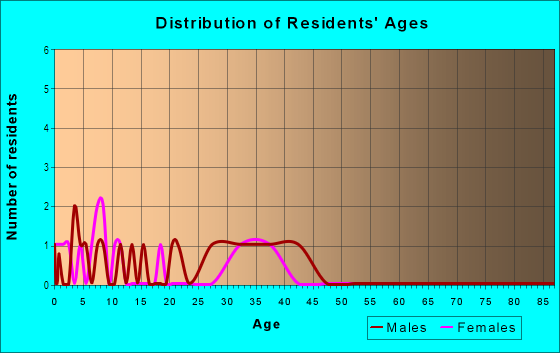
| Males: | 225 |
| Females: | 173 |
Males:
| This neighborhood: | 37.5 years |
| Whole city: | 37.6 years |
| This neighborhood: | 33.5 years |
| Whole city: | 39.1 years |
Average household size:
| Park (Lorraine): | 2.1 people |
| San Jose: | 2.9 people |
Percentage of family households:
| Park (Lorraine): | 29.7% |
| San Jose: | 49.9% |
| Here: | 27.5% |
| San Jose: | 53.0% |
Percentage of married-couple families with children (among all households):
| Park (Lorraine): | 61.3% |
| San Jose: | 25.8% |
Percentage of single-mother households (among all households):
| Park (Lorraine): | 6.4% |
| San Jose: | 5.2% |
Percentage of never married males 15 years old and over:
Percentage of never married females 15 years old and over:
| Park (Lorraine): | 30.1% |
| San Jose: | 20.9% |
Percentage of never married females 15 years old and over:
| Park (Lorraine): | 12.5% |
| city: | 16.7% |
Percentage of people that speak English not well or not at all:
| Park (Lorraine): | 7.5% |
| San Jose: | 11.4% |
Percentage of people born in this state:
Percentage of people born in another U.S. state:
Percentage of native residents but born outside the U.S.:
Percentage of foreign born residents:
| Here: | 35.5% |
| San Jose: | 46.1% |
Percentage of people born in another U.S. state:
| Park (Lorraine): | 30.3% |
| San Jose: | 10.4% |
Percentage of native residents but born outside the U.S.:
| Here: | 1.3% |
| city: | 1.7% |
Percentage of foreign born residents:
| Here: | 32.9% |
| San Jose: | 41.8% |
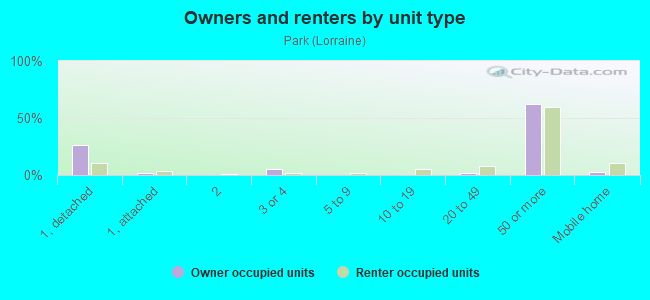
Owner-occupied
Renter-occupied

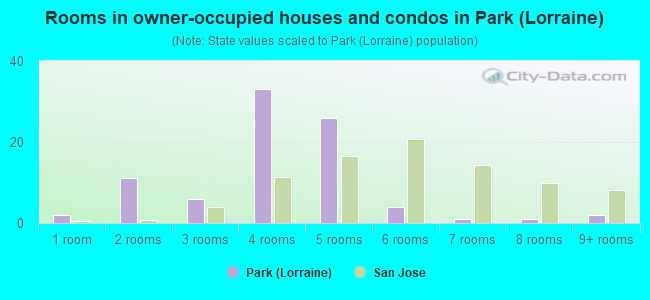
- Rooms in owner-occupied houses and condos in Park <
> - 21 room
- 112 rooms
- 63 rooms
- 334 rooms
- 265 rooms
- 46 rooms
- 17 rooms
- 18 rooms
- 29+ rooms
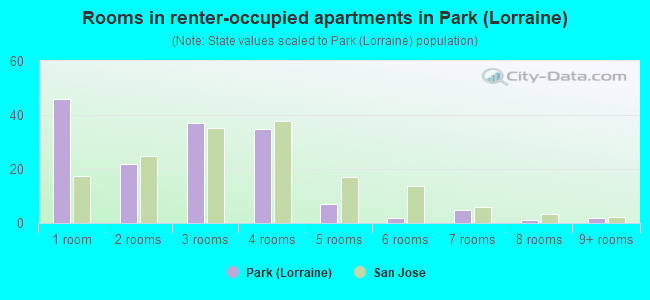
- Rooms in renter-occupied apartments in Park <
> - 461 room
- 222 rooms
- 373 rooms
- 354 rooms
- 75 rooms
- 26 rooms
- 57 rooms
- 18 rooms
- 29+ rooms
Owner-occupied
Renter-occupied
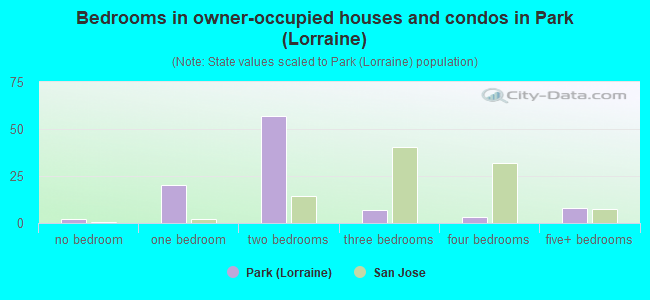
- Bedrooms in owner-occupied houses and condos in Park <
> - 2no bedroom
- 201 bedroom
- 572 bedrooms
- 73 bedrooms
- 34 bedrooms
- 85+ bedrooms
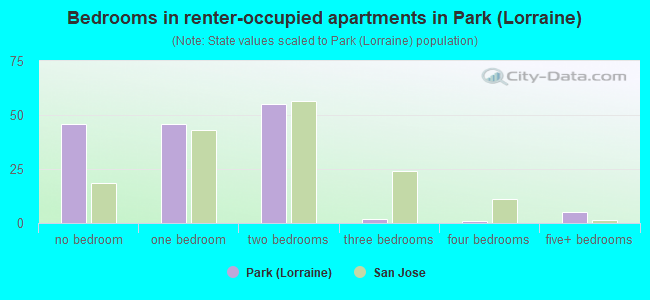
- Bedrooms in renter-occupied apartments in Park <
> - 46no bedroom
- 461 bedroom
- 552 bedrooms
- 23 bedrooms
- 14 bedrooms
- 55+ bedrooms
Average number of cars or other vehicles available in houses/condos:
Average number of cars or other vehicles available in apartments:
| This neighborhood: | 1.3 |
| San Jose: | 2.3 |
Average number of cars or other vehicles available in apartments:
| Here: | 1.0 |
| city: | 1.6 |
Percentage of units with a mortgage:
| Park (Lorraine): | 82.3% |
| San Jose: | 66.9% |
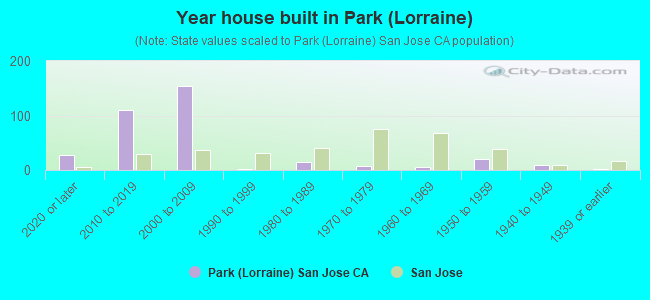
- Year house built in Park <
> - 282020 or later
- 1102010 to 2019
- 1552000 to 2009
- 21990 to 1999
- 141980 to 1989
- 71970 to 1979
- 51960 to 1969
- 201950 to 1959
- 101940 to 1949
- 21939 or earlier
City-data.com crime index for city in 2020 (higher means more crime):
| City: | 268.4 |
| U.S. average: | 219.5 |
Travel time to work (commute)
![Travel time to work (commute)]()
- 4Less than 5 minutes
- 325 to 9 minutes
- 5110 to 14 minutes
- 6015 to 19 minutes
- 6720 to 24 minutes
- 2325 to 29 minutes
- 5030 to 34 minutes
- 1035 to 39 minutes
- 2140 to 44 minutes
- 2645 to 59 minutes
- 3660 to 89 minutes
- 490 or more minutes

Means of transportation to work
![Means of transportation to work]()
- 50.6%151Drove a car alone
- 3.7%11Carpooled
- 4.0%12Bus
- 4.7%14Long-distance train or commuter rail
- 0.7%2Light rail, streetcar or trolley
- 1.0%3Taxi
- 1.0%3Motorcycle
- 0.7%2Bicycle
- 8.4%25Walked
- 1.3%4Other means
- 24.5%73Worked at home

Time leaving home to go to work
![Time leaving home to go to work]()
- 15:00 a.m. to 5:29 a.m.
- 105:30 a.m. to 5:59 a.m.
- 116:00 a.m. to 6:29 a.m.
- 236:30 a.m. to 6:59 a.m.
- 487:00 a.m. to 7:29 a.m.
- 427:30 a.m. to 7:59 a.m.
- 918:00 a.m. to 8:29 a.m.
- 198:30 a.m. to 8:59 a.m.
- 469:00 a.m. to 9:59 a.m.
- 2910:00 a.m. to 10:59 a.m.
- 1111:00 a.m. to 11:59 a.m.
- 4012:00 p.m. to 3:59 p.m.
- 94:00 p.m. to 11:59 p.m.

Occupations of males:
- Percentage of males in management occupations (except farmers):
Here: 36.6% city: 13.0%
- Percentage of males in business and financial operations occupations:
Here: 6.0% city: 4.6%
- Percentage of males in computer and mathematical occupations:
Here: 20.5% city: 13.6%
- Percentage of males in architecture and engineering occupations:
Here: 15.8% city: 10.2%
- Percentage of males in life, physical, and social science occupations:
Here: 1.1% city: 1.1%
- Percentage of males in legal occupations:
Here: 1.2% city: 0.8%
- Percentage of males in arts, design, entertainment, sports, and media occupations:
Here: 3.5% city: 1.8%
- Percentage of males in healthcare practitioners and technical occupations:
Here: 1.5% city: 2.0%
- Percentage of males in service occupations:
Here: 1.1% city: 12.7%
- Percentage of males in sales and office occupations:
Here: 8.5% city: 12.8%
- Percentage of males in construction, extraction, and maintenance occupations:
Here: 2.1% city: 7.8%
- Percentage of males in production occupations:
Here: 1.2% city: 5.5%
Occupations of females:
- Percentage of females in management occupations (except farmers):
Here: 11.5% city: 11.0%
- Percentage of females in computer and mathematical occupations:
Here: 5.9% city: 5.4%
- Percentage of females in architecture and engineering occupations:
Here: 9.4% city: 2.8%
- Percentage of females in life, physical, and social science occupations:
Here: 9.9% city: 1.7%
- Percentage of females in community and social services occupations:
Here: 3.1% city: 1.8%
- Percentage of females in legal occupations:
Here: 4.0% city: 1.3%
- Percentage of females in arts, design, entertainment, sports, and media occupations:
Here: 11.8% city: 2.0%
- Percentage of females in healthcare practitioners and technical occupations:
Here: 16.7% city: 6.8%
- Percentage of females in service occupations:
Here: 12.0% city: 21.7%
- Percentage of females in sales and office occupations:
Here: 12.5% city: 22.0%
- Percentage of females in construction, extraction, and maintenance occupations:
Here: 3.3% city: 0.2%
- Percentage of females in material moving occupations:
Here: 5.5% city: 1.5%
Percentage of people 16-64 in Armed Forces:
| Park (Lorraine): | 0.1% |
| San Jose: | 0.0% |
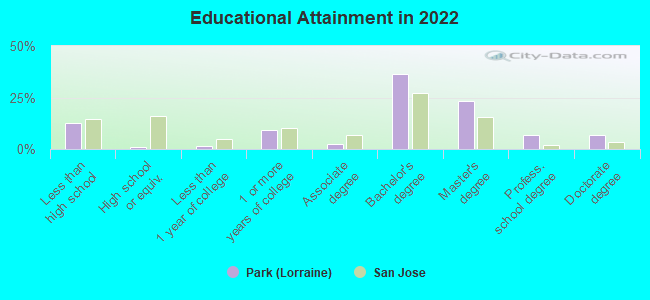
Education in this neighborhood (subdivision or community):
- Percentage of people 3 years and older in K-12 schools:
Park (Lorraine): 5.8% San Jose: 16.1%
- Percentage of people 3 years and older in undergraduate colleges:
Park (Lorraine): 4.0% San Jose: 6.5%
- Percentage of people 3 years and older in grad. or professional schools:
Park (Lorraine): 2.8% San Jose: 2.0%
- Percentage of students K-12 enrolled in private schools:
Park (Lorraine): 47.8% San Jose: 14.9%
Percentage of population below poverty level:
| Park (Lorraine): | 11.7% |
| San Jose: | 9.0% |
Median year renter moved in (as recorded in 2022):
| Park (Lorraine): | 2019 |
| San Jose: | 2020 |
Percentage of married-couple families with both working:
| Park (Lorraine): | 77.1% |
| San Jose: | 72.5% |
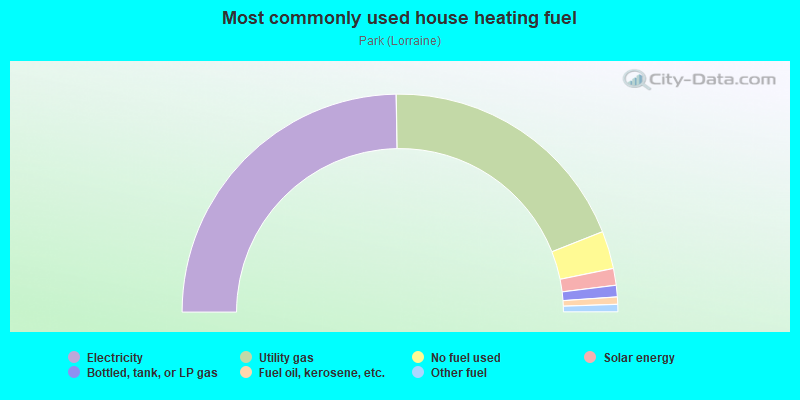
- 49.4%Electricity
- 38.5%Utility gas
- 5.6%No fuel used
- 2.5%Solar energy
- 1.7%Bottled, tank, or LP gas
- 1.1%Fuel oil, kerosene, etc.
- 1.1%Other fuel
Highways in this neighborhood:
State Hwy 82 (W San Carlos St)
Length: 0.23 miles
Direction: SW-NE
Address range: 400 to 498
Direction: SW-NE
Address range: 400 to 498
Roads and streets:
Josefa St
Length: 0.07 miles
Direction: SE-NW
Address range: 250 to 299
Direction: SE-NW
Address range: 250 to 299