Palomino neighborhood in Las Vegas, Nevada (NV), 89107 detailed profile
Settings
X


Business Search - 14 Million verified businesses
Area: 0.257 square miles
Population: 230
Population density:
| Palomino: | 893 people per square mile |
| Las Vegas: | 5,792 people per square mile |

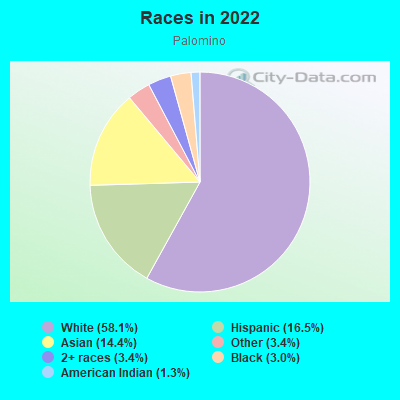
- 13758.1%White
- 3916.5%Hispanic or Latino
- 3414.4%Asian
- 83.4%Some other race
- 83.4%Two or more races
- 73.0%Black
- 31.3%American Indian
Distribution of median household income
![Distribution of median household income]()
- 4Less than $10,000
- 37$10,000 to $19,999
- 26$20,000 to $29,999
- 10$30,000 to $39,999
- 28$40,000 to $49,999
- 2$50,000 to $59,999
- 12$60,000 to $74,999
- 20$75,000 to $99,999
- 6$100,000 to $124,999
- 5$125,000 to $149,999
- 3$150,000 to $199,999
- 31$200,000 or more

Distribution of owner-occupied house/condo value
![Distribution of owner-occupied house/condo value]()
- 26Less than $50,000
- 3$50,000 to $99,999
- 15$100,000 to $149,999
- 41$150,000 to $199,999
- 14$200,000 to $249,999
- 116$250,000 to $299,999
- 12$300,000 to $399,999
- 12$400,000 to $499,999
- 13$500,000 to $749,999
- 16$750,000 to $999,999
- 23$1,000,000 or more

Distribution of rent paid by renters
![Distribution of rent paid by renters]()
- 45$300 to $399
- 3$500 to $599
- 5$600 to $699
- 14$700 to $799
- 10$800 to $899
- 17$900 to $999
- 11$1,000 to $1,249
- 66$1,250 to $1,499
- 4$1,500 to $1,999
- 4$2,000 or more

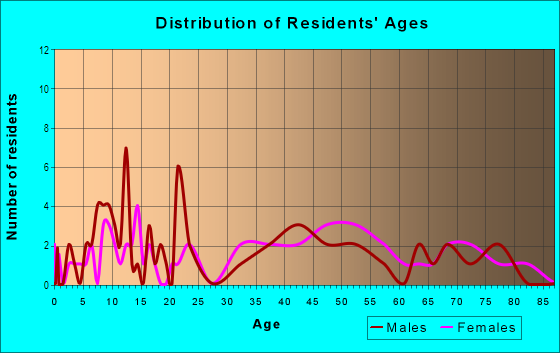
| Males: | 117 |
| Females: | 112 |
Males:
| This neighborhood: | 40.6 years |
| Whole city: | 38.4 years |
| This neighborhood: | 40.6 years |
| Whole city: | 38.9 years |
Average household size:
| Palomino: | 2.9 people |
| Las Vegas: | 2.7 people |
Percentage of family households:
| Palomino: | 44.0% |
| Las Vegas: | 45.8% |
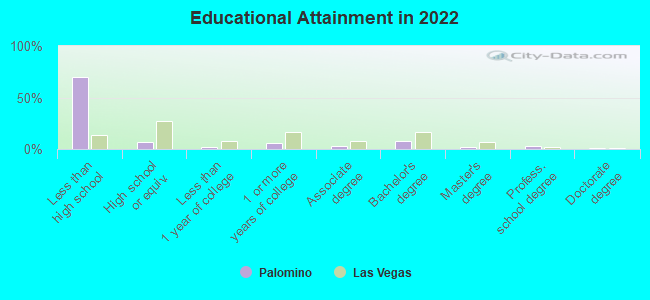
| Here: | 69.0% |
| Las Vegas: | 40.9% |
Percentage of married-couple families with children (among all households):
| Palomino: | 27.2% |
| Las Vegas: | 23.4% |
Percentage of single-mother households (among all households):
| Palomino: | 29.1% |
| Las Vegas: | 10.1% |
Percentage of never married males 15 years old and over:
Percentage of never married females 15 years old and over:
| Palomino: | 14.7% |
| Las Vegas: | 19.7% |
Percentage of never married females 15 years old and over:
| Palomino: | 12.3% |
| city: | 17.0% |
Percentage of people that speak English not well or not at all:
| Palomino: | 0.9% |
| Las Vegas: | 7.0% |
Percentage of people born in this state:
Percentage of people born in another U.S. state:
Percentage of native residents but born outside the U.S.:
Percentage of foreign born residents:
| Here: | 28.9% |
| Las Vegas: | 27.3% |
Percentage of people born in another U.S. state:
| Palomino: | 51.6% |
| Las Vegas: | 49.8% |
Percentage of native residents but born outside the U.S.:
| Here: | 2.6% |
| city: | 1.9% |
Percentage of foreign born residents:
| Here: | 16.9% |
| Las Vegas: | 21.0% |
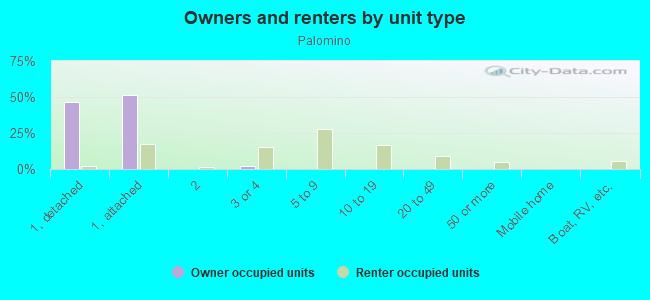
Owner-occupied
Renter-occupied

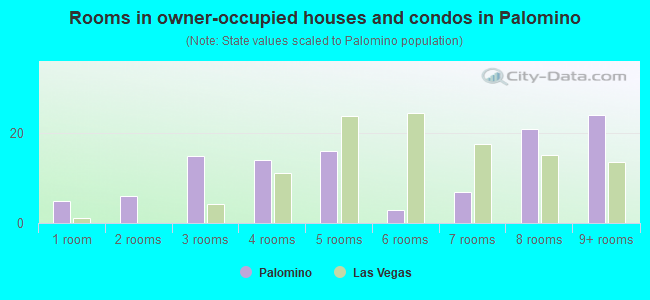
- Rooms in owner-occupied houses and condos in Palomino
- 51 room
- 62 rooms
- 153 rooms
- 144 rooms
- 165 rooms
- 36 rooms
- 77 rooms
- 218 rooms
- 249+ rooms
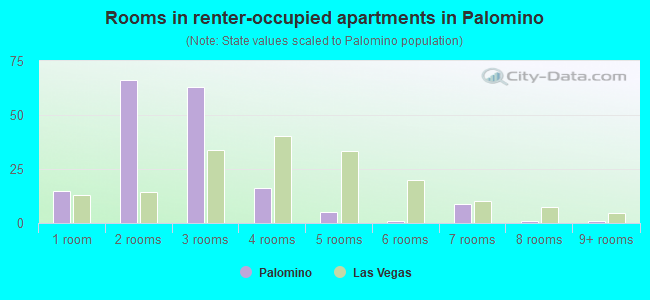
- Rooms in renter-occupied apartments in Palomino
- 151 room
- 662 rooms
- 633 rooms
- 164 rooms
- 55 rooms
- 16 rooms
- 97 rooms
- 18 rooms
- 19+ rooms
Owner-occupied
Renter-occupied
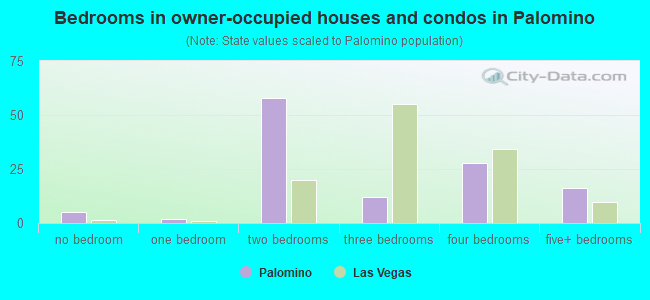
- Bedrooms in owner-occupied houses and condos in Palomino
- 5no bedroom
- 21 bedroom
- 582 bedrooms
- 123 bedrooms
- 284 bedrooms
- 165+ bedrooms
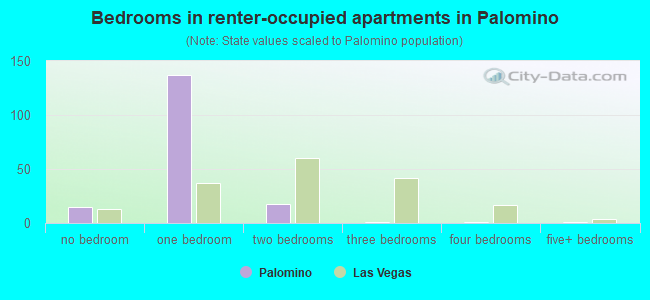
- Bedrooms in renter-occupied apartments in Palomino
- 15no bedroom
- 1371 bedroom
- 182 bedrooms
- 13 bedrooms
- 14 bedrooms
- 15+ bedrooms
Average number of cars or other vehicles available in houses/condos:
Average number of cars or other vehicles available in apartments:
| This neighborhood: | 2.8 |
| Las Vegas: | 2.0 |
Average number of cars or other vehicles available in apartments:
| Here: | 2.4 |
| city: | 1.3 |
Percentage of units with a mortgage:
| Palomino: | 51.7% |
| Las Vegas: | 69.3% |
Average estimated value of detached houses in 2022 (97.1% of all units):
| Palomino: | $859,026 |
| Nevada: | $549,327 |
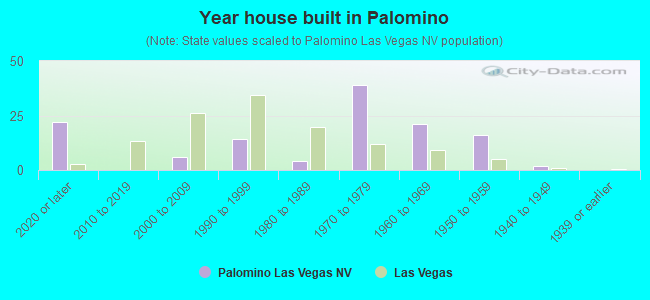
- Year house built in Palomino
- 222020 or later
- 02010 to 2019
- 62000 to 2009
- 141990 to 1999
- 41980 to 1989
- 391970 to 1979
- 211960 to 1969
- 161950 to 1959
- 21940 to 1949
- 01939 or earlier
City-data.com crime index for city in 2020 (higher means more crime):
| City: | 280.7 |
| U.S. average: | 219.5 |
Travel time to work (commute)
![Travel time to work (commute)]()
- 7Less than 5 minutes
- 75 to 9 minutes
- 1210 to 14 minutes
- 1215 to 19 minutes
- 2620 to 24 minutes
- 1225 to 29 minutes
- 1330 to 34 minutes
- 140 to 44 minutes
- 945 to 59 minutes
- 160 to 89 minutes

Means of transportation to work
![Means of transportation to work]()
- 81.9%78Drove a car alone
- 14.7%14Carpooled
- 4.2%4Motorcycle
- 2.1%2Bicycle
- 12.6%12Other means
- 14.7%14Worked at home

Time leaving home to go to work
![Time leaving home to go to work]()
- 112:00 a.m. to 4:59 a.m.
- 185:00 a.m. to 5:29 a.m.
- 56:00 a.m. to 6:29 a.m.
- 126:30 a.m. to 6:59 a.m.
- 57:00 a.m. to 7:29 a.m.
- 117:30 a.m. to 7:59 a.m.
- 128:00 a.m. to 8:29 a.m.
- 138:30 a.m. to 8:59 a.m.
- 149:00 a.m. to 9:59 a.m.
- 710:00 a.m. to 10:59 a.m.
- 1011:00 a.m. to 11:59 a.m.
- 412:00 p.m. to 3:59 p.m.
- 24:00 p.m. to 11:59 p.m.

Occupations of males:
- Percentage of males in management occupations (except farmers):
Here: 27.0% city: 9.6%
- Percentage of males in business and financial operations occupations:
Here: 2.1% city: 3.6%
- Percentage of males in computer and mathematical occupations:
Here: 3.2% city: 3.4%
- Percentage of males in architecture and engineering occupations:
Here: 7.2% city: 1.8%
- Percentage of males in legal occupations:
Here: 7.3% city: 0.9%
- Percentage of males in service occupations:
Here: 17.7% city: 23.3%
- Percentage of males in sales and office occupations:
Here: 17.7% city: 16.6%
- Percentage of males in production occupations:
Here: 13.4% city: 3.3%
Occupations of females:
- Percentage of females in management occupations (except farmers):
Here: 13.9% city: 8.5%
- Percentage of females in business and financial operations occupations:
Here: 9.6% city: 5.7%
- Percentage of females in computer and mathematical occupations:
Here: 3.4% city: 1.1%
- Percentage of females in legal occupations:
Here: 13.8% city: 1.5%
- Percentage of females in education, training, and library occupations:
Here: 3.1% city: 8.0%
- Percentage of females in healthcare practitioners and technical occupations:
Here: 6.1% city: 7.4%
- Percentage of females in service occupations:
Here: 17.6% city: 26.5%
- Percentage of females in sales and office occupations:
Here: 30.6% city: 30.5%
- Percentage of females in production occupations:
Here: 1.8% city: 1.8%
Percentage of people 16-64 in Armed Forces:
| Palomino: | 0.0% |
| Las Vegas: | 1.0% |
Education in this neighborhood (subdivision or community):
- Percentage of people 3 years and older in K-12 schools:
Palomino: 52.2% Las Vegas: 17.4%
- Percentage of people 3 years and older in undergraduate colleges:
Palomino: 2.2% Las Vegas: 4.2%
- Percentage of people 3 years and older in grad. or professional schools:
Palomino: 2.2% Las Vegas: 1.0%
- Percentage of students K-12 enrolled in private schools:
Palomino: 16.1% Las Vegas: 12.9%
Percentage of population below poverty level:
| Palomino: | 15.2% |
| Las Vegas: | 14.1% |
Median year owner moved in (as recorded in 2022):
| Palomino: | 2009 |
| Las Vegas: | 2015 |
Percentage of married-couple families with both working:
| Palomino: | 77.1% |
| Las Vegas: | 62.0% |
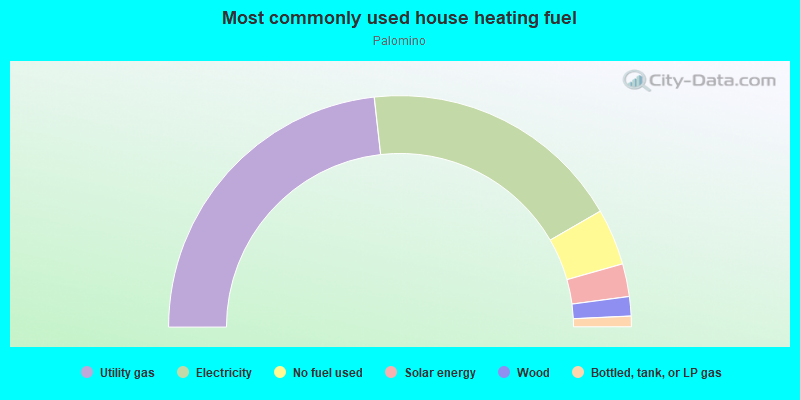
- 46.5%Utility gas
- 36.9%Electricity
- 7.9%No fuel used
- 4.6%Solar energy
- 2.7%Wood
- 1.5%Bottled, tank, or LP gas
Highways in this neighborhood:
State Rte 159 (W Charleston Blvd)
Length: 0.50 miles
Direction: E-W
Address range: 3100 to 3799
Direction: E-W
Address range: 3100 to 3799
Roads and streets:
Campbell Dr
Length: 0.38 miles
Direction: N-S
Address range: 600 to 1099
Direction: N-S
Address range: 600 to 1099
Hastings Ave
Length: 0.31 miles
Direction: E-W
Address range: 3100 to 3499
Direction: E-W
Address range: 3100 to 3499
Palomino Ln
Length: 0.25 miles
Direction: E-W
Address range: 3100 to 3399
Direction: E-W
Address range: 3100 to 3399
Kenny Way
Length: 0.15 miles
Direction: N-S
Address range: 800 to 899
Direction: N-S
Address range: 800 to 899
Lacy Ln
Length: 0.15 miles
Direction: N-S
Address range: 800 to 899
Direction: N-S
Address range: 800 to 899
Cashman Dr
Length: 0.10 miles
Direction: N-S
Address range: 900 to 1099
Direction: N-S
Address range: 900 to 1099