Palmia - Villas neighborhood in Mission Viejo, California (CA), 92692 detailed profile
Settings
X


Business Search - 14 Million verified businesses
Area: 0.156 square miles
Population: 442
Population density:
| Palmia - Villas: | 2,827 people per square mile |
| Mission Viejo: | 4,919 people per square mile |

- 29663.2%White
- 7315.6%Hispanic or Latino
- 429.0%Asian
- 286.0%Black
- 214.5%Two or more races
- 71.5%Native Hawaiian and Other
Pacific Islander - 10.2%American Indian

Median household income in 2022:
| Palmia - Villas: | $184,158 |
| Mission Viejo: | $126,469 |
Distribution of median household income
![Distribution of median household income]()
- 18Less than $10,000
- 14$10,000 to $19,999
- 12$20,000 to $29,999
- 9$30,000 to $39,999
- 30$40,000 to $49,999
- 15$50,000 to $59,999
- 21$60,000 to $74,999
- 42$75,000 to $99,999
- 18$100,000 to $124,999
- 46$125,000 to $149,999
- 31$150,000 to $199,999
- 38$200,000 or more

Distribution of owner-occupied house/condo value
![Distribution of owner-occupied house/condo value]()
- 14Less than $50,000
- 2$100,000 to $149,999
- 2$150,000 to $199,999
- 11$250,000 to $299,999
- 3$300,000 to $399,999
- 8$400,000 to $499,999
- 54$500,000 to $749,999
- 109$750,000 to $999,999
- 38$1,000,000 or more

Distribution of rent paid by renters
![Distribution of rent paid by renters]()
- 5$200 to $299
- 3$300 to $399
- 4$400 to $499
- 5$800 to $899
- 7$900 to $999
- 2$1,000 to $1,249
- 19$1,500 to $1,999
- 78$2,000 or more

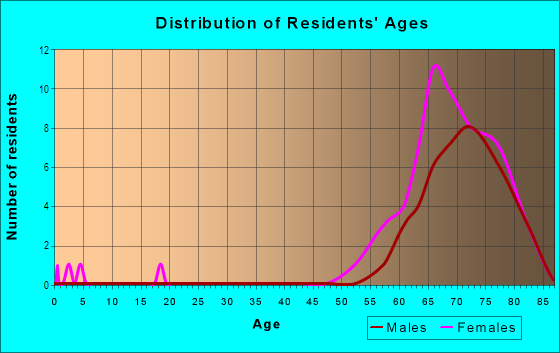
| Males: | 203 |
| Females: | 238 |
Males:
| This neighborhood: | 47.1 years |
| Whole city: | 42.6 years |
| This neighborhood: | 58.6 years |
| Whole city: | 45.6 years |
Average household size:
| Palmia - Villas: | 2.5 people |
| Mission Viejo: | 2.8 people |
Percentage of family households:
| Palmia - Villas: | 21.4% |
| Mission Viejo: | 50.2% |
| Here: | 39.5% |
| Mission Viejo: | 58.8% |
Percentage of married-couple families with children (among all households):
| Palmia - Villas: | 19.3% |
| Mission Viejo: | 29.0% |
Percentage of single-mother households (among all households):
| Palmia - Villas: | 14.8% |
| Mission Viejo: | 5.1% |
Percentage of never married males 15 years old and over:
Percentage of never married females 15 years old and over:
| Palmia - Villas: | 17.0% |
| Mission Viejo: | 17.0% |
Percentage of never married females 15 years old and over:
| Palmia - Villas: | 10.0% |
| city: | 12.1% |
Percentage of people that speak English not well or not at all:
| Palmia - Villas: | 0.9% |
| Mission Viejo: | 3.7% |
Percentage of people born in this state:
Percentage of people born in another U.S. state:
Percentage of native residents but born outside the U.S.:
Percentage of foreign born residents:
| Here: | 58.3% |
| Mission Viejo: | 56.8% |
Percentage of people born in another U.S. state:
| Palmia - Villas: | 21.2% |
| Mission Viejo: | 21.7% |
Percentage of native residents but born outside the U.S.:
| Here: | 1.6% |
| city: | 2.0% |
Percentage of foreign born residents:
| Here: | 18.9% |
| Mission Viejo: | 19.5% |

Owner-occupied
Renter-occupied


- Rooms in owner-occupied houses and condos in Palmia - Villas
- 01 room
- 82 rooms
- 103 rooms
- 304 rooms
- 415 rooms
- 376 rooms
- 257 rooms
- 78 rooms
- 269+ rooms

- Rooms in renter-occupied apartments in Palmia - Villas
- 131 room
- 412 rooms
- 433 rooms
- 324 rooms
- 135 rooms
- 36 rooms
- 107 rooms
- 88 rooms
- 19+ rooms
Owner-occupied
Renter-occupied

- Bedrooms in owner-occupied houses and condos in Palmia - Villas
- 0no bedroom
- 21 bedroom
- 812 bedrooms
- 663 bedrooms
- 104 bedrooms
- 405+ bedrooms

- Bedrooms in renter-occupied apartments in Palmia - Villas
- 13no bedroom
- 861 bedroom
- 392 bedrooms
- 253 bedrooms
- 84 bedrooms
- 25+ bedrooms
Average number of cars or other vehicles available in houses/condos:
Average number of cars or other vehicles available in apartments:
| This neighborhood: | 1.7 |
| Mission Viejo: | 2.3 |
Average number of cars or other vehicles available in apartments:
| Here: | |
| city: |
Percentage of units with a mortgage:
| Palmia - Villas: | 56.2% |
| Mission Viejo: | 76.4% |
Average estimated value of townhouses or other attached units in 2022 (25.2% of all units):
| This neighborhood: | $280,136 |
| California: | $838,546 |

- Year house built in Palmia - Villas
- 02020 or later
- 1332010 to 2019
- 602000 to 2009
- 1461990 to 1999
- 351980 to 1989
- 71970 to 1979
- 131960 to 1969
- 41950 to 1959
- 21940 to 1949
- 41939 or earlier

City-data.com crime index for city in 2020 (higher means more crime):
| City: | 63.4 |
| U.S. average: | 219.5 |
Travel time to work (commute)
![Travel time to work (commute)]()
- 1Less than 5 minutes
- 115 to 9 minutes
- 2910 to 14 minutes
- 2615 to 19 minutes
- 4520 to 24 minutes
- 1825 to 29 minutes
- 4030 to 34 minutes
- 1535 to 39 minutes
- 840 to 44 minutes
- 1145 to 59 minutes
- 1960 to 89 minutes
- 490 or more minutes

Means of transportation to work
![Means of transportation to work]()
- 69.5%136Drove a car alone
- 4.1%8Carpooled
- 2.0%4Bus
- 0.5%1Motorcycle
- 1.5%3Bicycle
- 5.6%11Walked
- 7.2%14Other means
- 22.0%43Worked at home

Time leaving home to go to work
![Time leaving home to go to work]()
- 612:00 a.m. to 4:59 a.m.
- 35:00 a.m. to 5:29 a.m.
- 75:30 a.m. to 5:59 a.m.
- 166:00 a.m. to 6:29 a.m.
- 266:30 a.m. to 6:59 a.m.
- 407:00 a.m. to 7:29 a.m.
- 347:30 a.m. to 7:59 a.m.
- 378:00 a.m. to 8:29 a.m.
- 198:30 a.m. to 8:59 a.m.
- 149:00 a.m. to 9:59 a.m.
- 710:00 a.m. to 10:59 a.m.
- 311:00 a.m. to 11:59 a.m.
- 4612:00 p.m. to 3:59 p.m.
- 144:00 p.m. to 11:59 p.m.

Occupations of males:
- Percentage of males in management occupations (except farmers):
Here: 8.2% city: 21.8%
- Percentage of males in business and financial operations occupations:
Here: 16.0% city: 7.5%
- Percentage of males in computer and mathematical occupations:
Here: 5.9% city: 6.6%
- Percentage of males in life, physical, and social science occupations:
Here: 2.5% city: 0.8%
- Percentage of males in legal occupations:
Here: 2.5% city: 1.7%
- Percentage of males in education, training, and library occupations:
Here: 2.1% city: 3.1%
- Percentage of males in arts, design, entertainment, sports, and media occupations:
Here: 2.7% city: 2.4%
- Percentage of males in healthcare practitioners and technical occupations:
Here: 1.6% city: 2.6%
- Percentage of males in service occupations:
Here: 27.4% city: 12.3%
- Percentage of males in sales and office occupations:
Here: 15.4% city: 19.1%
- Percentage of males in construction, extraction, and maintenance occupations:
Here: 5.6% city: 4.4%
- Percentage of males in production occupations:
Here: 3.2% city: 3.3%
- Percentage of males in transportation occupations:
Here: 2.4% city: 2.5%
Occupations of females:
- Percentage of females in management occupations (except farmers):
Here: 8.8% city: 14.1%
- Percentage of females in business and financial operations occupations:
Here: 7.3% city: 9.2%
- Percentage of females in computer and mathematical occupations:
Here: 3.8% city: 2.8%
- Percentage of females in life, physical, and social science occupations:
Here: 4.8% city: 1.4%
- Percentage of females in community and social services occupations:
Here: 4.0% city: 2.6%
- Percentage of females in legal occupations:
Here: 5.7% city: 2.0%
- Percentage of females in education, training, and library occupations:
Here: 11.8% city: 9.7%
- Percentage of females in arts, design, entertainment, sports, and media occupations:
Here: 8.4% city: 2.4%
- Percentage of females in healthcare practitioners and technical occupations:
Here: 7.2% city: 8.1%
- Percentage of females in service occupations:
Here: 8.2% city: 15.1%
- Percentage of females in sales and office occupations:
Here: 28.5% city: 28.1%
- Percentage of females in material moving occupations:
Here: 1.0% city: 0.5%
Percentage of people 16-64 in Armed Forces:
| Palmia - Villas: | 0.0% |
| Mission Viejo: | 0.2% |
Education in this neighborhood (subdivision or community):
- Percentage of people 3 years and older in K-12 schools:
Palmia - Villas: 22.8% Mission Viejo: 15.0%
- Percentage of people 3 years and older in undergraduate colleges:
Palmia - Villas: 8.4% Mission Viejo: 5.6%
- Percentage of people 3 years and older in grad. or professional schools:
Palmia - Villas: 3.9% Mission Viejo: 1.0%
- Percentage of students K-12 enrolled in private schools:
Palmia - Villas: 61.0% Mission Viejo: 22.1%
Percentage of population below poverty level:
| Palmia - Villas: | 4.2% |
| Mission Viejo: | 9.3% |
Median year owner moved in (as recorded in 2022):
| Palmia - Villas: | 2002 |
| Mission Viejo: | 2008 |
Percentage of married-couple families with both working:
| Palmia - Villas: | 163.6% |
| Mission Viejo: | 78.0% |

- 65.3%Utility gas
- 14.8%Electricity
- 10.4%Bottled, tank, or LP gas
- 5.2%Solar energy
- 3.1%No fuel used
- 1.3%Fuel oil, kerosene, etc.
Roads and streets:
Cancun
Length: 0.33 miles
Directions: E-W, N-S, SE-NW, SW-NE
Address range: 21000 to 21399
Directions: E-W, N-S, SE-NW, SW-NE
Address range: 21000 to 21399
Monterey
Length: 0.27 miles
Directions: E-W, N-S, SW-NE
Address range: 21401 to 21499
Directions: E-W, N-S, SW-NE
Address range: 21401 to 21499
Mazatlan
Length: 0.26 miles
Directions: N-S, SE-NW
Address range: 21000 to 21399
Directions: N-S, SE-NW
Address range: 21000 to 21399
San Miguel
Length: 0.26 miles
Directions: E-W, N-S, SE-NW
Address range: 21100 to 21399
Directions: E-W, N-S, SE-NW
Address range: 21100 to 21399
Manzanillo
Length: 0.15 miles
Directions: N-S, SE-NW, SW-NE
Address range: 21200 to 21399
Directions: N-S, SE-NW, SW-NE
Address range: 21200 to 21399
Acapulco
Length: 0.11 miles
Directions: E-W, SE-NW
Address range: 28400 to 28499
Directions: E-W, SE-NW
Address range: 28400 to 28499
Santa Margarita Pkwy
Length: 0.05 miles
Direction: E-W
Direction: E-W
Los Alisos Blvd
Length: 0.03 miles
Direction: SE-NW
Direction: SE-NW
Other features:
Oso Crk
Length: 0.15 miles
Directions: E-W, N-S, SW-NE
Directions: E-W, N-S, SW-NE