Pacheco neighborhood in San Jose, California (CA), 95133 detailed profile
Settings
X

Business Search - 14 Million verified businesses
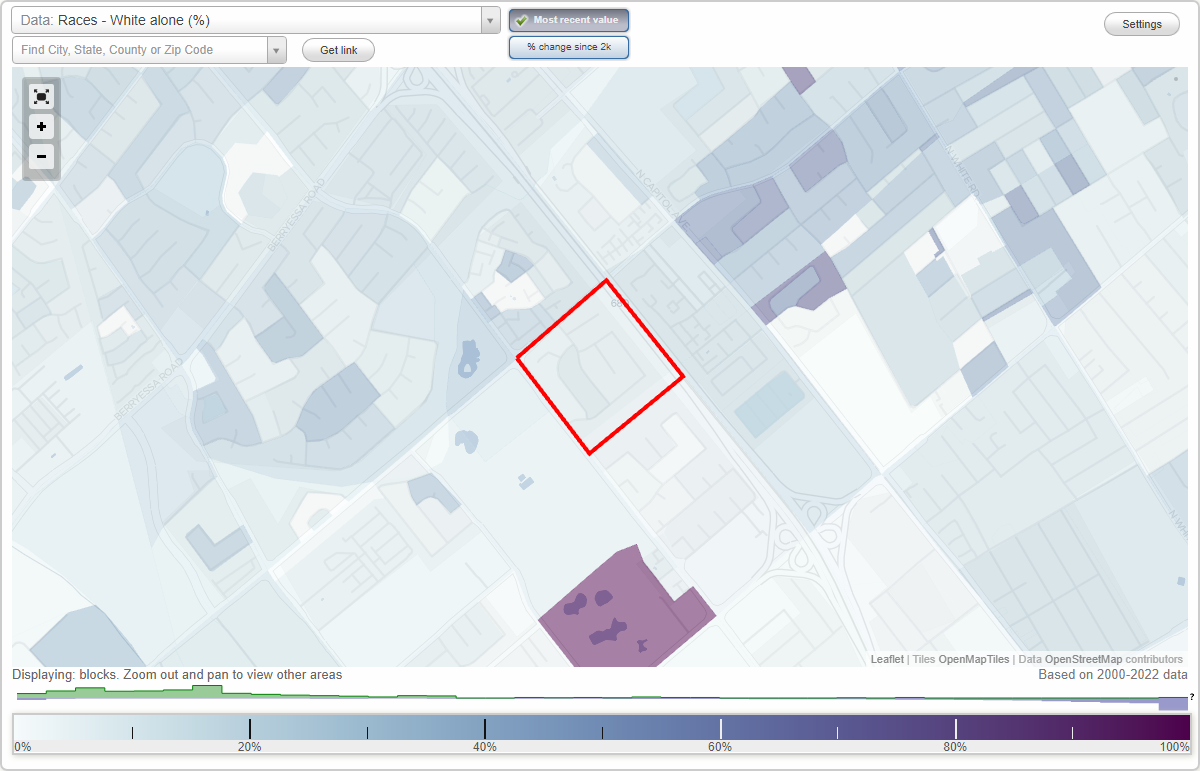
Area: 0.081 square miles
Population: 538
Population density:
| Pacheco: | 6,655 people per square mile |
| San Jose: | 5,554 people per square mile |

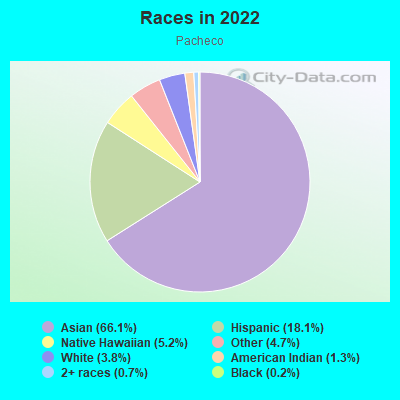
- 39766.1%Asian
- 10918.1%Hispanic or Latino
- 315.2%Native Hawaiian and Other
Pacific Islander - 284.7%Some other race
- 233.8%White
- 81.3%American Indian
- 40.7%Two or more races
- 10.2%Black
Distribution of median household income
![Distribution of median household income]()
- 12Less than $10,000
- 6$10,000 to $19,999
- 9$20,000 to $29,999
- 9$30,000 to $39,999
- 6$40,000 to $49,999
- 11$50,000 to $59,999
- 9$60,000 to $74,999
- 14$75,000 to $99,999
- 9$100,000 to $124,999
- 20$125,000 to $149,999
- 22$150,000 to $199,999
- 27$200,000 or more

Distribution of owner-occupied house/condo value
![Distribution of owner-occupied house/condo value]()
- 6Less than $50,000
- 11$50,000 to $99,999
- 5$150,000 to $199,999
- 3$200,000 to $249,999
- 13$250,000 to $299,999
- 3$400,000 to $499,999
- 19$500,000 to $749,999
- 31$750,000 to $999,999
- 33$1,000,000 or more

Distribution of rent paid by renters
![Distribution of rent paid by renters]()
- 7Less than $100
- 9$200 to $299
- 5$400 to $499
- 5$500 to $599
- 2$600 to $699
- 6$700 to $799
- 7$800 to $899
- 7$900 to $999
- 7$1,000 to $1,249
- 4$1,250 to $1,499
- 3$1,500 to $1,999
- 28$2,000 or more

Median rent in 2022:
| Pacheco: | $1,174 |
| San Jose: | $2,001 |
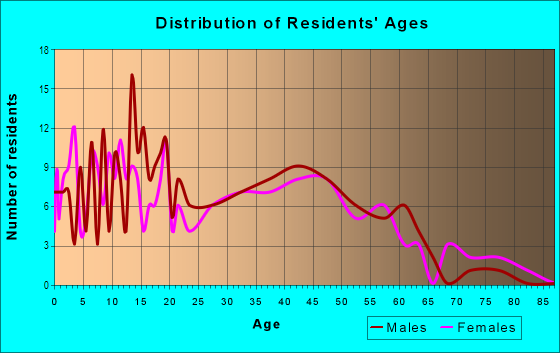
| Males: | 266 |
| Females: | 272 |
Males:
| This neighborhood: | 35.7 years |
| Whole city: | 37.6 years |
| This neighborhood: | 38.2 years |
| Whole city: | 39.1 years |
Average household size:
| Pacheco: | 3.3 people |
| San Jose: | 2.9 people |
Percentage of family households:
| Pacheco: | 50.4% |
| San Jose: | 49.9% |
| Here: | 47.6% |
| San Jose: | 53.0% |
Percentage of married-couple families with children (among all households):
| Pacheco: | 21.2% |
| San Jose: | 25.8% |
Percentage of single-mother households (among all households):
| Pacheco: | 5.8% |
| San Jose: | 5.2% |
Percentage of never married males 15 years old and over:
Percentage of never married females 15 years old and over:
| Pacheco: | 21.6% |
| San Jose: | 20.9% |
Percentage of never married females 15 years old and over:
| Pacheco: | 17.8% |
| city: | 16.7% |
Percentage of people that speak English not well or not at all:
| Pacheco: | 15.6% |
| San Jose: | 11.4% |
Percentage of people born in this state:
Percentage of people born in another U.S. state:
Percentage of native residents but born outside the U.S.:
Percentage of foreign born residents:
| Here: | 41.7% |
| San Jose: | 46.1% |
Percentage of people born in another U.S. state:
| Pacheco: | 3.4% |
| San Jose: | 10.4% |
Percentage of native residents but born outside the U.S.:
| Here: | 0.7% |
| city: | 1.7% |
Percentage of foreign born residents:
| Here: | 54.2% |
| San Jose: | 41.8% |
Owner-occupied
Renter-occupied

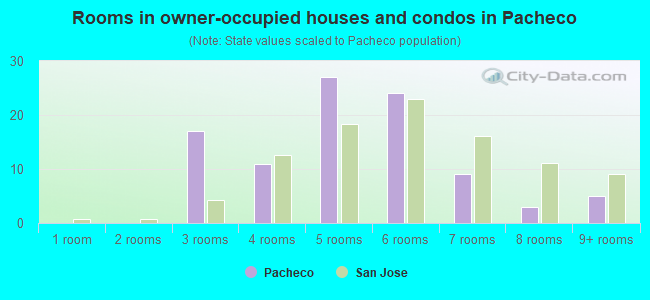
- Rooms in owner-occupied houses and condos in Pacheco
- 01 room
- 02 rooms
- 173 rooms
- 114 rooms
- 275 rooms
- 246 rooms
- 97 rooms
- 38 rooms
- 59+ rooms
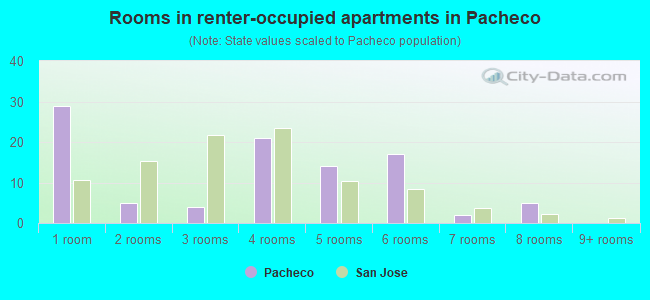
- Rooms in renter-occupied apartments in Pacheco
- 291 room
- 52 rooms
- 43 rooms
- 214 rooms
- 145 rooms
- 176 rooms
- 27 rooms
- 58 rooms
- 09+ rooms
Owner-occupied
Renter-occupied
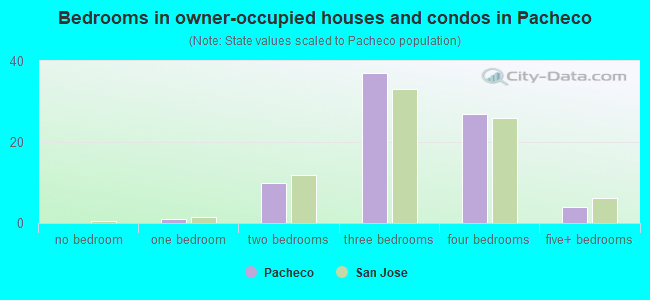
- Bedrooms in owner-occupied houses and condos in Pacheco
- 0no bedroom
- 11 bedroom
- 102 bedrooms
- 373 bedrooms
- 274 bedrooms
- 45+ bedrooms
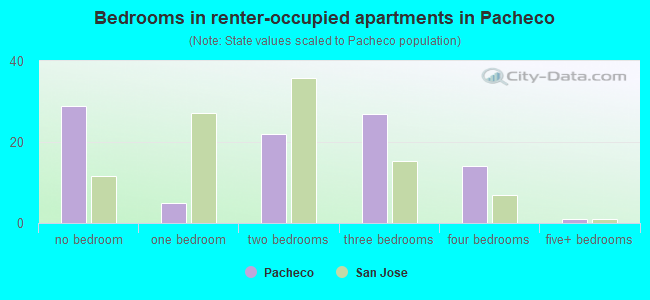
- Bedrooms in renter-occupied apartments in Pacheco
- 29no bedroom
- 51 bedroom
- 222 bedrooms
- 273 bedrooms
- 144 bedrooms
- 15+ bedrooms
Average number of cars or other vehicles available in houses/condos:
Average number of cars or other vehicles available in apartments:
| This neighborhood: | 2.7 |
| San Jose: | 2.3 |
Average number of cars or other vehicles available in apartments:
| Here: | 2.1 |
| city: | 1.6 |
Percentage of units with a mortgage:
| Pacheco: | 69.4% |
| San Jose: | 66.9% |
Housing prices:
- Average estimated value of detached houses in 2022 (58.6% of all units):
Pacheco: $2,252,484 San Jose: $1,532,815
- Average estimated value of townhouses or other attached units in 2022 (15.2% of all units):
This neighborhood: $1,428,928 city: $1,024,857
- Average estimated '22 value of housing units in 5-or-more-unit structures (0.7% of all units):
Pacheco: $988,127 San Jose: $791,954
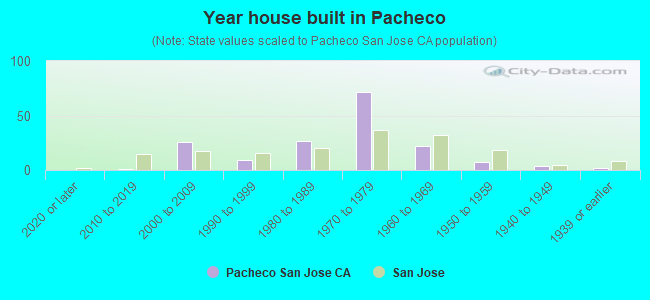
- Year house built in Pacheco
- 02020 or later
- 12010 to 2019
- 262000 to 2009
- 91990 to 1999
- 271980 to 1989
- 721970 to 1979
- 221960 to 1969
- 71950 to 1959
- 41940 to 1949
- 21939 or earlier
City-data.com crime index for city in 2020 (higher means more crime):
| City: | 268.4 |
| U.S. average: | 219.5 |
Travel time to work (commute)
![Travel time to work (commute)]()
- 7Less than 5 minutes
- 85 to 9 minutes
- 5310 to 14 minutes
- 5715 to 19 minutes
- 6920 to 24 minutes
- 3525 to 29 minutes
- 8030 to 34 minutes
- 1035 to 39 minutes
- 2940 to 44 minutes
- 1645 to 59 minutes
- 2960 to 89 minutes
- 590 or more minutes

Means of transportation to work
![Means of transportation to work]()
- 77.2%212Drove a car alone
- 6.6%18Carpooled
- 2.2%6Bus
- 1.5%4Subway or elevated rail
- 0.4%1Long-distance train or commuter rail
- 0.7%2Bicycle
- 1.1%3Walked
- 0.7%2Other means
- 10.6%29Worked at home

Time leaving home to go to work
![Time leaving home to go to work]()
- 2012:00 a.m. to 4:59 a.m.
- 135:00 a.m. to 5:29 a.m.
- 325:30 a.m. to 5:59 a.m.
- 446:00 a.m. to 6:29 a.m.
- 166:30 a.m. to 6:59 a.m.
- 287:00 a.m. to 7:29 a.m.
- 217:30 a.m. to 7:59 a.m.
- 558:00 a.m. to 8:29 a.m.
- 448:30 a.m. to 8:59 a.m.
- 449:00 a.m. to 9:59 a.m.
- 910:00 a.m. to 10:59 a.m.
- 411:00 a.m. to 11:59 a.m.
- 5312:00 p.m. to 3:59 p.m.
- 154:00 p.m. to 11:59 p.m.

Occupations of males:
- Percentage of males in management occupations (except farmers):
Here: 3.9% city: 13.0%
- Percentage of males in business and financial operations occupations:
Here: 1.2% city: 4.6%
- Percentage of males in computer and mathematical occupations:
Here: 8.1% city: 13.6%
- Percentage of males in architecture and engineering occupations:
Here: 2.2% city: 10.2%
- Percentage of males in life, physical, and social science occupations:
Here: 4.8% city: 1.1%
- Percentage of males in community and social services occupations:
Here: 1.0% city: 0.8%
- Percentage of males in education, training, and library occupations:
Here: 4.9% city: 2.8%
- Percentage of males in arts, design, entertainment, sports, and media occupations:
Here: 1.4% city: 1.8%
- Percentage of males in service occupations:
Here: 18.2% city: 12.7%
- Percentage of males in sales and office occupations:
Here: 18.2% city: 12.8%
- Percentage of males in construction, extraction, and maintenance occupations:
Here: 7.2% city: 7.8%
- Percentage of males in production occupations:
Here: 12.1% city: 5.5%
- Percentage of males in transportation occupations:
Here: 7.0% city: 3.6%
- Percentage of males in material moving occupations:
Here: 4.9% city: 3.1%
Occupations of females:
- Percentage of females in management occupations (except farmers):
Here: 8.4% city: 11.0%
- Percentage of females in business and financial operations occupations:
Here: 10.7% city: 8.6%
- Percentage of females in computer and mathematical occupations:
Here: 2.2% city: 5.4%
- Percentage of females in architecture and engineering occupations:
Here: 1.6% city: 2.8%
- Percentage of females in life, physical, and social science occupations:
Here: 2.7% city: 1.7%
- Percentage of females in community and social services occupations:
Here: 1.4% city: 1.8%
- Percentage of females in education, training, and library occupations:
Here: 7.0% city: 8.1%
- Percentage of females in healthcare practitioners and technical occupations:
Here: 10.5% city: 6.8%
- Percentage of females in service occupations:
Here: 22.0% city: 21.7%
- Percentage of females in sales and office occupations:
Here: 20.1% city: 22.0%
- Percentage of females in production occupations:
Here: 11.6% city: 4.0%
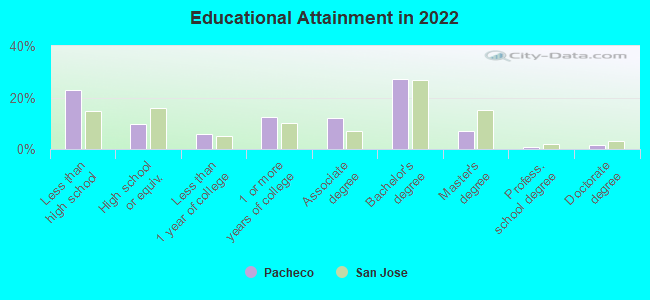
Education in this neighborhood (subdivision or community):
- Percentage of people 3 years and older in K-12 schools:
Pacheco: 10.8% San Jose: 16.1%
- Percentage of people 3 years and older in undergraduate colleges:
Pacheco: 8.3% San Jose: 6.5%
- Percentage of people 3 years and older in grad. or professional schools:
Pacheco: 2.3% San Jose: 2.0%
- Percentage of students K-12 enrolled in private schools:
Pacheco: 54.4% San Jose: 14.9%
Percentage of population below poverty level:
| Pacheco: | 10.8% |
| San Jose: | 9.0% |
Median year owner moved in (as recorded in 2022):
Median year renter moved in (as recorded in 2022):
| Pacheco: | 2007 |
| San Jose: | 2008 |
Median year renter moved in (as recorded in 2022):
| Pacheco: | 2014 |
| San Jose: | 2020 |
Percentage of married-couple families with both working:
| Pacheco: | 75.9% |
| San Jose: | 72.5% |
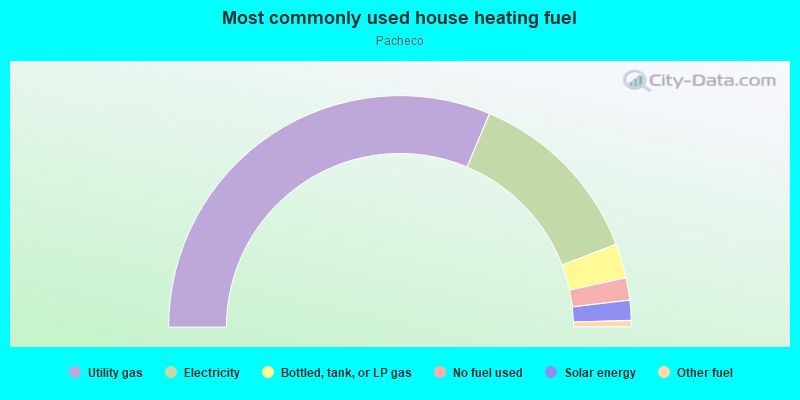
- 62.6%Utility gas
- 25.7%Electricity
- 4.8%Bottled, tank, or LP gas
- 3.1%No fuel used
- 2.8%Solar energy
- 0.9%Other fuel
Roads and streets:
Webster Dr
Length: 0.23 miles
Directions: N-S, SE-NW, SW-NE
Address range: 600 to 799
Directions: N-S, SE-NW, SW-NE
Address range: 600 to 799
Lava Way
Length: 0.21 miles
Directions: N-S, SE-NW
Address range: 600 to 731
Directions: N-S, SE-NW
Address range: 600 to 731
Pacheco Dr
Length: 0.20 miles
Directions: E-W, N-S, SW-NE
Address range: 2309 to 2399
Directions: E-W, N-S, SW-NE
Address range: 2309 to 2399
Ranson Dr
Length: 0.14 miles
Directions: E-W, N-S, SE-NW
Address range: 600 to 799
Directions: E-W, N-S, SE-NW
Address range: 600 to 799
Treadway Dr
Length: 0.11 miles
Directions: E-W, SW-NE
Address range: 2300 to 2499
Directions: E-W, SW-NE
Address range: 2300 to 2499
O Hara Ct
Length: 0.10 miles
Direction: SW-NE
Address range: 2349 to 2413
Direction: SW-NE
Address range: 2349 to 2413
Anvil Ct
Length: 0.09 miles
Direction: SE-NW
Address range: 600 to 799
Direction: SE-NW
Address range: 600 to 799
Darnell Ct
Length: 0.08 miles
Directions: E-W, SW-NE
Address range: 2300 to 2399
Directions: E-W, SW-NE
Address range: 2300 to 2399