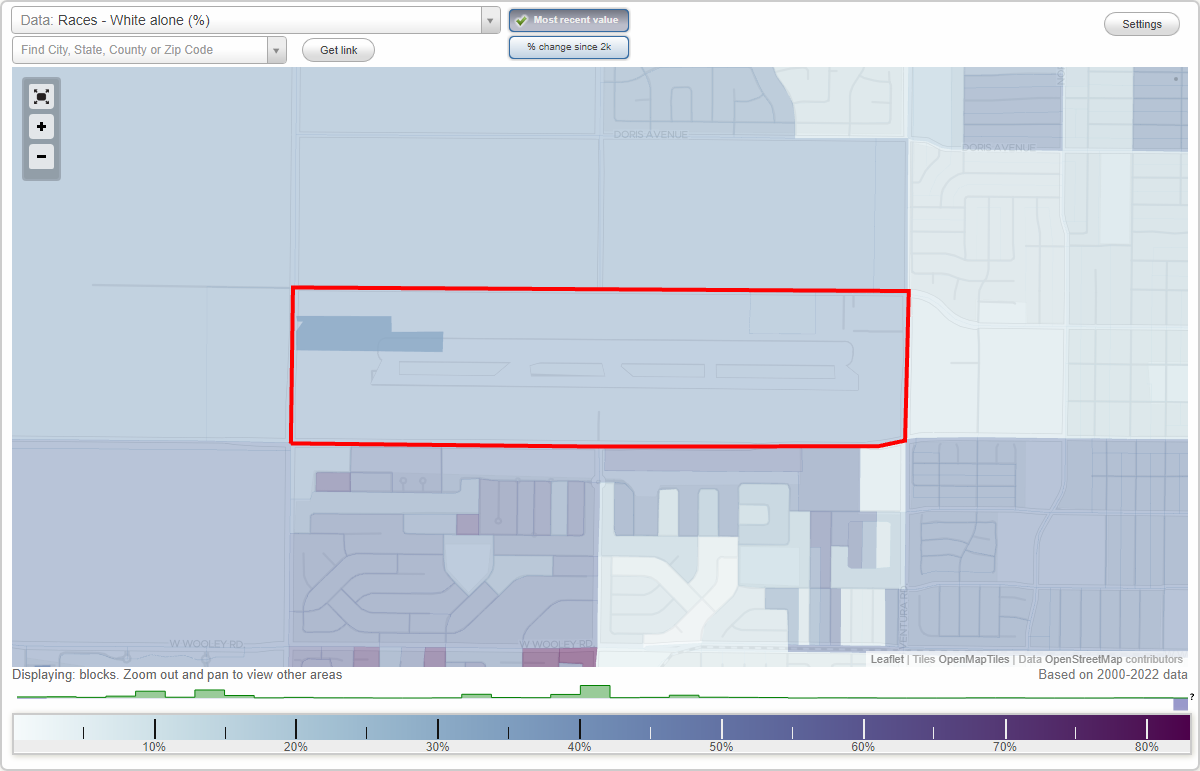
Oxnard Airport neighborhood in Oxnard, California (CA), 93030 detailed profile
Settings
X

Business Search - 14 Million verified businesses
Area: 0.578 square miles
Population: 2,652
Population density:
| Oxnard Airport: | 4,585 people per square mile |
| Oxnard: | 7,918 people per square mile |

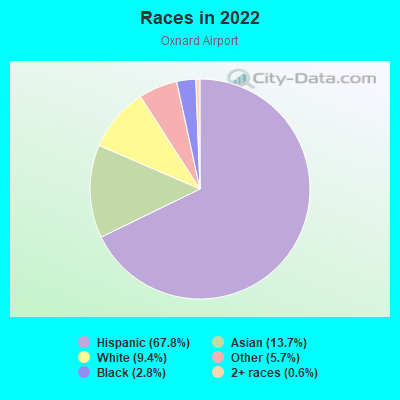
- 1,90667.8%Hispanic or Latino
- 38413.7%Asian
- 2649.4%White
- 1605.7%Some other race
- 802.8%Black
- 160.6%Two or more races
Median household income in 2022:
| Oxnard Airport: | $89,792 |
| Oxnard: | $84,941 |
Distribution of median household income
![Distribution of median household income]()
- 19$20,000 to $29,999
- 40$30,000 to $39,999
- 72$40,000 to $49,999
- 63$50,000 to $59,999
- 139$60,000 to $74,999
- 84$75,000 to $99,999
- 92$100,000 to $124,999
- 72$125,000 to $149,999
- 94$150,000 to $199,999
- 78$200,000 or more

Distribution of owner-occupied house/condo value
![Distribution of owner-occupied house/condo value]()
- 47$50,000 to $99,999
- 19$250,000 to $299,999
- 37$300,000 to $399,999
- 11$400,000 to $499,999
- 307$500,000 to $749,999
- 43$750,000 to $999,999

Distribution of rent paid by renters
![Distribution of rent paid by renters]()
- 28$1,000 to $1,249
- 10$1,250 to $1,499
- 100$1,500 to $1,999
- 199$2,000 or more

Median rent in 2022:
| Oxnard Airport: | $2,161 |
| Oxnard: | $1,876 |
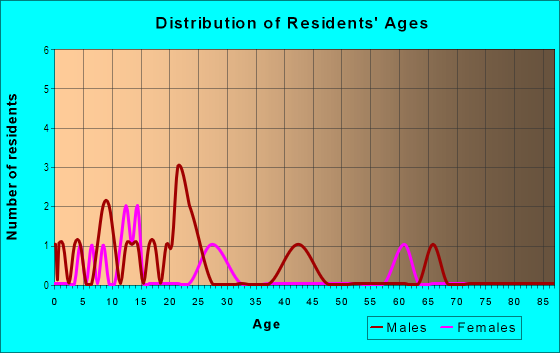
| Males: | 1,416 |
| Females: | 1,236 |
Males:
| This neighborhood: | 34.2 years |
| Whole city: | 35.1 years |
| This neighborhood: | 35.9 years |
| Whole city: | 34.3 years |
Average household size:
| Oxnard Airport: | 3.8 people |
| Oxnard: | 3.6 people |
Percentage of family households:
| Oxnard Airport: | 69.5% |
| Oxnard: | 51.5% |
| Here: | 75.4% |
| Oxnard: | 47.9% |
Percentage of married-couple families with children (among all households):
| Oxnard Airport: | 22.3% |
| Oxnard: | 16.4% |
Percentage of single-mother households (among all households):
| Oxnard Airport: | 4.1% |
| Oxnard: | 8.1% |
Percentage of never married males 15 years old and over:
Percentage of never married females 15 years old and over:
| Oxnard Airport: | 21.3% |
| Oxnard: | 22.9% |
Percentage of never married females 15 years old and over:
| Oxnard Airport: | 13.5% |
| city: | 20.1% |
Percentage of people that speak English not well or not at all:
| Oxnard Airport: | 0.0% |
| Oxnard: | 20.2% |
Percentage of people born in this state:
Percentage of people born in another U.S. state:
Percentage of native residents but born outside the U.S.:
Percentage of foreign born residents:
| Here: | 60.5% |
| Oxnard: | 58.8% |
Percentage of people born in another U.S. state:
| Oxnard Airport: | 8.8% |
| Oxnard: | 6.5% |
Percentage of native residents but born outside the U.S.:
| Here: | 1.3% |
| city: | 1.4% |
Percentage of foreign born residents:
| Here: | 29.3% |
| Oxnard: | 33.3% |
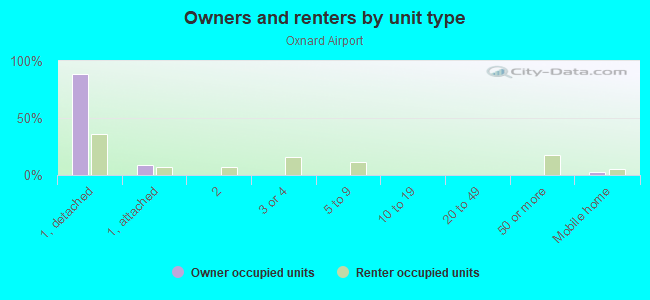
Owner-occupied
Renter-occupied

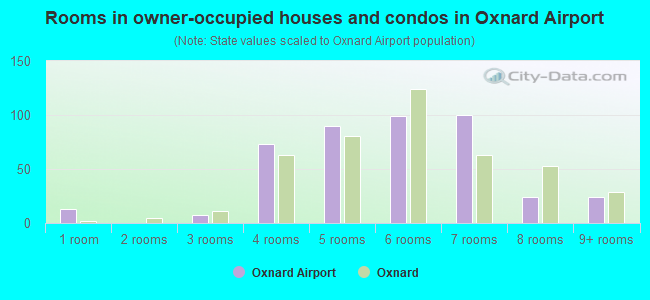
- Rooms in owner-occupied houses and condos in Oxnard Airport
- 131 room
- 02 rooms
- 73 rooms
- 734 rooms
- 905 rooms
- 996 rooms
- 1007 rooms
- 248 rooms
- 249+ rooms
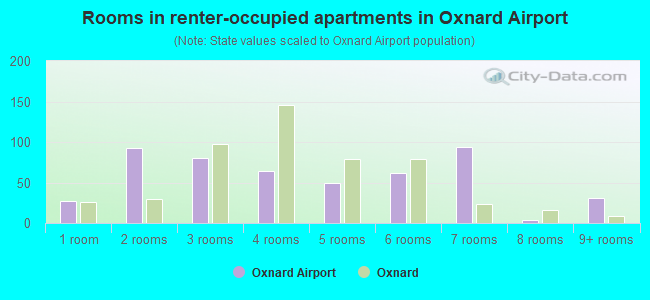
- Rooms in renter-occupied apartments in Oxnard Airport
- 271 room
- 932 rooms
- 803 rooms
- 644 rooms
- 505 rooms
- 626 rooms
- 947 rooms
- 48 rooms
- 319+ rooms
Owner-occupied
Renter-occupied
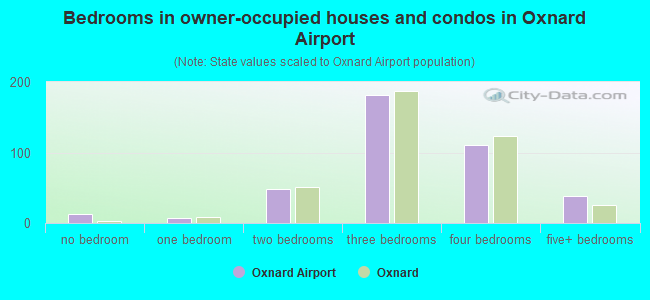
- Bedrooms in owner-occupied houses and condos in Oxnard Airport
- 13no bedroom
- 71 bedroom
- 482 bedrooms
- 1813 bedrooms
- 1114 bedrooms
- 385+ bedrooms
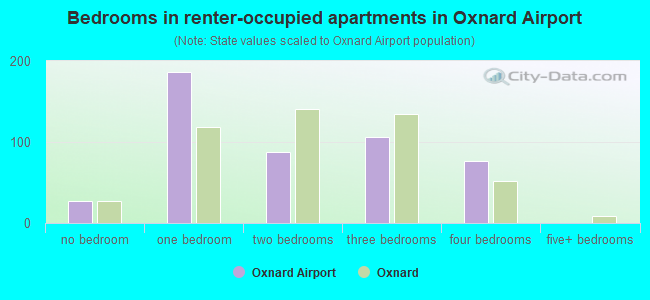
- Bedrooms in renter-occupied apartments in Oxnard Airport
- 27no bedroom
- 1871 bedroom
- 882 bedrooms
- 1063 bedrooms
- 764 bedrooms
- 05+ bedrooms
Average number of cars or other vehicles available in houses/condos:
Average number of cars or other vehicles available in apartments:
| This neighborhood: | 3.0 |
| Oxnard: | 2.5 |
Average number of cars or other vehicles available in apartments:
| Here: | 1.6 |
| city: | 1.9 |
Percentage of units with a mortgage:
| Oxnard Airport: | 82.9% |
| Oxnard: | 65.5% |
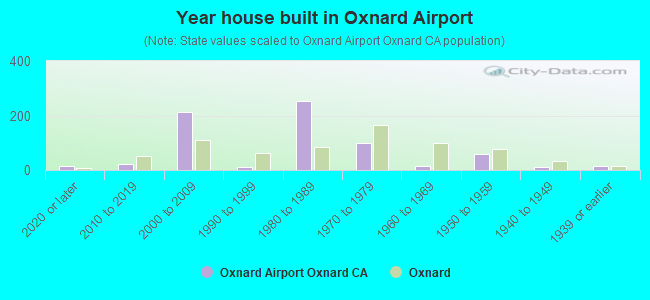
- Year house built in Oxnard Airport
- 132020 or later
- 212010 to 2019
- 2132000 to 2009
- 121990 to 1999
- 2531980 to 1989
- 991970 to 1979
- 131960 to 1969
- 571950 to 1959
- 121940 to 1949
- 151939 or earlier
City-data.com crime index for city in 2020 (higher means more crime):
| City: | 220.0 |
| U.S. average: | 219.5 |
Travel time to work (commute)
![Travel time to work (commute)]()
- 13Less than 5 minutes
- 1965 to 9 minutes
- 44210 to 14 minutes
- 23615 to 19 minutes
- 22420 to 24 minutes
- 94225 to 29 minutes
- 34830 to 34 minutes
- 1835 to 39 minutes
- 9040 to 44 minutes
- 3845 to 59 minutes
- 3360 to 89 minutes
- 4090 or more minutes

Means of transportation to work
![Means of transportation to work]()
- 90.5%1,196Drove a car alone
- 5.1%67Carpooled
- 1.4%18Bus
- 3.0%39Worked at home

Time leaving home to go to work
![Time leaving home to go to work]()
- 20312:00 a.m. to 4:59 a.m.
- 3185:00 a.m. to 5:29 a.m.
- 835:30 a.m. to 5:59 a.m.
- 2746:00 a.m. to 6:29 a.m.
- 3806:30 a.m. to 6:59 a.m.
- 4047:00 a.m. to 7:29 a.m.
- 2467:30 a.m. to 7:59 a.m.
- 1838:00 a.m. to 8:29 a.m.
- 408:30 a.m. to 8:59 a.m.
- 1439:00 a.m. to 9:59 a.m.
- 16910:00 a.m. to 10:59 a.m.
- 12212:00 p.m. to 3:59 p.m.
- 844:00 p.m. to 11:59 p.m.

Occupations of males:
- Percentage of males in management occupations (except farmers):
Here: 7.9% city: 6.2%
- Percentage of males in business and financial operations occupations:
Here: 7.2% city: 2.6%
- Percentage of males in computer and mathematical occupations:
Here: 3.1% city: 2.4%
- Percentage of males in architecture and engineering occupations:
Here: 4.1% city: 3.1%
- Percentage of males in education, training, and library occupations:
Here: 2.1% city: 1.7%
- Percentage of males in healthcare practitioners and technical occupations:
Here: 1.7% city: 1.3%
- Percentage of males in service occupations:
Here: 14.7% city: 16.9%
- Percentage of males in sales and office occupations:
Here: 7.2% city: 11.7%
- Percentage of males in farming, fishing, and forestry occupations:
Here: 9.0% city: 14.1%
- Percentage of males in construction, extraction, and maintenance occupations:
Here: 15.9% city: 9.8%
- Percentage of males in production occupations:
Here: 5.4% city: 9.6%
- Percentage of males in transportation occupations:
Here: 15.7% city: 6.5%
- Percentage of males in material moving occupations:
Here: 1.9% city: 6.3%
Occupations of females:
- Percentage of females in management occupations (except farmers):
Here: 9.3% city: 6.3%
- Percentage of females in business and financial operations occupations:
Here: 3.9% city: 5.3%
- Percentage of females in computer and mathematical occupations:
Here: 1.7% city: 0.9%
- Percentage of females in education, training, and library occupations:
Here: 14.4% city: 4.9%
- Percentage of females in arts, design, entertainment, sports, and media occupations:
Here: 3.1% city: 1.5%
- Percentage of females in healthcare practitioners and technical occupations:
Here: 10.4% city: 5.9%
- Percentage of females in service occupations:
Here: 20.3% city: 23.6%
- Percentage of females in sales and office occupations:
Here: 25.9% city: 27.3%
- Percentage of females in farming, fishing, and forestry occupations:
Here: 3.9% city: 8.0%
- Percentage of females in production occupations:
Here: 11.0% city: 6.8%
- Percentage of females in transportation occupations:
Here: 1.4% city: 0.9%
- Percentage of females in material moving occupations:
Here: 1.7% city: 3.7%
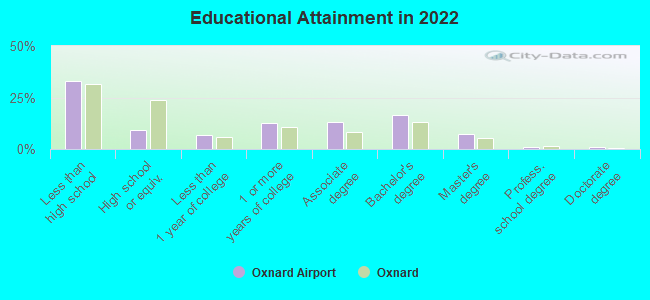
Education in this neighborhood (subdivision or community):
- Percentage of people 3 years and older in K-12 schools:
Oxnard Airport: 20.0% Oxnard: 21.0%
- Percentage of people 3 years and older in undergraduate colleges:
Oxnard Airport: 7.2% Oxnard: 5.2%
- Percentage of people 3 years and older in grad. or professional schools:
Oxnard Airport: 3.4% Oxnard: 0.8%
- Percentage of students K-12 enrolled in private schools:
Oxnard Airport: 1.3% Oxnard: 4.0%
Percentage of population below poverty level:
| Oxnard Airport: | 1.9% |
| Oxnard: | 12.8% |
Median year owner moved in (as recorded in 2022):
Median year renter moved in (as recorded in 2022):
| Oxnard Airport: | 2008 |
| Oxnard: | 2006 |
Median year renter moved in (as recorded in 2022):
| Oxnard Airport: | 2013 |
| Oxnard: | 2019 |
Percentage of married-couple families with both working:
| Oxnard Airport: | 65.0% |
| Oxnard: | 71.8% |
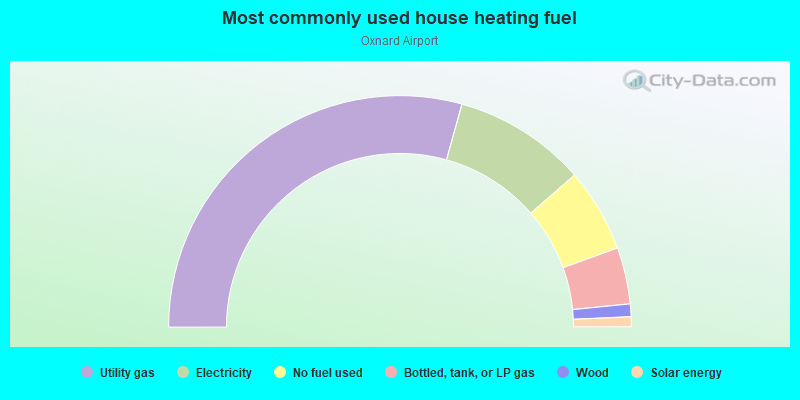
- 58.7%Utility gas
- 18.6%Electricity
- 11.7%No fuel used
- 7.9%Bottled, tank, or LP gas
- 1.8%Wood
- 1.4%Solar energy
Roads and streets:
W 5th St
Length: 1.70 miles
Direction: E-W
Address range: 1500 to 3499
Direction: E-W
Address range: 1500 to 3499
Teal Club Rd
Length: 0.91 miles
Direction: E-W
Address range: 1500 to 2899
Direction: E-W
Address range: 1500 to 2899
S Ventura Rd
Length: 0.36 miles
Direction: N-S
Address range: 1 to 499
Direction: N-S
Address range: 1 to 499
Little Farms Rd
Length: 0.16 miles
Direction: E-W
Address range: 1500 to 1899
Direction: E-W
Address range: 1500 to 1899
S Patterson Rd
Length: 0.11 miles
Direction: N-S
Address range: 400 to 467
Direction: N-S
Address range: 400 to 467
Mallard Way
Length: 0.09 miles
Direction: N-S
Address range: 100 to 199
Direction: N-S
Address range: 100 to 199
Brandt Way
Length: 0.03 miles
Direction: N-S
Address range: 100 to 199
Direction: N-S
Address range: 100 to 199
Other features:
Oxnard Arprt
Length: 5.48 miles
Directions: E-W, N-S, SE-NW, SW-NE
Directions: E-W, N-S, SE-NW, SW-NE