Ortega neighborhood in Stockton, California (CA), 95206 detailed profile
Settings
X


Business Search - 14 Million verified businesses
Area: 1.433 square miles
Population: 1,138
Population density:
| Ortega: | 794 people per square mile |
| Stockton: | 5,882 people per square mile |

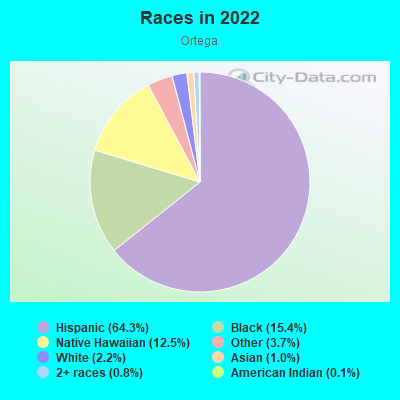
- 90864.3%Hispanic or Latino
- 21815.4%Black
- 17612.5%Native Hawaiian and Other
Pacific Islander - 523.7%Some other race
- 312.2%White
- 141.0%Asian
- 120.8%Two or more races
- 20.1%American Indian
Median household income in 2022:
| Ortega: | $68,857 |
| Stockton: | $76,231 |
Distribution of median household income
![Distribution of median household income]()
- 36Less than $10,000
- 32$10,000 to $19,999
- 46$20,000 to $29,999
- 42$30,000 to $39,999
- 40$40,000 to $49,999
- 28$50,000 to $59,999
- 12$60,000 to $74,999
- 16$75,000 to $99,999
- 45$100,000 to $124,999
- 16$125,000 to $149,999
- 12$150,000 to $199,999
- 8$200,000 or more

Distribution of owner-occupied house/condo value
![Distribution of owner-occupied house/condo value]()
- 17Less than $50,000
- 19$50,000 to $99,999
- 9$100,000 to $149,999
- 27$150,000 to $199,999
- 36$200,000 to $249,999
- 72$250,000 to $299,999
- 77$300,000 to $399,999
- 17$400,000 to $499,999
- 10$500,000 to $749,999
- 8$750,000 to $999,999
- 7$1,000,000 or more

Distribution of rent paid by renters
![Distribution of rent paid by renters]()
- 6$100 to $199
- 40$300 to $399
- 34$400 to $499
- 2$500 to $599
- 7$600 to $699
- 78$700 to $799
- 10$800 to $899
- 12$900 to $999
- 22$1,000 to $1,249
- 8$1,250 to $1,499
- 21$1,500 to $1,999
- 7$2,000 or more

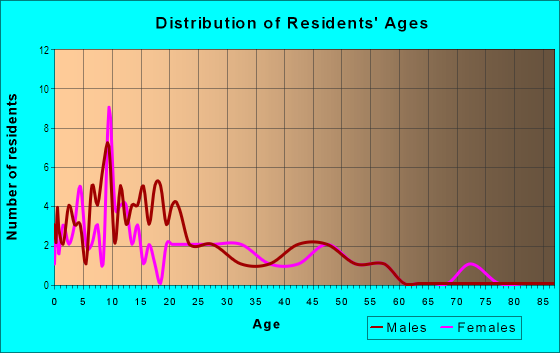
| Males: | 493 |
| Females: | 644 |
Males:
| This neighborhood: | 28.0 years |
| Whole city: | 33.4 years |
| This neighborhood: | 33.7 years |
| Whole city: | 35.2 years |
Average household size:
| Ortega: | 3.7 people |
| Stockton: | 3.2 people |
Percentage of family households:
| Ortega: | 70.1% |
| Stockton: | 51.0% |
| Here: | 59.7% |
| Stockton: | 42.0% |
Percentage of married-couple families with children (among all households):
| Ortega: | 12.9% |
| Stockton: | 19.2% |
Percentage of single-mother households (among all households):
| Ortega: | 14.6% |
| Stockton: | 9.1% |
Percentage of never married males 15 years old and over:
Percentage of never married females 15 years old and over:
| Ortega: | 22.4% |
| Stockton: | 21.6% |
Percentage of never married females 15 years old and over:
| Ortega: | 23.5% |
| city: | 19.3% |
Percentage of people that speak English not well or not at all:
| Ortega: | 23.8% |
| Stockton: | 12.0% |
Percentage of people born in this state:
Percentage of people born in another U.S. state:
Percentage of native residents but born outside the U.S.:
Percentage of foreign born residents:
| Here: | 59.5% |
| Stockton: | 66.1% |
Percentage of people born in another U.S. state:
| Ortega: | 3.8% |
| Stockton: | 7.2% |
Percentage of native residents but born outside the U.S.:
| Here: | 2.7% |
| city: | 1.5% |
Percentage of foreign born residents:
| Here: | 34.0% |
| Stockton: | 25.2% |
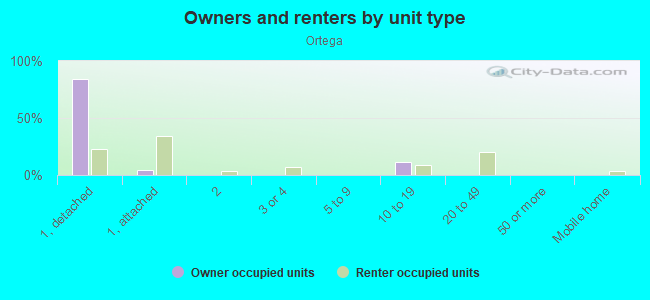
Owner-occupied
Renter-occupied

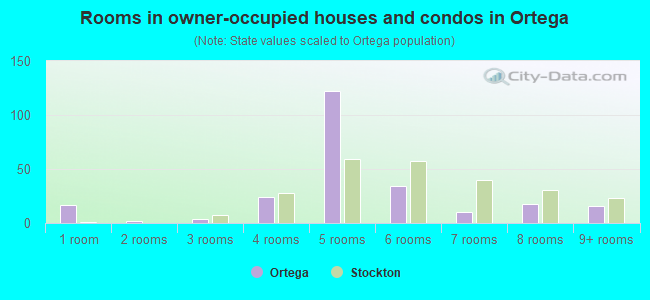
- Rooms in owner-occupied houses and condos in Ortega
- 171 room
- 22 rooms
- 43 rooms
- 244 rooms
- 1225 rooms
- 346 rooms
- 107 rooms
- 188 rooms
- 169+ rooms
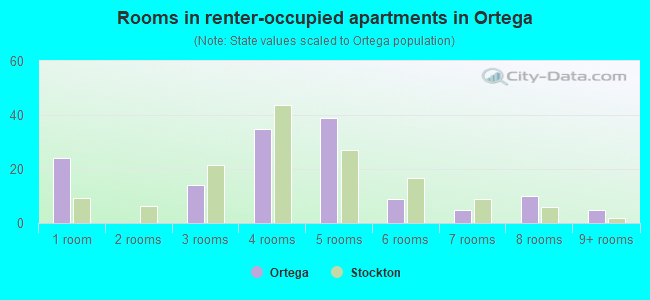
- Rooms in renter-occupied apartments in Ortega
- 241 room
- 02 rooms
- 143 rooms
- 354 rooms
- 395 rooms
- 96 rooms
- 57 rooms
- 108 rooms
- 59+ rooms
Owner-occupied
Renter-occupied
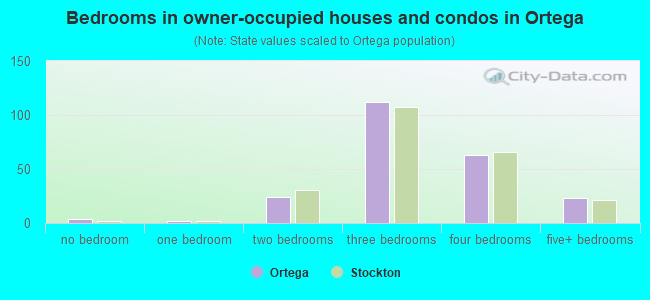
- Bedrooms in owner-occupied houses and condos in Ortega
- 4no bedroom
- 21 bedroom
- 242 bedrooms
- 1123 bedrooms
- 634 bedrooms
- 235+ bedrooms
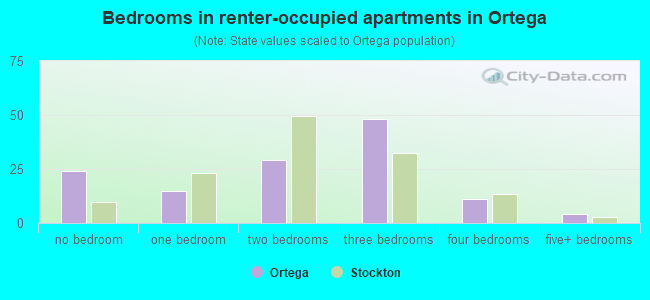
- Bedrooms in renter-occupied apartments in Ortega
- 24no bedroom
- 151 bedroom
- 292 bedrooms
- 483 bedrooms
- 114 bedrooms
- 45+ bedrooms
Average number of cars or other vehicles available in houses/condos:
Average number of cars or other vehicles available in apartments:
| This neighborhood: | 2.3 |
| Stockton: | 2.3 |
Average number of cars or other vehicles available in apartments:
| Here: | 1.8 |
| city: | 1.6 |
Percentage of units with a mortgage:
| Ortega: | 78.3% |
| Stockton: | 70.5% |
Average estimated value of detached houses in 2022 (95.0% of all units):
| Ortega: | $319,764 |
| California: | $988,808 |
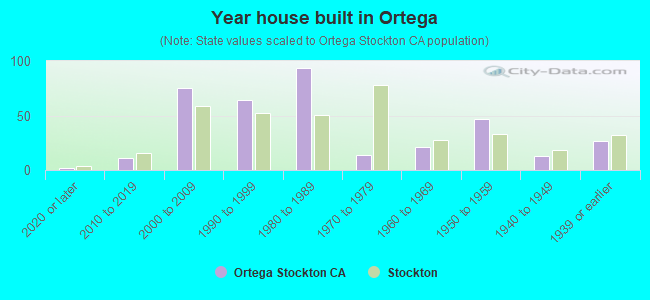
- Year house built in Ortega
- 22020 or later
- 112010 to 2019
- 752000 to 2009
- 641990 to 1999
- 941980 to 1989
- 141970 to 1979
- 211960 to 1969
- 471950 to 1959
- 131940 to 1949
- 271939 or earlier
City-data.com crime index for city in 2020 (higher means more crime):
| City: | 505.2 |
| U.S. average: | 219.5 |
Travel time to work (commute)
![Travel time to work (commute)]()
- 2Less than 5 minutes
- 565 to 9 minutes
- 10810 to 14 minutes
- 11615 to 19 minutes
- 7220 to 24 minutes
- 1225 to 29 minutes
- 7330 to 34 minutes
- 1035 to 39 minutes
- 5640 to 44 minutes
- 945 to 59 minutes
- 7560 to 89 minutes
- 4190 or more minutes

Means of transportation to work
![Means of transportation to work]()
- 73.4%181Drove a car alone
- 21.5%53Carpooled
- 1.6%4Bus
- 2.4%6Motorcycle
- 8.5%21Bicycle
- 7.7%19Walked
- 7.3%18Other means
- 4.1%10Worked at home

Time leaving home to go to work
![Time leaving home to go to work]()
- 7712:00 a.m. to 4:59 a.m.
- 405:00 a.m. to 5:29 a.m.
- 195:30 a.m. to 5:59 a.m.
- 766:00 a.m. to 6:29 a.m.
- 396:30 a.m. to 6:59 a.m.
- 857:00 a.m. to 7:29 a.m.
- 377:30 a.m. to 7:59 a.m.
- 908:00 a.m. to 8:29 a.m.
- 78:30 a.m. to 8:59 a.m.
- 569:00 a.m. to 9:59 a.m.
- 1110:00 a.m. to 10:59 a.m.
- 211:00 a.m. to 11:59 a.m.
- 5712:00 p.m. to 3:59 p.m.
- 444:00 p.m. to 11:59 p.m.

Occupations of males:
- Percentage of males in management occupations (except farmers):
Here: 1.4% city: 6.6%
- Percentage of males in architecture and engineering occupations:
Here: 1.3% city: 1.6%
- Percentage of males in life, physical, and social science occupations:
Here: 2.0% city: 0.4%
- Percentage of males in education, training, and library occupations:
Here: 4.3% city: 2.3%
- Percentage of males in arts, design, entertainment, sports, and media occupations:
Here: 1.2% city: 1.4%
- Percentage of males in healthcare practitioners and technical occupations:
Here: 2.2% city: 2.7%
- Percentage of males in service occupations:
Here: 2.9% city: 16.9%
- Percentage of males in sales and office occupations:
Here: 28.1% city: 13.8%
- Percentage of males in farming, fishing, and forestry occupations:
Here: 1.2% city: 4.6%
- Percentage of males in construction, extraction, and maintenance occupations:
Here: 30.1% city: 10.5%
- Percentage of males in production occupations:
Here: 16.8% city: 8.0%
- Percentage of males in transportation occupations:
Here: 6.7% city: 9.6%
- Percentage of males in material moving occupations:
Here: 4.2% city: 10.7%
Occupations of females:
- Percentage of females in management occupations (except farmers):
Here: 2.7% city: 5.9%
- Percentage of females in computer and mathematical occupations:
Here: 3.7% city: 1.0%
- Percentage of females in legal occupations:
Here: 1.3% city: 0.6%
- Percentage of females in arts, design, entertainment, sports, and media occupations:
Here: 6.0% city: 0.9%
- Percentage of females in healthcare practitioners and technical occupations:
Here: 5.6% city: 8.3%
- Percentage of females in service occupations:
Here: 22.8% city: 24.4%
- Percentage of females in sales and office occupations:
Here: 28.4% city: 26.5%
- Percentage of females in farming, fishing, and forestry occupations:
Here: 2.7% city: 2.1%
- Percentage of females in production occupations:
Here: 8.5% city: 4.6%
- Percentage of females in material moving occupations:
Here: 25.2% city: 6.3%
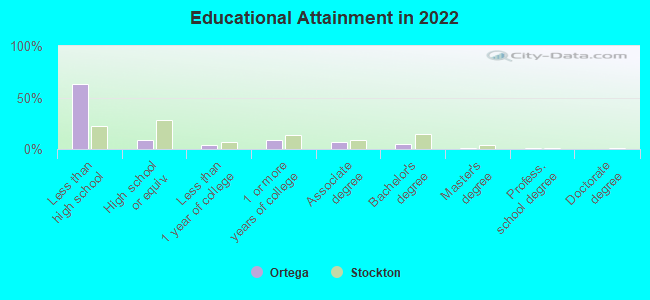
Education in this neighborhood (subdivision or community):
- Percentage of people 3 years and older in K-12 schools:
Ortega: 34.8% Stockton: 20.8%
- Percentage of people 3 years and older in undergraduate colleges:
Ortega: 8.7% Stockton: 5.2%
- Percentage of people 3 years and older in grad. or professional schools:
Ortega: 7.6% Stockton: 1.3%
- Percentage of students K-12 enrolled in private schools:
Ortega: 13.0% Stockton: 4.2%
Percentage of population below poverty level:
| Ortega: | 19.6% |
| Stockton: | 14.8% |
Median year owner moved in (as recorded in 2022):
Median year renter moved in (as recorded in 2022):
| Ortega: | 2008 |
| Stockton: | 2011 |
Median year renter moved in (as recorded in 2022):
| Ortega: | 2017 |
| Stockton: | 2018 |
Percentage of married-couple families with both working:
| Ortega: | 47.3% |
| Stockton: | 67.8% |
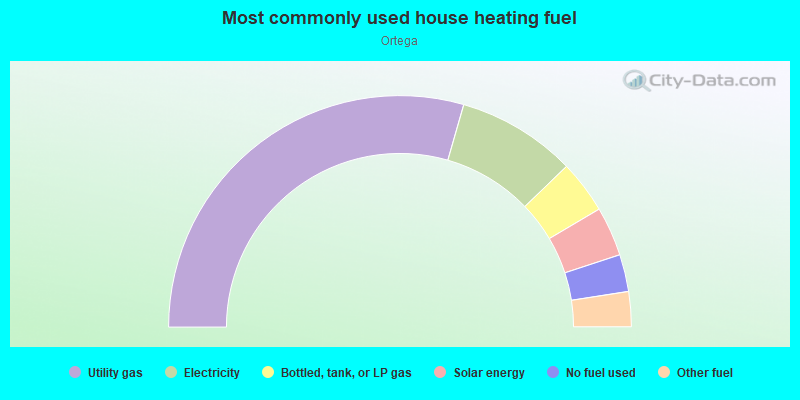
- 58.9%Utility gas
- 16.7%Electricity
- 7.4%Bottled, tank, or LP gas
- 6.9%Solar energy
- 5.2%No fuel used
- 4.9%Other fuel
Roads and streets:
Industrial Dr
Length: 1.14 miles
Directions: E-W, SW-NE
Address range: 1 to 1599
Directions: E-W, SW-NE
Address range: 1 to 1599
Sperry Rd
Length: 1.11 miles
Direction: E-W
Address range: 400 to 1499
Direction: E-W
Address range: 400 to 1499
S McKinley Ave (McKinley Ave)
Length: 0.99 miles
Directions: N-S, SE-NW
Address range: 3784 to 4898
Directions: N-S, SE-NW
Address range: 3784 to 4898
Airport Way
Length: 0.93 miles
Directions: N-S, SE-NW
Address range: 3786 to 4599
Directions: N-S, SE-NW
Address range: 3786 to 4599
Zephyr St
Length: 0.75 miles
Directions: E-W, SW-NE
Address range: 500 to 1099
Directions: E-W, SW-NE
Address range: 500 to 1099
Clayton Ave
Length: 0.47 miles
Direction: E-W
Address range: 1 to 299
Direction: E-W
Address range: 1 to 299
el Dorado St
Length: 0.36 miles
Direction: N-S
Address range: 3800 to 4385
Direction: N-S
Address range: 3800 to 4385
Odell Ave
Length: 0.27 miles
Directions: N-S, SE-NW
Address range: 3715 to 3906
Directions: N-S, SE-NW
Address range: 3715 to 3906
Mourfield Ave
Length: 0.26 miles
Direction: N-S
Address range: 3700 to 3999
Direction: N-S
Address range: 3700 to 3999
Producers Dr
Length: 0.23 miles
Directions: N-S, SE-NW, SW-NE
Address range: 3900 to 3999
Directions: N-S, SE-NW, SW-NE
Address range: 3900 to 3999
Gibralter Ct
Length: 0.21 miles
Directions: N-S, SE-NW
Address range: 4100 to 4299
Directions: N-S, SE-NW
Address range: 4100 to 4299
Zephyr Ct
Length: 0.18 miles
Direction: N-S
Direction: N-S
Perlman Dr
Length: 0.11 miles
Direction: N-S
Address range: 3648 to 3699
Direction: N-S
Address range: 3648 to 3699
Arch Airport Rd
Length: 0.07 miles
Direction: E-W
Address range: 1500 to 1549
Direction: E-W
Address range: 1500 to 1549
Boeing Way
Length: 0.06 miles
Direction: E-W
Direction: E-W
Railroad features:
Union Pacific RR
Length: 1.55 miles
Directions: N-S, SE-NW
Directions: N-S, SE-NW
Tsrr
Length: 0.28 miles
Directions: N-S, SE-NW
Directions: N-S, SE-NW
Sprr (Uprr (Sprr))
Length: 0.18 miles
Direction: N-S
Direction: N-S
Other features:
North Little Johns
Length: 1.21 miles
Directions: E-W, N-S, SW-NE
Directions: E-W, N-S, SW-NE