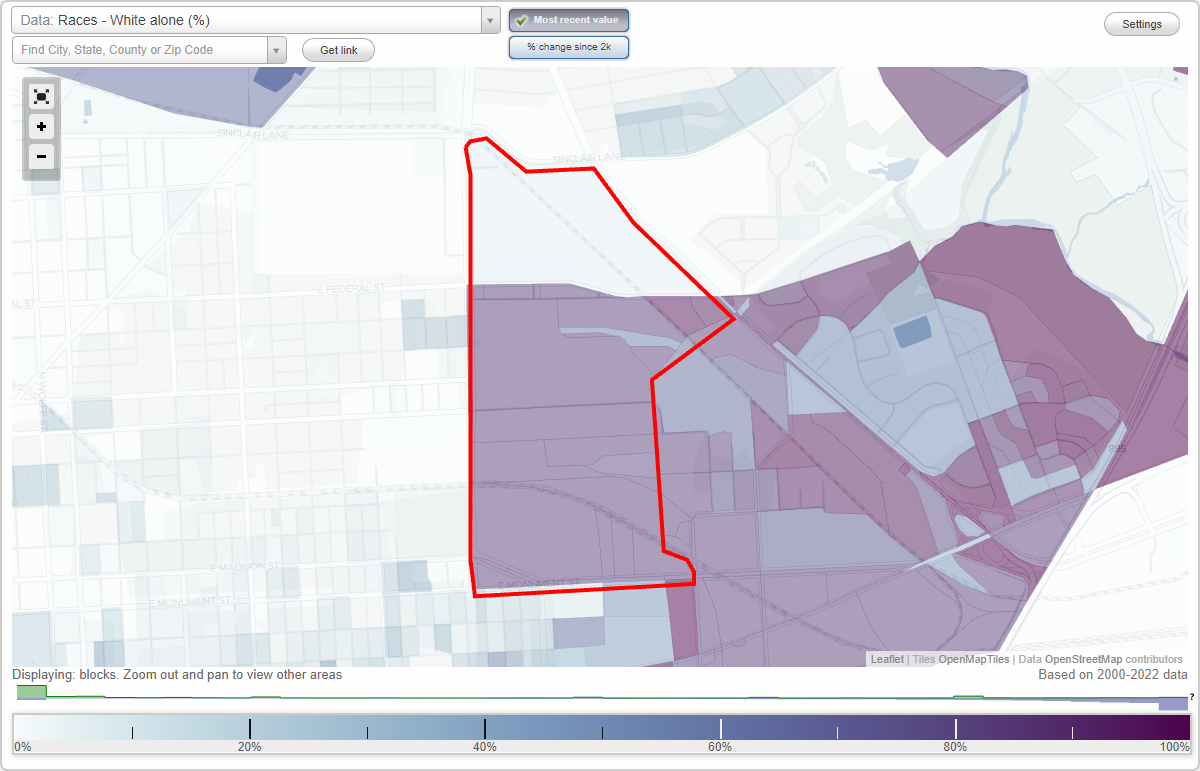
Orangeville Industrial Area neighborhood in Baltimore, Maryland (MD), 21205, 21213 detailed profile
Settings
X

Business Search - 14 Million verified businesses
Area: 0.439 square miles
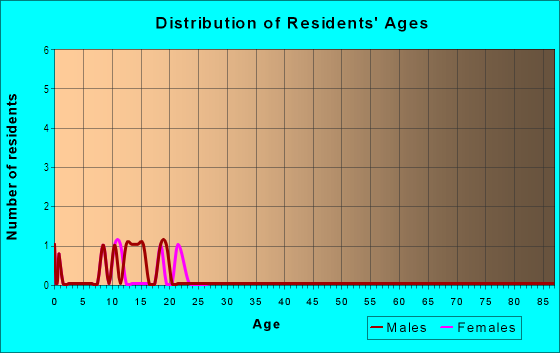
Population: 568
Population density:
| Orangeville Industrial Area: | 1,294 people per square mile |
| Baltimore: | 7,053 people per square mile |

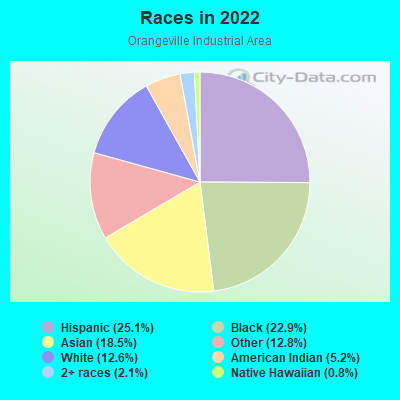
- 32625.1%Hispanic or Latino
- 29722.9%Black
- 24018.5%Asian
- 16612.8%Some other race
- 16312.6%White
- 685.2%American Indian
- 272.1%Two or more races
- 100.8%Native Hawaiian and Other
Pacific Islander
Distribution of median household income
![Distribution of median household income]()
- 42Less than $10,000
- 134$10,000 to $19,999
- 35$20,000 to $29,999
- 28$30,000 to $39,999
- 77$40,000 to $49,999
- 10$50,000 to $59,999
- 32$60,000 to $74,999
- 55$75,000 to $99,999
- 131$100,000 to $124,999
- 48$125,000 to $149,999
- 19$150,000 to $199,999
- 401$200,000 or more

Distribution of owner-occupied house/condo value
![Distribution of owner-occupied house/condo value]()
- 238Less than $50,000
- 113$50,000 to $99,999
- 83$100,000 to $149,999
- 37$150,000 to $199,999
- 128$200,000 to $249,999
- 60$250,000 to $299,999
- 47$300,000 to $399,999
- 279$400,000 to $499,999
- 36$500,000 to $749,999

Distribution of rent paid by renters
![Distribution of rent paid by renters]()
- 7Less than $100
- 524$100 to $199
- 34$200 to $299
- 23$300 to $399
- 46$400 to $499
- 100$500 to $599
- 6$600 to $699
- 230$700 to $799
- 580$800 to $899
- 124$900 to $999
- 55$1,000 to $1,249
- 25$1,250 to $1,499
- 9$1,500 to $1,999
- 140$2,000 or more

| Males: | 220 |
| Females: | 348 |
Males:
| This neighborhood: | 39.0 years |
| Whole city: | 35.0 years |
| This neighborhood: | 44.3 years |
| Whole city: | 38.2 years |
Average household size:
| Orangeville Industrial Area: | 4.7 people |
| Baltimore: | 2.2 people |
Percentage of family households:
| Orangeville Industrial Area: | 24.2% |
| Baltimore: | 34.2% |
| Here: | 15.6% |
| Baltimore: | 23.3% |
Percentage of married-couple families with children (among all households):
| Orangeville Industrial Area: | 25.8% |
| Baltimore: | 22.4% |
Percentage of single-mother households (among all households):
| Orangeville Industrial Area: | 21.9% |
| Baltimore: | 18.7% |
Percentage of never married males 15 years old and over:
Percentage of never married females 15 years old and over:
| Orangeville Industrial Area: | 18.2% |
| Baltimore: | 25.1% |
Percentage of never married females 15 years old and over:
| Orangeville Industrial Area: | 39.0% |
| city: | 27.5% |
Percentage of people that speak English not well or not at all:
| Orangeville Industrial Area: | 7.6% |
| Baltimore: | 2.3% |
Percentage of people born in this state:
Percentage of people born in another U.S. state:
Percentage of native residents but born outside the U.S.:
Percentage of foreign born residents:
| Here: | 56.7% |
| Baltimore: | 64.4% |
Percentage of people born in another U.S. state:
| Orangeville Industrial Area: | 17.2% |
| Baltimore: | 25.0% |
Percentage of native residents but born outside the U.S.:
| Here: | 2.4% |
| city: | 0.9% |
Percentage of foreign born residents:
| Here: | 25.4% |
| Baltimore: | 9.7% |
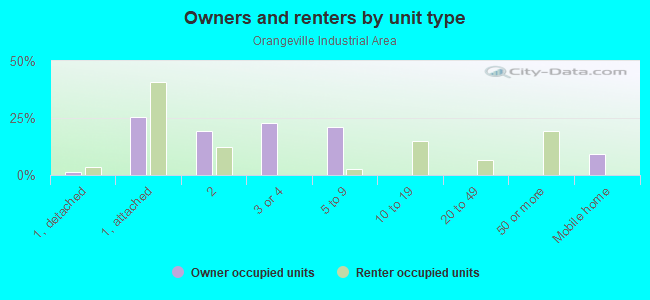
Owner-occupied
Renter-occupied

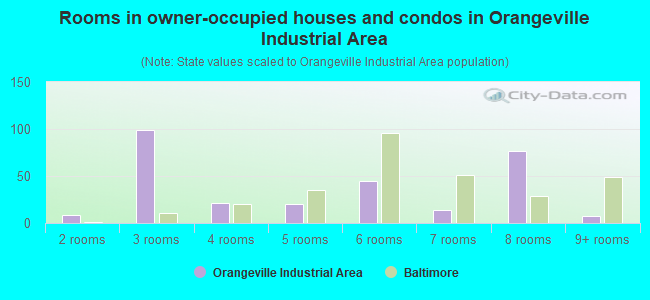
- Rooms in owner-occupied houses and condos in Orangeville Industrial Area
- 01 room
- 82 rooms
- 993 rooms
- 214 rooms
- 205 rooms
- 456 rooms
- 147 rooms
- 778 rooms
- 79+ rooms
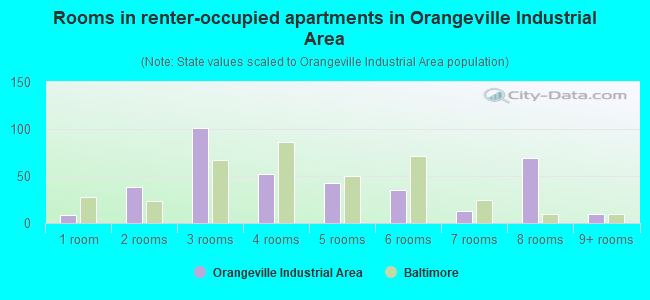
- Rooms in renter-occupied apartments in Orangeville Industrial Area
- 81 room
- 382 rooms
- 1013 rooms
- 524 rooms
- 435 rooms
- 356 rooms
- 137 rooms
- 698 rooms
- 109+ rooms
Owner-occupied
Renter-occupied
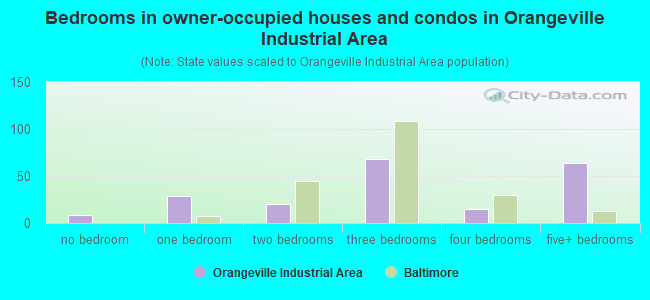
- Bedrooms in owner-occupied houses and condos in Orangeville Industrial Area
- 8no bedroom
- 291 bedroom
- 202 bedrooms
- 683 bedrooms
- 154 bedrooms
- 645+ bedrooms
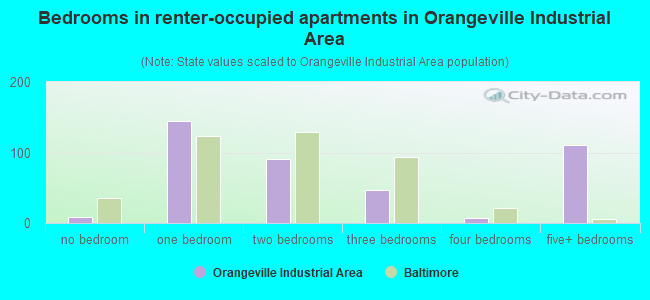
- Bedrooms in renter-occupied apartments in Orangeville Industrial Area
- 8no bedroom
- 1441 bedroom
- 912 bedrooms
- 473 bedrooms
- 74 bedrooms
- 1105+ bedrooms
Average number of cars or other vehicles available in houses/condos:
Average number of cars or other vehicles available in apartments:
| This neighborhood: | 2.3 |
| Baltimore: | 1.5 |
Average number of cars or other vehicles available in apartments:
| Here: | 2.1 |
| city: | 0.8 |
Percentage of units with a mortgage:
| Orangeville Industrial Area: | 75.8% |
| Baltimore: | 64.3% |
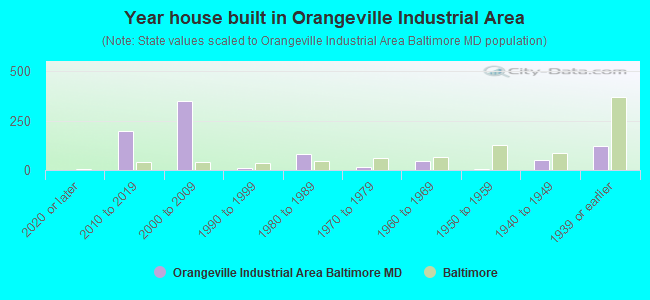
- Year house built in Orangeville Industrial Area
- 02020 or later
- 1982010 to 2019
- 3492000 to 2009
- 111990 to 1999
- 811980 to 1989
- 131970 to 1979
- 441960 to 1969
- 71950 to 1959
- 531940 to 1949
- 1201939 or earlier
Travel time to work (commute)
![Travel time to work (commute)]()
- 2Less than 5 minutes
- 85 to 9 minutes
- 5910 to 14 minutes
- 21715 to 19 minutes
- 2720 to 24 minutes
- 4925 to 29 minutes
- 2030 to 34 minutes
- 2135 to 39 minutes
- 540 to 44 minutes
- 1645 to 59 minutes
- 1860 to 89 minutes
- 1690 or more minutes

Means of transportation to work
![Means of transportation to work]()
- 60.2%149Drove a car alone
- 24.6%61Carpooled
- 32.7%81Bus
- 38.8%96Subway or elevated rail
- 120.8%299Long-distance train or commuter rail
- 30.3%75Light rail, streetcar or trolley
- 4.8%12Taxi
- 19.0%47Bicycle
- 122.8%304Walked
- 9.3%23Other means
- 83.2%206Worked at home

Time leaving home to go to work
![Time leaving home to go to work]()
- 12412:00 a.m. to 4:59 a.m.
- 125:00 a.m. to 5:29 a.m.
- 145:30 a.m. to 5:59 a.m.
- 336:00 a.m. to 6:29 a.m.
- 606:30 a.m. to 6:59 a.m.
- 2837:00 a.m. to 7:29 a.m.
- 217:30 a.m. to 7:59 a.m.
- 88:00 a.m. to 8:29 a.m.
- 858:30 a.m. to 8:59 a.m.
- 179:00 a.m. to 9:59 a.m.
- 5810:00 a.m. to 10:59 a.m.
- 411:00 a.m. to 11:59 a.m.
- 1412:00 p.m. to 3:59 p.m.
- 34:00 p.m. to 11:59 p.m.

Occupations of males:
- Percentage of males in management occupations (except farmers):
Here: 2.0% city: 10.7%
- Percentage of males in business and financial operations occupations:
Here: 4.4% city: 5.9%
- Percentage of males in computer and mathematical occupations:
Here: 3.6% city: 6.1%
- Percentage of males in architecture and engineering occupations:
Here: 4.6% city: 2.9%
- Percentage of males in arts, design, entertainment, sports, and media occupations:
Here: 5.0% city: 2.8%
- Percentage of males in service occupations:
Here: 6.7% city: 14.7%
- Percentage of males in sales and office occupations:
Here: 4.3% city: 14.2%
- Percentage of males in construction, extraction, and maintenance occupations:
Here: 20.6% city: 5.6%
- Percentage of males in production occupations:
Here: 25.9% city: 4.2%
- Percentage of males in transportation occupations:
Here: 7.2% city: 6.8%
- Percentage of males in material moving occupations:
Here: 2.6% city: 7.0%
Occupations of females:
- Percentage of females in management occupations (except farmers):
Here: 20.9% city: 10.1%
- Percentage of females in business and financial operations occupations:
Here: 5.1% city: 6.6%
- Percentage of females in service occupations:
Here: 20.6% city: 20.4%
- Percentage of females in sales and office occupations:
Here: 30.1% city: 22.3%
- Percentage of females in production occupations:
Here: 9.4% city: 2.3%
- Percentage of females in material moving occupations:
Here: 12.7% city: 1.9%
Percentage of people 16-64 in Armed Forces:
| Orangeville Industrial Area: | 0.0% |
| Baltimore: | 0.4% |
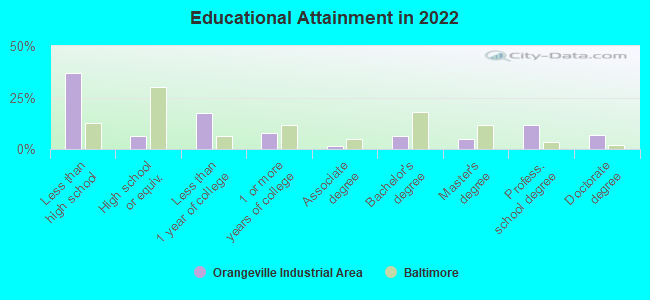
Education in this neighborhood (subdivision or community):
- Percentage of people 3 years and older in K-12 schools:
Orangeville Industrial Area: 179.3% Baltimore: 14.7%
- Percentage of people 3 years and older in undergraduate colleges:
Orangeville Industrial Area: 13.5% Baltimore: 6.0%
- Percentage of people 3 years and older in grad. or professional schools:
Orangeville Industrial Area: 23.3% Baltimore: 2.8%
- Percentage of students K-12 enrolled in private schools:
Orangeville Industrial Area: 73.3% Baltimore: 12.7%
Percentage of population below poverty level:
| Orangeville Industrial Area: | 28.9% |
| Baltimore: | 18.5% |
Median year renter moved in (as recorded in 2022):
| Orangeville Industrial Area: | 2015 |
| Baltimore: | 2019 |
Percentage of married-couple families with both working:
| Orangeville Industrial Area: | 590.7% |
| Baltimore: | 79.2% |
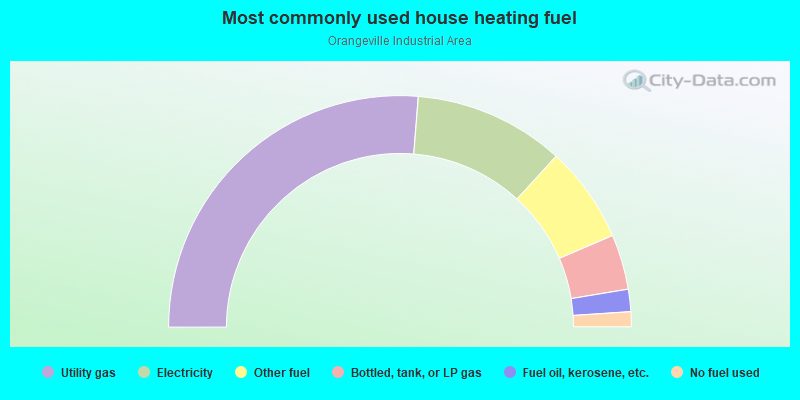
- 52.5%Utility gas
- 21.0%Electricity
- 13.5%Other fuel
- 7.7%Bottled, tank, or LP gas
- 3.1%Fuel oil, kerosene, etc.
- 2.1%No fuel used
Roads and streets:
E Monument St
Length: 1.08 miles
Direction: E-W
Address range: 3200 to 4099
Direction: E-W
Address range: 3200 to 4099
E Federal St
Length: 0.62 miles
Direction: E-W
Direction: E-W
E Biddle St
Length: 0.53 miles
Direction: E-W
Address range: 3206 to 3499
Direction: E-W
Address range: 3206 to 3499
Duncanwood Ln
Length: 0.42 miles
Direction: E-W
Address range: 3342 to 3799
Direction: E-W
Address range: 3342 to 3799
E Madison St
Length: 0.42 miles
Directions: E-W, N-S, SE-NW
Address range: 3200 to 3399
Directions: E-W, N-S, SE-NW
Address range: 3200 to 3399
Edison Hwy
Length: 0.17 miles
Direction: N-S
Address range: 800 to 999
Direction: N-S
Address range: 800 to 999
N Highland Ave
Length: 0.03 miles
Direction: N-S
Address range: 1600 to 1799
Direction: N-S
Address range: 1600 to 1799
E North Ave
Length: 0.03 miles
Directions: E-W, N-S, SW-NE
Address range: 3572 to 3599
Directions: E-W, N-S, SW-NE
Address range: 3572 to 3599
Railroad features:
Penn Central RR
Length: 1.62 miles
Directions: E-W, SE-NW
Directions: E-W, SE-NW
Baltimore and Ohio RR
Length: 0.16 miles
Direction: SE-NW
Direction: SE-NW