Old Vegas neighborhood in Henderson, Nevada (NV), 89015 detailed profile
Settings
X


Business Search - 14 Million verified businesses
Area: 0.212 square miles
Population: 888
Population density:
| Old Vegas: | 4,181 people per square mile |
| Henderson: | 4,159 people per square mile |

- 46850.4%White
- 37940.8%Hispanic or Latino
- 353.8%Two or more races
- 242.6%Black
- 181.9%Native Hawaiian and Other
Pacific Islander - 50.5%Asian

Median household income in 2022:
| Old Vegas: | $52,260 |
| Henderson: | $81,695 |
Distribution of median household income
![Distribution of median household income]()
- 14Less than $10,000
- 13$10,000 to $19,999
- 83$20,000 to $29,999
- 19$30,000 to $39,999
- 37$40,000 to $49,999
- 18$50,000 to $59,999
- 34$60,000 to $74,999
- 52$75,000 to $99,999
- 47$100,000 to $124,999
- 9$125,000 to $149,999
- 37$150,000 to $199,999
- 36$200,000 or more

Distribution of owner-occupied house/condo value
![Distribution of owner-occupied house/condo value]()
- 187Less than $50,000
- 29$50,000 to $99,999
- 1$150,000 to $199,999
- 2$200,000 to $249,999
- 7$250,000 to $299,999
- 44$300,000 to $399,999
- 84$400,000 to $499,999
- 6$500,000 to $749,999
- 3$750,000 to $999,999
- 2$1,000,000 or more

Distribution of rent paid by renters
![Distribution of rent paid by renters]()
- 24$500 to $599
- 7$600 to $699
- 1$900 to $999
- 3$1,250 to $1,499
- 11$1,500 to $1,999

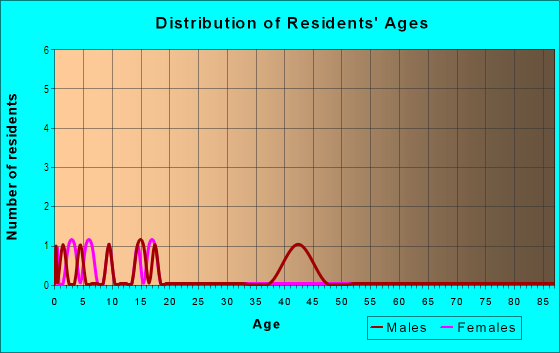
| Males: | 409 |
| Females: | 478 |
Males:
| This neighborhood: | 45.1 years |
| Whole city: | 42.4 years |
| This neighborhood: | 37.2 years |
| Whole city: | 43.2 years |
Average household size:
| Old Vegas: | 2.5 people |
| Henderson: | 2.5 people |
Percentage of family households:
| Old Vegas: | 58.6% |
| Henderson: | 42.0% |
| Here: | 34.4% |
| Henderson: | 48.5% |
Percentage of married-couple families with children (among all households):
| Old Vegas: | 31.5% |
| Henderson: | 28.8% |
Percentage of single-mother households (among all households):
| Old Vegas: | 1.5% |
| Henderson: | 8.6% |
Percentage of never married males 15 years old and over:
Percentage of never married females 15 years old and over:
| Old Vegas: | 16.9% |
| Henderson: | 14.8% |
Percentage of never married females 15 years old and over:
| Old Vegas: | 12.8% |
| city: | 13.2% |
Percentage of people that speak English not well or not at all:
| Old Vegas: | 4.7% |
| Henderson: | 1.6% |
Percentage of people born in this state:
Percentage of people born in another U.S. state:
Percentage of native residents but born outside the U.S.:
Percentage of foreign born residents:
| Here: | 28.3% |
| Henderson: | 22.2% |
Percentage of people born in another U.S. state:
| Old Vegas: | 60.1% |
| Henderson: | 61.4% |
Percentage of native residents but born outside the U.S.:
| Here: | 1.8% |
| city: | 2.0% |
Percentage of foreign born residents:
| Here: | 9.8% |
| Henderson: | 14.4% |

Owner-occupied
Renter-occupied


- Rooms in owner-occupied houses and condos in Old Vegas
- 01 room
- 02 rooms
- 663 rooms
- 274 rooms
- 485 rooms
- 846 rooms
- 637 rooms
- 128 rooms
- 229+ rooms

- Rooms in renter-occupied apartments in Old Vegas
- 01 room
- 02 rooms
- 03 rooms
- 64 rooms
- 235 rooms
- 26 rooms
- 77 rooms
- 08 rooms
- 09+ rooms
Owner-occupied
Renter-occupied

- Bedrooms in owner-occupied houses and condos in Old Vegas
- 0no bedroom
- 01 bedroom
- 1262 bedrooms
- 1193 bedrooms
- 784 bedrooms
- 95+ bedrooms

- Bedrooms in renter-occupied apartments in Old Vegas
- 0no bedroom
- 01 bedroom
- 62 bedrooms
- 233 bedrooms
- 64 bedrooms
- 05+ bedrooms
Average number of cars or other vehicles available in houses/condos:
Average number of cars or other vehicles available in apartments:
| This neighborhood: | 1.5 |
| Henderson: | 1.9 |
Average number of cars or other vehicles available in apartments:
| Here: | 2.2 |
| city: | 1.5 |
Percentage of units with a mortgage:
| Old Vegas: | 35.2% |
| Henderson: | 69.1% |
Housing prices:
- Average estimated value of detached houses in 2022 (34.8% of all units):
Old Vegas: $410,461 Henderson: $492,873
- Average estimated value of mobile home in 2022 (64.9% of all units):
Old Vegas: $45,919 Henderson: $68,995

- Year house built in Old Vegas
- 02020 or later
- 62010 to 2019
- 462000 to 2009
- 1541990 to 1999
- 1231980 to 1989
- 521970 to 1979
- 01960 to 1969
- 01950 to 1959
- 31940 to 1949
- 01939 or earlier

City-data.com crime index for city in 2020 (higher means more crime):
| City: | 142.5 |
| U.S. average: | 219.5 |
Travel time to work (commute)
![Travel time to work (commute)]()
- 4Less than 5 minutes
- 225 to 9 minutes
- 2310 to 14 minutes
- 4815 to 19 minutes
- 5720 to 24 minutes
- 3425 to 29 minutes
- 4430 to 34 minutes
- 935 to 39 minutes
- 340 to 44 minutes
- 1045 to 59 minutes
- 360 to 89 minutes

Means of transportation to work
![Means of transportation to work]()
- 83.5%329Drove a car alone
- 12.2%48Carpooled
- 0.3%1Motorcycle
- 1.3%5Walked
- 2.8%11Worked at home

Time leaving home to go to work
![Time leaving home to go to work]()
- 1412:00 a.m. to 4:59 a.m.
- 305:00 a.m. to 5:29 a.m.
- 375:30 a.m. to 5:59 a.m.
- 126:00 a.m. to 6:29 a.m.
- 326:30 a.m. to 6:59 a.m.
- 417:00 a.m. to 7:29 a.m.
- 247:30 a.m. to 7:59 a.m.
- 128:00 a.m. to 8:29 a.m.
- 138:30 a.m. to 8:59 a.m.
- 39:00 a.m. to 9:59 a.m.
- 810:00 a.m. to 10:59 a.m.
- 1712:00 p.m. to 3:59 p.m.
- 154:00 p.m. to 11:59 p.m.

Occupations of males:
- Percentage of males in management occupations (except farmers):
Here: 12.7% city: 13.5%
- Percentage of males in business and financial operations occupations:
Here: 1.7% city: 5.3%
- Percentage of males in computer and mathematical occupations:
Here: 5.6% city: 3.8%
- Percentage of males in architecture and engineering occupations:
Here: 2.2% city: 2.6%
- Percentage of males in education, training, and library occupations:
Here: 4.2% city: 3.7%
- Percentage of males in healthcare practitioners and technical occupations:
Here: 1.1% city: 3.5%
- Percentage of males in service occupations:
Here: 7.7% city: 18.1%
- Percentage of males in sales and office occupations:
Here: 20.8% city: 17.8%
- Percentage of males in construction, extraction, and maintenance occupations:
Here: 32.7% city: 6.2%
- Percentage of males in production occupations:
Here: 2.1% city: 4.0%
- Percentage of males in transportation occupations:
Here: 8.8% city: 6.0%
- Percentage of males in material moving occupations:
Here: 5.4% city: 3.4%
Occupations of females:
- Percentage of females in management occupations (except farmers):
Here: 31.0% city: 10.3%
- Percentage of females in community and social services occupations:
Here: 2.9% city: 2.1%
- Percentage of females in education, training, and library occupations:
Here: 4.2% city: 8.5%
- Percentage of females in healthcare practitioners and technical occupations:
Here: 6.7% city: 8.6%
- Percentage of females in service occupations:
Here: 28.8% city: 19.2%
- Percentage of females in sales and office occupations:
Here: 16.6% city: 32.5%
- Percentage of females in construction, extraction, and maintenance occupations:
Here: 2.0% city: 0.3%
- Percentage of females in production occupations:
Here: 9.9% city: 1.6%
- Percentage of females in material moving occupations:
Here: 5.1% city: 1.6%
Percentage of people 16-64 in Armed Forces:
| Old Vegas: | 1.7% |
| Henderson: | 0.5% |
Education in this neighborhood (subdivision or community):
- Percentage of people 3 years and older in K-12 schools:
Old Vegas: 16.5% Henderson: 15.9%
- Percentage of people 3 years and older in undergraduate colleges:
Old Vegas: 4.2% Henderson: 3.2%
- Percentage of people 3 years and older in grad. or professional schools:
Old Vegas: 0.7% Henderson: 1.4%
- Percentage of students K-12 enrolled in private schools:
Old Vegas: 9.5% Henderson: 13.1%
Percentage of population below poverty level:
| Old Vegas: | 9.0% |
| Henderson: | 10.1% |
Median year owner moved in (as recorded in 2022):
| Old Vegas: | 2012 |
| Henderson: | 2015 |
Percentage of married-couple families with both working:
| Old Vegas: | 63.1% |
| Henderson: | 61.8% |

- 71.5%Utility gas
- 25.1%Electricity
- 1.9%Solar energy
- 1.5%Wood
Highways in this neighborhood:
S Boulder
Length: 0.62 miles
Directions: E-W, SE-NW
Directions: E-W, SE-NW
Roads and streets:
Pistol Perry Pkwy
Length: 0.39 miles
Directions: E-W, N-S, SE-NW, SW-NE
Directions: E-W, N-S, SE-NW, SW-NE
Belt Buckley Dr
Length: 0.33 miles
Directions: E-W, N-S, SE-NW, SW-NE
Directions: E-W, N-S, SE-NW, SW-NE
Vegas Vic St
Length: 0.32 miles
Directions: N-S, SE-NW
Address range: 2400 to 2599
Directions: N-S, SE-NW
Address range: 2400 to 2599
Shootout Pl
Length: 0.29 miles
Directions: E-W, SW-NE
Directions: E-W, SW-NE
Cowboy Chaps Pl
Length: 0.26 miles
Directions: E-W, SW-NE
Address range: 1500 to 1699
Directions: E-W, SW-NE
Address range: 1500 to 1699
Cattle Ranch Pl
Length: 0.24 miles
Directions: E-W, SE-NW
Directions: E-W, SE-NW
Buckaroo Brandon Dr
Length: 0.22 miles
Direction: SE-NW
Direction: SE-NW
Wrangler Walsh la
Length: 0.20 miles
Directions: E-W, SE-NW, SW-NE
Directions: E-W, SE-NW, SW-NE
Silver Slipper Ave
Length: 0.20 miles
Directions: E-W, N-S, SE-NW, SW-NE
Address range: 1500 to 1699
Directions: E-W, N-S, SE-NW, SW-NE
Address range: 1500 to 1699
Broken Bell la
Length: 0.18 miles
Direction: SW-NE
Direction: SW-NE
Clint Canyon Dr
Length: 0.16 miles
Directions: E-W, SW-NE
Directions: E-W, SW-NE
Lefty Garcia Way
Length: 0.15 miles
Directions: N-S, SW-NE
Directions: N-S, SW-NE
Rusty Ridge la
Length: 0.15 miles
Directions: N-S, SW-NE
Directions: N-S, SW-NE
Lazy Saddle Dr
Length: 0.14 miles
Direction: SE-NW
Direction: SE-NW
Ward Frontier la
Length: 0.14 miles
Direction: SW-NE
Direction: SW-NE
Buffalo Brubaker la
Length: 0.13 miles
Direction: SW-NE
Direction: SW-NE
Crafty Clint la
Length: 0.13 miles
Direction: SE-NW
Direction: SE-NW
Wild Alice Way
Length: 0.13 miles
Direction: SW-NE
Direction: SW-NE
April Breeze la
Length: 0.13 miles
Directions: E-W, N-S, SE-NW
Directions: E-W, N-S, SE-NW
Hacienda Horse Ct
Length: 0.12 miles
Directions: E-W, SW-NE
Directions: E-W, SW-NE
Alias Smith Dr
Length: 0.12 miles
Directions: E-W, SE-NW
Directions: E-W, SE-NW
Land Rush Dr
Length: 0.11 miles
Direction: SE-NW
Direction: SE-NW
Sharp Spur Dr
Length: 0.10 miles
Directions: N-S, SE-NW, SW-NE
Directions: N-S, SE-NW, SW-NE
Velez Valley Way
Length: 0.10 miles
Direction: SE-NW
Direction: SE-NW
Glass Pool Ave
Length: 0.10 miles
Directions: E-W, SW-NE
Directions: E-W, SW-NE
Aladdin Lamp St
Length: 0.10 miles
Directions: N-S, SE-NW, SW-NE
Directions: N-S, SE-NW, SW-NE
Lone Palm Ct
Length: 0.08 miles
Directions: E-W, SW-NE
Directions: E-W, SW-NE
Roping Reed Ct
Length: 0.07 miles
Direction: SW-NE
Direction: SW-NE
Rat Pack Ave
Length: 0.07 miles
Direction: E-W
Direction: E-W
Cook Out Ct
Length: 0.05 miles
Direction: N-S
Direction: N-S
Bounty Hunter Ct
Length: 0.05 miles
Directions: N-S, SE-NW
Directions: N-S, SE-NW
Miss Kitty St
Length: 0.05 miles
Direction: N-S
Direction: N-S
Gold Camp St
Length: 0.05 miles
Directions: N-S, SW-NE
Directions: N-S, SW-NE
Hiding Fort St
Length: 0.04 miles
Direction: SW-NE
Direction: SW-NE
Bell Boys Pl
Length: 0.04 miles
Direction: SE-NW
Direction: SE-NW
Rustler Ronnie Dr
Length: 0.03 miles
Direction: SW-NE
Direction: SW-NE
Gruff Huff la
Length: 0.03 miles
Direction: SE-NW
Direction: SE-NW
Knudson Ct
Length: 0.03 miles
Direction: SW-NE
Direction: SW-NE
Boulder Strip
Length: 0.03 miles
Direction: N-S
Direction: N-S