Old Town neighborhood in Salinas, California (CA), 93901 detailed profile
Settings
X

Business Search - 14 Million verified businesses
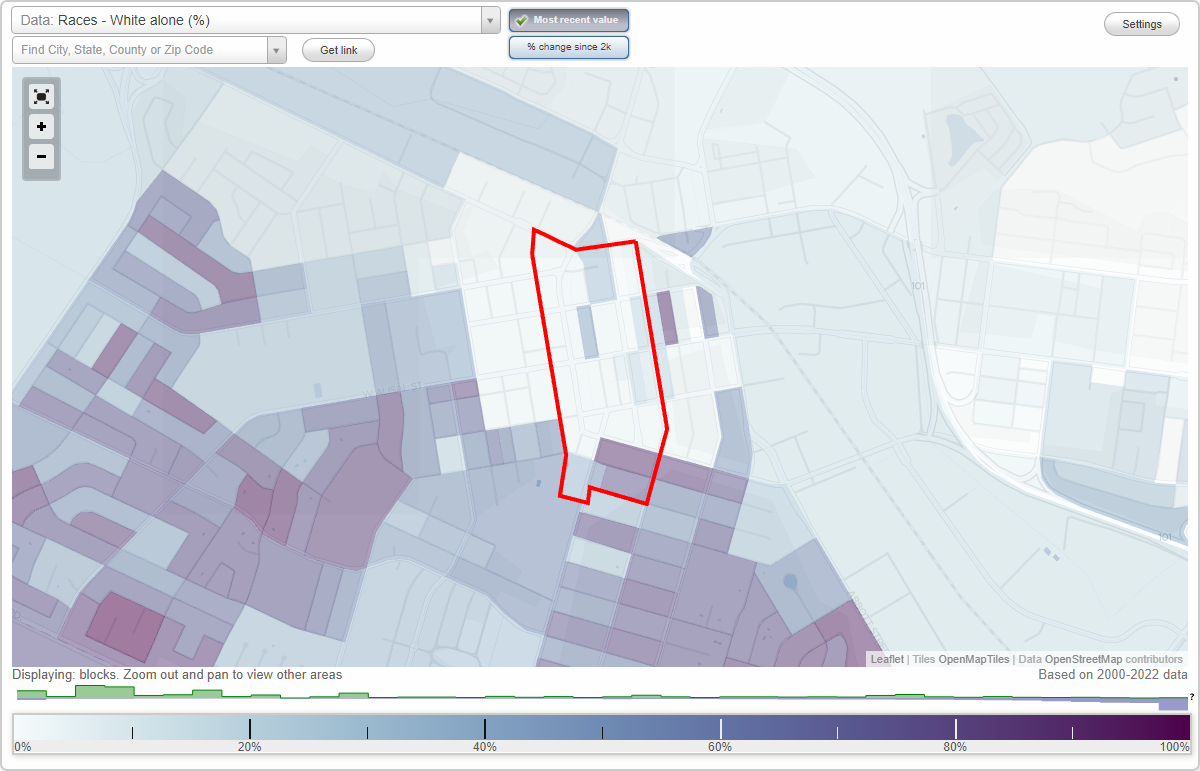
Area: 0.147 square miles
Population: 1,104
Population density:
| Old Town: | 7,502 people per square mile |
| Salinas: | 8,472 people per square mile |

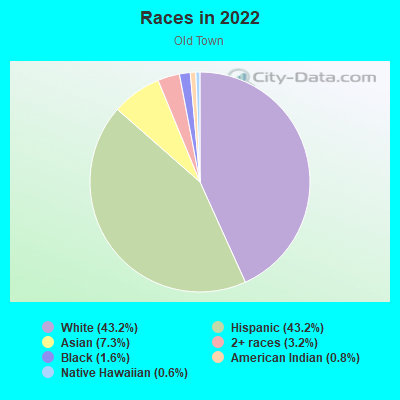
- 90279.0%Hispanic or Latino
- 14112.3%White
- 332.9%Asian
- 322.8%Some other race
- 221.9%Black
- 70.6%Two or more races
- 50.4%American Indian
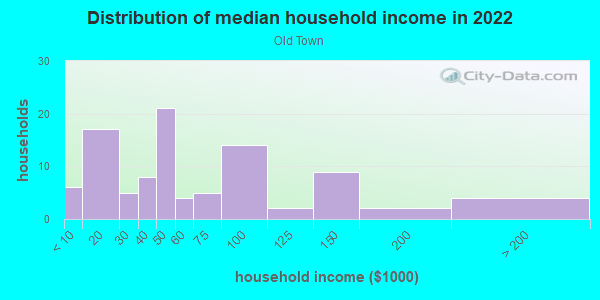
Distribution of median household income
![Distribution of median household income]()
- 29Less than $10,000
- 74$10,000 to $19,999
- 30$20,000 to $29,999
- 21$30,000 to $39,999
- 34$40,000 to $49,999
- 34$50,000 to $59,999
- 63$60,000 to $74,999
- 27$75,000 to $99,999
- 35$100,000 to $124,999
- 48$125,000 to $149,999
- 18$150,000 to $199,999
- 21$200,000 or more
Distribution of owner-occupied house/condo value
![Distribution of owner-occupied house/condo value]()
- 9Less than $50,000
- 17$150,000 to $199,999
- 22$250,000 to $299,999
- 17$300,000 to $399,999
- 14$400,000 to $499,999
- 42$500,000 to $749,999
- 155$750,000 to $999,999
- 14$1,000,000 or more

Distribution of rent paid by renters
![Distribution of rent paid by renters]()
- 30$200 to $299
- 35$300 to $399
- 34$400 to $499
- 33$500 to $599
- 14$600 to $699
- 16$700 to $799
- 36$800 to $899
- 5$900 to $999
- 22$1,000 to $1,249
- 51$1,250 to $1,499
- 64$1,500 to $1,999
- 131$2,000 or more

Median rent in 2022:
| Old Town: | $1,573 |
| Salinas: | $1,713 |
| Males: | 497 |
| Females: | 606 |
Males:
| This neighborhood: | 37.6 years |
| Whole city: | 33.7 years |
| This neighborhood: | 41.5 years |
| Whole city: | 33.8 years |
Average household size:
| Old Town: | 2.7 people |
| Salinas: | 3.5 people |
Percentage of family households:
| Old Town: | 48.8% |
| Salinas: | 58.3% |
| Here: | 29.3% |
| Salinas: | 48.7% |
Percentage of married-couple families with children (among all households):
| Old Town: | 13.8% |
| Salinas: | 16.8% |
Percentage of single-mother households (among all households):
| Old Town: | 18.0% |
| Salinas: | 8.2% |
Percentage of never married males 15 years old and over:
Percentage of never married females 15 years old and over:
| Old Town: | 28.2% |
| Salinas: | 23.7% |
Percentage of never married females 15 years old and over:
| Old Town: | 25.0% |
| city: | 20.8% |
Percentage of people that speak English not well or not at all:
| Old Town: | 28.2% |
| Salinas: | 24.2% |
Percentage of people born in this state:
Percentage of people born in another U.S. state:
Percentage of native residents but born outside the U.S.:
Percentage of foreign born residents:
| Here: | 57.5% |
| Salinas: | 55.1% |
Percentage of people born in another U.S. state:
| Old Town: | 5.7% |
| Salinas: | 5.9% |
Percentage of native residents but born outside the U.S.:
| Here: | 0.4% |
| city: | 1.3% |
Percentage of foreign born residents:
| Here: | 36.5% |
| Salinas: | 37.7% |
Owner-occupied
Renter-occupied

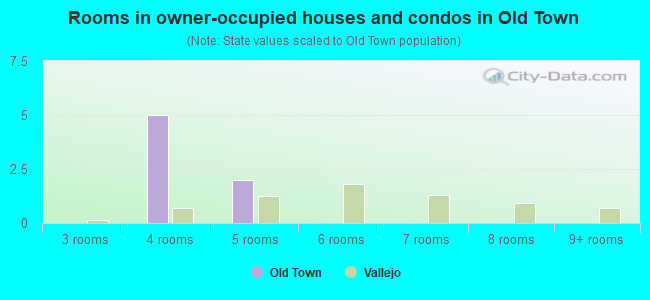
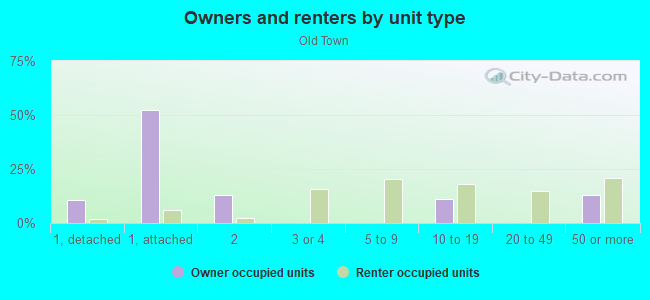
- Rooms in owner-occupied houses and condos in Old Town
- 01 room
- 62 rooms
- 273 rooms
- 154 rooms
- 175 rooms
- 376 rooms
- 107 rooms
- 98 rooms
- 1459+ rooms
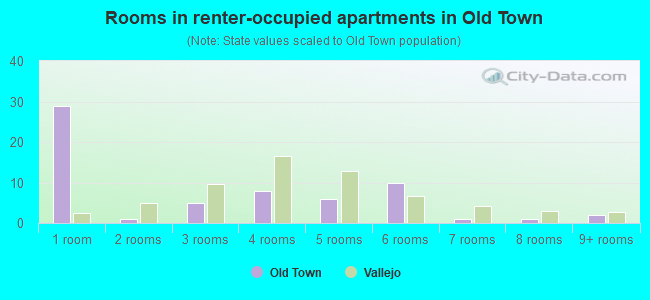
- Rooms in renter-occupied apartments in Old Town
- 461 room
- 492 rooms
- 563 rooms
- 1114 rooms
- 495 rooms
- 336 rooms
- 57 rooms
- 58 rooms
- 59+ rooms
Owner-occupied
Renter-occupied
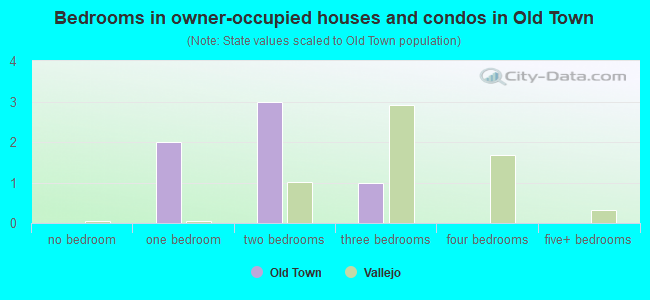
- Bedrooms in owner-occupied houses and condos in Old Town
- 0no bedroom
- 271 bedroom
- 382 bedrooms
- 313 bedrooms
- 274 bedrooms
- 945+ bedrooms
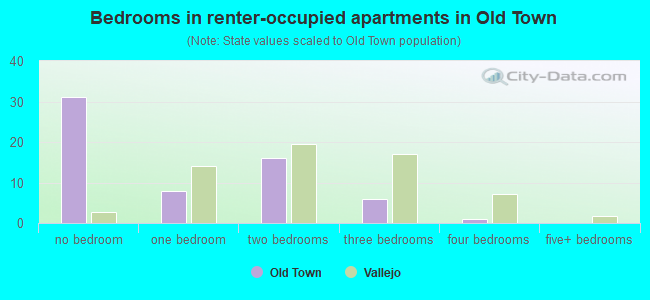
- Bedrooms in renter-occupied apartments in Old Town
- 48no bedroom
- 811 bedroom
- 942 bedrooms
- 953 bedrooms
- 224 bedrooms
- 45+ bedrooms
Average number of cars or other vehicles available in houses/condos:
Average number of cars or other vehicles available in apartments:
| This neighborhood: | 2.7 |
| Salinas: | 2.5 |
Average number of cars or other vehicles available in apartments:
| Here: | 1.7 |
| city: | 1.9 |
Percentage of units with a mortgage:
| Old Town: | 74.6% |
| Salinas: | 61.3% |
Average estimated value of detached houses in 2022 (51.8% of all units):
| Old Town: | $528,695 |
| California: | $988,808 |
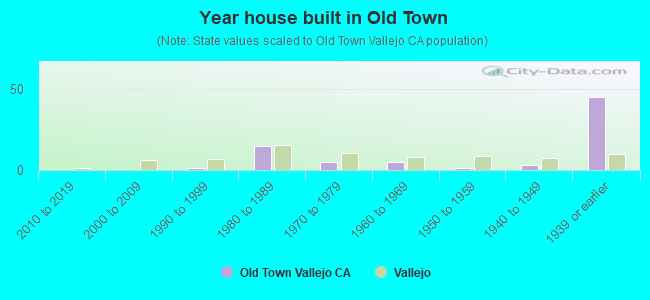
- Year house built in Old Town
- 02020 or later
- 482010 to 2019
- 672000 to 2009
- 121990 to 1999
- 531980 to 1989
- 291970 to 1979
- 501960 to 1969
- 341950 to 1959
- 211940 to 1949
- 1441939 or earlier
City-data.com crime index for city in 2020 (higher means more crime):
| City: | 289.6 |
| U.S. average: | 219.5 |
Travel time to work (commute)
![Travel time to work (commute)]()
- 10Less than 5 minutes
- 435 to 9 minutes
- 7410 to 14 minutes
- 7315 to 19 minutes
- 15520 to 24 minutes
- 725 to 29 minutes
- 8730 to 34 minutes
- 1135 to 39 minutes
- 1640 to 44 minutes
- 1445 to 59 minutes
- 1060 to 89 minutes
- 6490 or more minutes

Means of transportation to work
![Means of transportation to work]()
- 45.8%194Drove a car alone
- 30.2%128Carpooled
- 10.6%45Bus
- 1.4%6Bicycle
- 1.2%5Walked
- 29.8%126Other means
- 5.2%22Worked at home

Time leaving home to go to work
![Time leaving home to go to work]()
- 4112:00 a.m. to 4:59 a.m.
- 355:00 a.m. to 5:29 a.m.
- 1265:30 a.m. to 5:59 a.m.
- 756:00 a.m. to 6:29 a.m.
- 516:30 a.m. to 6:59 a.m.
- 957:00 a.m. to 7:29 a.m.
- 457:30 a.m. to 7:59 a.m.
- 238:00 a.m. to 8:29 a.m.
- 238:30 a.m. to 8:59 a.m.
- 249:00 a.m. to 9:59 a.m.
- 2310:00 a.m. to 10:59 a.m.
- 611:00 a.m. to 11:59 a.m.
- 1512:00 p.m. to 3:59 p.m.
- 54:00 p.m. to 11:59 p.m.

Occupations of males:
- Percentage of males in management occupations (except farmers):
Here: 17.7% city: 5.9%
- Percentage of males in arts, design, entertainment, sports, and media occupations:
Here: 2.9% city: 1.0%
- Percentage of males in service occupations:
Here: 4.6% city: 16.5%
- Percentage of males in sales and office occupations:
Here: 13.8% city: 12.2%
- Percentage of males in farming, fishing, and forestry occupations:
Here: 30.0% city: 15.3%
- Percentage of males in construction, extraction, and maintenance occupations:
Here: 4.8% city: 11.6%
- Percentage of males in production occupations:
Here: 2.7% city: 6.1%
- Percentage of males in transportation occupations:
Here: 5.8% city: 6.6%
- Percentage of males in material moving occupations:
Here: 15.9% city: 9.3%
Occupations of females:
- Percentage of females in management occupations (except farmers):
Here: 3.2% city: 7.5%
- Percentage of females in computer and mathematical occupations:
Here: 6.9% city: 0.8%
- Percentage of females in architecture and engineering occupations:
Here: 2.5% city: 0.6%
- Percentage of females in community and social services occupations:
Here: 2.8% city: 1.9%
- Percentage of females in healthcare practitioners and technical occupations:
Here: 5.4% city: 6.2%
- Percentage of females in service occupations:
Here: 23.9% city: 23.3%
- Percentage of females in sales and office occupations:
Here: 27.1% city: 28.4%
- Percentage of females in farming, fishing, and forestry occupations:
Here: 3.1% city: 11.0%
- Percentage of females in production occupations:
Here: 6.2% city: 2.5%
- Percentage of females in material moving occupations:
Here: 17.2% city: 5.0%
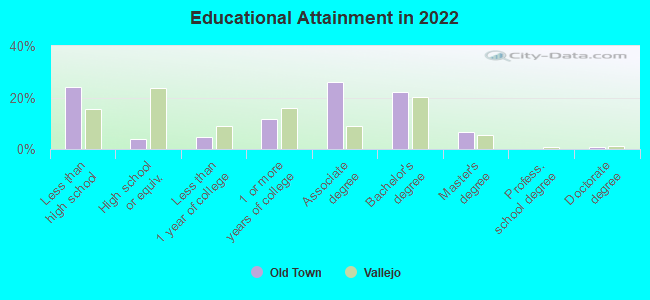
Education in this neighborhood (subdivision or community):
- Percentage of people 3 years and older in K-12 schools:
Old Town: 21.4% Salinas: 20.2%
- Percentage of people 3 years and older in undergraduate colleges:
Old Town: 9.9% Salinas: 4.8%
- Percentage of people 3 years and older in grad. or professional schools:
Old Town: 2.8% Salinas: 0.8%
- Percentage of students K-12 enrolled in private schools:
Old Town: 12.2% Salinas: 2.5%
Percentage of population below poverty level:
| Old Town: | 21.0% |
| Salinas: | 12.6% |
Median year renter moved in (as recorded in 2022):
| Old Town: | 2015 |
| Salinas: | 2018 |
Percentage of married-couple families with both working:
| Old Town: | 103.7% |
| Salinas: | 70.1% |
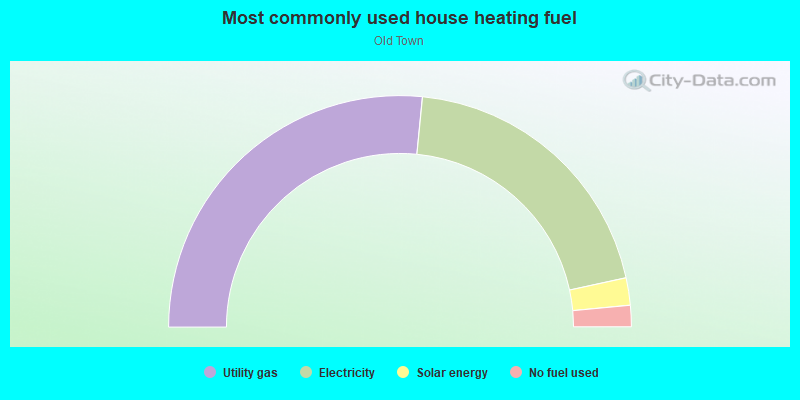
- 42.9%Electricity
- 42.2%Utility gas
- 10.8%No fuel used
- 2.3%Bottled, tank, or LP gas
- 1.1%Wood
- 0.7%Solar energy
Highways in this neighborhood:
State Rte 68 (S Main St)
Length: 0.16 miles
Direction: N-S
Address range: 500 to 629
Direction: N-S
Address range: 500 to 629
State Rte 183 (W Market St)
Length: 0.03 miles
Direction: E-W
Address range: 38 to 51
Direction: E-W
Address range: 38 to 51
Roads and streets:
Pajaro St
Length: 0.51 miles
Direction: N-S
Address range: 201 to 599
Direction: N-S
Address range: 201 to 599
Salinas St
Length: 0.45 miles
Directions: N-S, SW-NE
Address range: 100 to 499
Directions: N-S, SW-NE
Address range: 100 to 499
S Main St (Main St)
Length: 0.40 miles
Direction: N-S
Address range: 100 to 499
Direction: N-S
Address range: 100 to 499
Monterey St
Length: 0.36 miles
Direction: N-S
Address range: 200 to 499
Direction: N-S
Address range: 200 to 499
Melody Ln
Length: 0.35 miles
Direction: N-S
Address range: 100 to 399
Direction: N-S
Address range: 100 to 399
John St
Length: 0.23 miles
Direction: E-W
Address range: 2 to 99
Direction: E-W
Address range: 2 to 99
Winham St
Length: 0.18 miles
Direction: E-W
Address range: 1 to 99
Direction: E-W
Address range: 1 to 99
Harvest St
Length: 0.18 miles
Direction: E-W
Address range: 1 to 99
Direction: E-W
Address range: 1 to 99
E San Luis St
Length: 0.16 miles
Direction: E-W
Address range: 1 to 51
Direction: E-W
Address range: 1 to 51
E Alisal St
Length: 0.16 miles
Direction: E-W
Address range: 1 to 51
Direction: E-W
Address range: 1 to 51
E Gabilan St
Length: 0.16 miles
Direction: E-W
Address range: 1 to 51
Direction: E-W
Address range: 1 to 51
Midtown Ln
Length: 0.13 miles
Direction: E-W
Address range: 1 to 99
Direction: E-W
Address range: 1 to 99
Harmony Ln
Length: 0.13 miles
Direction: N-S
Direction: N-S
Lacey Ln
Length: 0.09 miles
Direction: N-S
Direction: N-S
W San Luis St
Length: 0.08 miles
Direction: E-W
Address range: 1 to 52
Direction: E-W
Address range: 1 to 52
W Gabilan St
Length: 0.08 miles
Direction: E-W
Address range: 1 to 21
Direction: E-W
Address range: 1 to 21
W Alisal St
Length: 0.08 miles
Direction: E-W
Address range: 1 to 55
Direction: E-W
Address range: 1 to 55
Central Ave
Length: 0.06 miles
Direction: E-W
Address range: 1 to 21
Direction: E-W
Address range: 1 to 21
Clay St
Length: 0.05 miles
Direction: E-W
Address range: 1 to 49
Direction: E-W
Address range: 1 to 49