Old Town neighborhood in Chicago, Illinois (IL), 60610 detailed profile
Settings
X

Business Search - 14 Million verified businesses
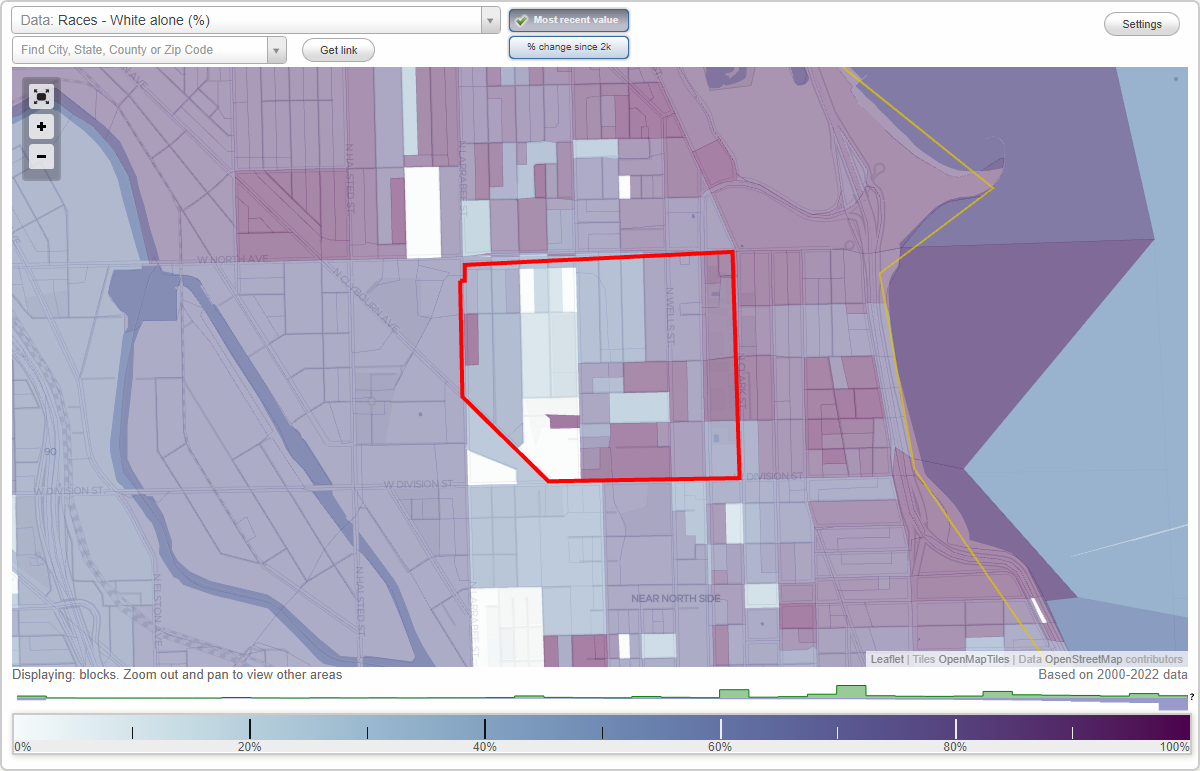
Area: 0.279 square miles
Population: 8,603
Population density:
| Old Town: | 30,874 people per square mile |
| Chicago: | 11,734 people per square mile |

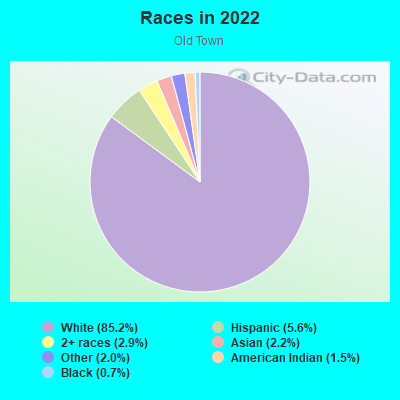
- 4,77445.2%White
- 3,37031.9%Black
- 9629.1%Asian
- 5975.6%Hispanic or Latino
- 5275.0%Two or more races
- 3373.2%American Indian
Distribution of median household income
![Distribution of median household income]()
- 533Less than $10,000
- 757$10,000 to $19,999
- 188$20,000 to $29,999
- 284$30,000 to $39,999
- 326$40,000 to $49,999
- 195$50,000 to $59,999
- 84$60,000 to $74,999
- 209$75,000 to $99,999
- 401$100,000 to $124,999
- 258$125,000 to $149,999
- 770$150,000 to $199,999
- 1,168$200,000 or more

Distribution of owner-occupied house/condo value
![Distribution of owner-occupied house/condo value]()
- 79Less than $50,000
- 91$150,000 to $199,999
- 59$200,000 to $249,999
- 182$250,000 to $299,999
- 134$300,000 to $399,999
- 487$400,000 to $499,999
- 747$500,000 to $749,999
- 164$750,000 to $999,999
- 364$1,000,000 or more

Distribution of rent paid by renters
![Distribution of rent paid by renters]()
- 97Less than $100
- 278$100 to $199
- 1,052$200 to $299
- 242$300 to $399
- 521$400 to $499
- 984$500 to $599
- 801$600 to $699
- 203$1,000 to $1,249
- 198$1,250 to $1,499
- 549$1,500 to $1,999
- 1,233$2,000 or more

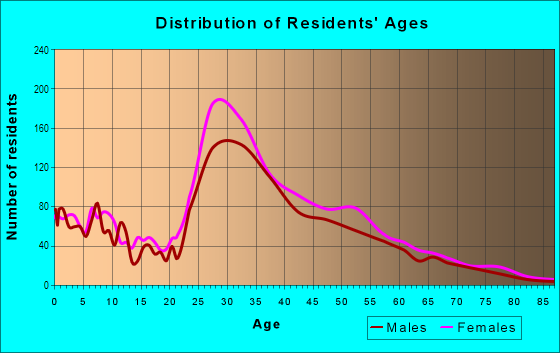
| Males: | 4,162 |
| Females: | 4,441 |
Males:
| This neighborhood: | 30.6 years |
| Whole city: | 35.3 years |
| This neighborhood: | 28.7 years |
| Whole city: | 36.2 years |
Average household size:
| Old Town: | 2.1 people |
| Chicago: | 2.3 people |
Percentage of family households:
| Old Town: | 39.4% |
| Chicago: | 36.7% |
| Here: | 24.1% |
| Chicago: | 30.4% |
Percentage of married-couple families with children (among all households):
| Old Town: | 20.1% |
| Chicago: | 24.1% |
Percentage of single-mother households (among all households):
| Old Town: | 23.6% |
| Chicago: | 16.0% |
Percentage of never married males 15 years old and over:
Percentage of never married females 15 years old and over:
| Old Town: | 26.7% |
| Chicago: | 24.5% |
Percentage of never married females 15 years old and over:
| Old Town: | 32.3% |
| city: | 24.9% |
Percentage of people that speak English not well or not at all:
| Old Town: | 0.4% |
| Chicago: | 7.1% |
Percentage of people born in this state:
Percentage of people born in another U.S. state:
Percentage of native residents but born outside the U.S.:
Percentage of foreign born residents:
| Here: | 65.9% |
| Chicago: | 58.6% |
Percentage of people born in another U.S. state:
| Old Town: | 30.0% |
| Chicago: | 18.8% |
Percentage of native residents but born outside the U.S.:
| Here: | 0.0% |
| city: | 2.1% |
Percentage of foreign born residents:
| Here: | 4.1% |
| Chicago: | 20.6% |
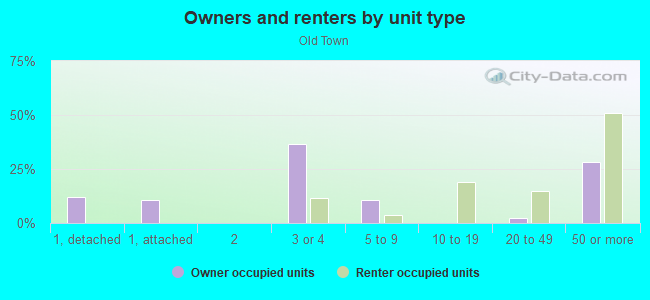
Owner-occupied
Renter-occupied

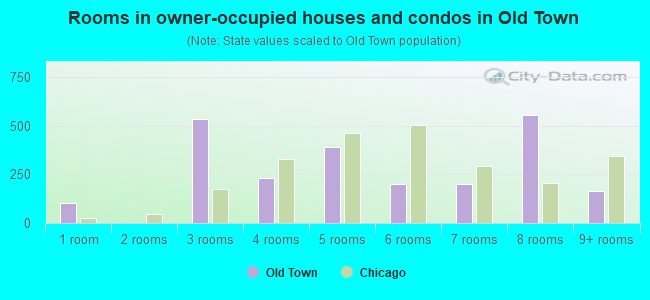
- Rooms in owner-occupied houses and condos in Old Town
- 1031 room
- 02 rooms
- 5343 rooms
- 2324 rooms
- 3915 rooms
- 2016 rooms
- 2017 rooms
- 5568 rooms
- 1669+ rooms
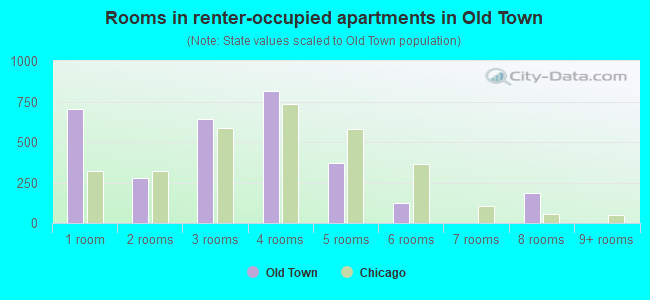
- Rooms in renter-occupied apartments in Old Town
- 7011 room
- 2772 rooms
- 6413 rooms
- 8164 rooms
- 3715 rooms
- 1266 rooms
- 07 rooms
- 1858 rooms
- 09+ rooms
Owner-occupied
Renter-occupied
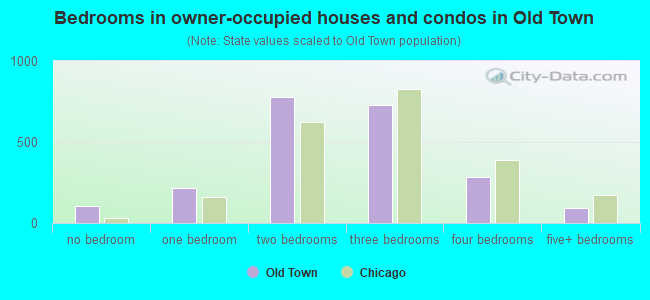
- Bedrooms in owner-occupied houses and condos in Old Town
- 103no bedroom
- 2151 bedroom
- 7762 bedrooms
- 7293 bedrooms
- 2874 bedrooms
- 945+ bedrooms
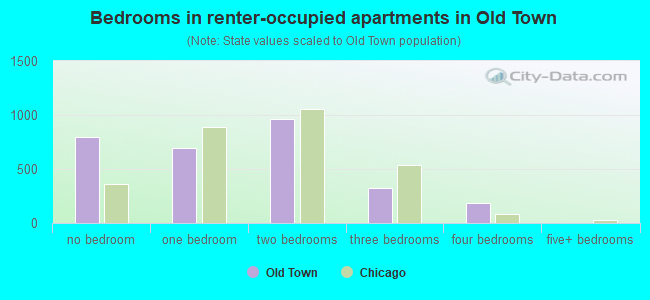
- Bedrooms in renter-occupied apartments in Old Town
- 798no bedroom
- 6901 bedroom
- 9592 bedrooms
- 3273 bedrooms
- 1854 bedrooms
- 05+ bedrooms
Average number of cars or other vehicles available in houses/condos:
Average number of cars or other vehicles available in apartments:
| This neighborhood: | |
| Chicago: |
Average number of cars or other vehicles available in apartments:
| Here: | 0.5 |
| city: | 0.8 |
Percentage of units with a mortgage:
| Old Town: | 75.0% |
| Chicago: | 64.7% |
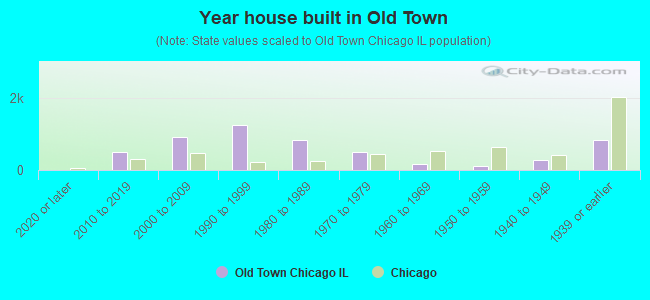
- Year house built in Old Town
- 02020 or later
- 4922010 to 2019
- 9032000 to 2009
- 1,2391990 to 1999
- 8181980 to 1989
- 4941970 to 1979
- 1731960 to 1969
- 1201950 to 1959
- 2671940 to 1949
- 8191939 or earlier
City-data.com crime index for city in 2020 (higher means more crime):
| City: | 421.1 |
| U.S. average: | 219.5 |
Travel time to work (commute)
![Travel time to work (commute)]()
- 795 to 9 minutes
- 70810 to 14 minutes
- 44915 to 19 minutes
- 58720 to 24 minutes
- 42725 to 29 minutes
- 1,29530 to 34 minutes
- 62240 to 44 minutes
- 65545 to 59 minutes
- 51360 to 89 minutes
- 22690 or more minutes

Means of transportation to work
![Means of transportation to work]()
- 23.5%1,316Drove a car alone
- 9.9%556Carpooled
- 13.6%765Bus
- 14.7%824Subway or elevated rail
- 3.0%168Long-distance train or commuter rail
- 3.0%168Light rail, streetcar or trolley
- 2.6%145Motorcycle
- 4.5%255Bicycle
- 9.2%516Walked
- 1.2%66Other means
- 28.6%1,603Worked at home

Time leaving home to go to work
![Time leaving home to go to work]()
- 4696:00 a.m. to 6:29 a.m.
- 7566:30 a.m. to 6:59 a.m.
- 1,4327:00 a.m. to 7:29 a.m.
- 9067:30 a.m. to 7:59 a.m.
- 9068:00 a.m. to 8:29 a.m.
- 5488:30 a.m. to 8:59 a.m.
- 3129:00 a.m. to 9:59 a.m.
- 44910:00 a.m. to 10:59 a.m.
- 14311:00 a.m. to 11:59 a.m.
- 7912:00 p.m. to 3:59 p.m.

Occupations of males:
- Percentage of males in management occupations (except farmers):
Here: 10.1% city: 12.0%
- Percentage of males in business and financial operations occupations:
Here: 31.2% city: 7.9%
- Percentage of males in computer and mathematical occupations:
Here: 13.3% city: 6.3%
- Percentage of males in architecture and engineering occupations:
Here: 1.5% city: 2.4%
- Percentage of males in legal occupations:
Here: 9.9% city: 2.1%
- Percentage of males in healthcare practitioners and technical occupations:
Here: 5.6% city: 3.1%
- Percentage of males in service occupations:
Here: 3.2% city: 15.8%
- Percentage of males in sales and office occupations:
Here: 20.8% city: 14.5%
Occupations of females:
- Percentage of females in management occupations (except farmers):
Here: 16.6% city: 11.1%
- Percentage of females in business and financial operations occupations:
Here: 14.7% city: 9.2%
- Percentage of females in architecture and engineering occupations:
Here: 3.0% city: 0.8%
- Percentage of females in life, physical, and social science occupations:
Here: 4.0% city: 1.2%
- Percentage of females in community and social services occupations:
Here: 1.4% city: 3.0%
- Percentage of females in legal occupations:
Here: 12.4% city: 2.3%
- Percentage of females in education, training, and library occupations:
Here: 3.4% city: 8.8%
- Percentage of females in healthcare practitioners and technical occupations:
Here: 6.7% city: 8.5%
- Percentage of females in service occupations:
Here: 11.8% city: 19.6%
- Percentage of females in sales and office occupations:
Here: 17.8% city: 23.3%
- Percentage of females in material moving occupations:
Here: 6.5% city: 1.9%
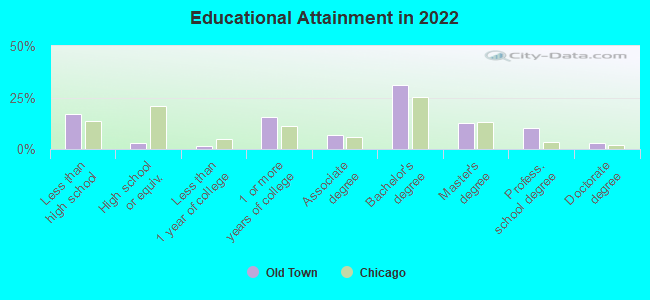
Education in this neighborhood (subdivision or community):
- Percentage of people 3 years and older in K-12 schools:
Old Town: 23.2% Chicago: 14.6%
- Percentage of people 3 years and older in undergraduate colleges:
Old Town: 14.1% Chicago: 5.1%
- Percentage of people 3 years and older in grad. or professional schools:
Old Town: 5.0% Chicago: 2.6%
- Percentage of students K-12 enrolled in private schools:
Old Town: 30.5% Chicago: 15.6%
Percentage of population below poverty level:
| Old Town: | 21.5% |
| Chicago: | 17.2% |
Median year renter moved in (as recorded in 2022):
| Old Town: | 2010 |
| Chicago: | 2020 |
Percentage of married-couple families with both working:
| Old Town: | 90.0% |
| Chicago: | 69.2% |
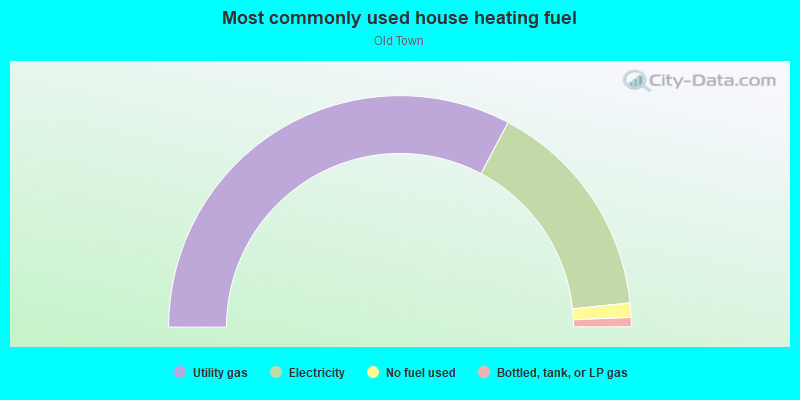
- 65.5%Utility gas
- 31.2%Electricity
- 2.0%No fuel used
- 1.3%Bottled, tank, or LP gas
Roads and streets:
W Goethe St
Length: 0.61 miles
Directions: E-W, SW-NE
Address range: 111 to 499
Directions: E-W, SW-NE
Address range: 111 to 499
W Evergreen Ave
Length: 0.43 miles
Direction: E-W
Address range: 200 to 499
Direction: E-W
Address range: 200 to 499
Lasalle St
Length: 0.43 miles
Direction: N-S
Direction: N-S
W Schiller St
Length: 0.41 miles
Direction: E-W
Address range: 110 to 399
Direction: E-W
Address range: 110 to 399
N Cleveland Ave
Length: 0.41 miles
Directions: N-S, SW-NE
Address range: 1222 to 1553
Directions: N-S, SW-NE
Address range: 1222 to 1553
N Sedgwick St
Length: 0.38 miles
Direction: N-S
Address range: 1238 to 1555
Direction: N-S
Address range: 1238 to 1555
N Wells St
Length: 0.37 miles
Direction: N-S
Address range: 1200 to 1499
Direction: N-S
Address range: 1200 to 1499
N Mohawk St
Length: 0.35 miles
Direction: N-S
Address range: 1300 to 1553
Direction: N-S
Address range: 1300 to 1553
W Blackhawk St
Length: 0.33 miles
Direction: E-W
Address range: 400 to 599
Direction: E-W
Address range: 400 to 599
N Hudson Ave
Length: 0.31 miles
Direction: N-S
Address range: 1221 to 1579
Direction: N-S
Address range: 1221 to 1579
W Scott St
Length: 0.28 miles
Direction: E-W
Address range: 200 to 499
Direction: E-W
Address range: 200 to 499
N la Salle Dr
Length: 0.26 miles
Direction: N-S
Address range: 1300 to 1511
Direction: N-S
Address range: 1300 to 1511
N Larrabee St
Length: 0.19 miles
Direction: N-S
Address range: 1400 to 1499
Direction: N-S
Address range: 1400 to 1499
N Orleans St
Length: 0.19 miles
Direction: N-S
Address range: 1400 to 1532
Direction: N-S
Address range: 1400 to 1532
N Clybourn Ave
Length: 0.19 miles
Direction: SE-NW
Address range: 1250 to 1399
Direction: SE-NW
Address range: 1250 to 1399
W Sullivan St
Length: 0.17 miles
Direction: E-W
Address range: 400 to 499
Direction: E-W
Address range: 400 to 499
N la Salle Blvd (N la Salle Dr)
Length: 0.13 miles
Direction: N-S
Address range: 1200 to 1299
Direction: N-S
Address range: 1200 to 1299
N North Park Ave
Length: 0.10 miles
Direction: N-S
Address range: 1330 to 1427
Direction: N-S
Address range: 1330 to 1427
W Burton Pl
Length: 0.06 miles
Direction: E-W
Address range: 140 to 161
Direction: E-W
Address range: 140 to 161
N Schick Pl
Length: 0.06 miles
Directions: E-W, SW-NE
Address range: 1246 to 1299
Directions: E-W, SW-NE
Address range: 1246 to 1299
N Wieland St
Length: 0.03 miles
Direction: N-S
Address range: 1400 to 1423
Direction: N-S
Address range: 1400 to 1423
Railroad features:
Conrail RR (Norfolk Southern Rlwy)
Length: 0.75 miles
Directions: E-W, N-S, SE-NW
Directions: E-W, N-S, SE-NW