Old Port neighborhood in San Jose, California (CA), 95131, 95132 detailed profile
Settings
X

Business Search - 14 Million verified businesses
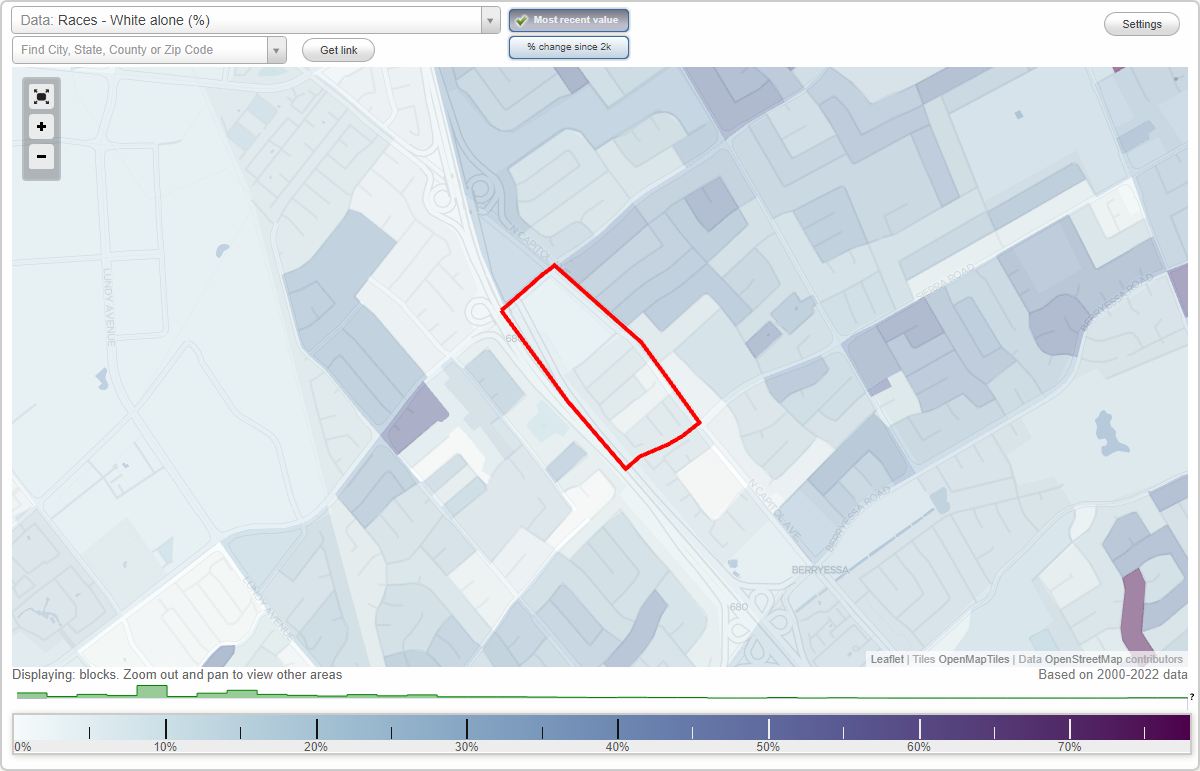
Area: 0.099 square miles
Population: 619
Population density:
| Old Port: | 6,254 people per square mile |
| San Jose: | 5,554 people per square mile |

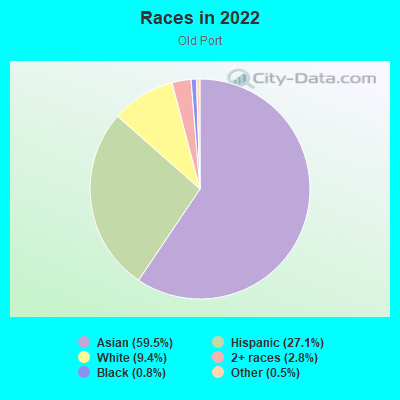
- 36759.5%Asian
- 16727.1%Hispanic or Latino
- 589.4%White
- 172.8%Two or more races
- 50.8%Black
- 30.5%Some other race
Median household income in 2022:
| Old Port: | $158,807 |
| San Jose: | $133,835 |
Distribution of median household income
![Distribution of median household income]()
- 9Less than $10,000
- 31$10,000 to $19,999
- 7$20,000 to $29,999
- 14$30,000 to $39,999
- 22$40,000 to $49,999
- 12$50,000 to $59,999
- 19$60,000 to $74,999
- 17$75,000 to $99,999
- 12$100,000 to $124,999
- 16$125,000 to $149,999
- 40$150,000 to $199,999
- 53$200,000 or more

Distribution of owner-occupied house/condo value
![Distribution of owner-occupied house/condo value]()
- 10Less than $50,000
- 5$50,000 to $99,999
- 2$100,000 to $149,999
- 7$400,000 to $499,999
- 10$500,000 to $749,999
- 28$750,000 to $999,999
- 31$1,000,000 or more

Distribution of rent paid by renters
![Distribution of rent paid by renters]()
- 5$500 to $599
- 3$1,250 to $1,499
- 26$1,500 to $1,999
- 90$2,000 or more

Median rent in 2022:
| Old Port: | $2,495 |
| San Jose: | $2,001 |
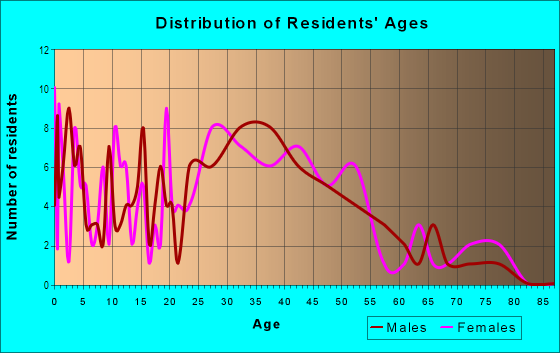
| Males: | 347 |
| Females: | 272 |
Males:
| This neighborhood: | 40.5 years |
| Whole city: | 37.6 years |
| This neighborhood: | 44.8 years |
| Whole city: | 39.1 years |
Average household size:
| Old Port: | 9.6 people |
| San Jose: | 2.9 people |
Percentage of family households:
| Old Port: | 63.3% |
| San Jose: | 49.9% |
| Here: | 71.3% |
| San Jose: | 53.0% |
Percentage of married-couple families with children (among all households):
| Old Port: | 26.0% |
| San Jose: | 25.8% |
Percentage of single-mother households (among all households):
| Old Port: | 0.9% |
| San Jose: | 5.2% |
Percentage of never married males 15 years old and over:
Percentage of never married females 15 years old and over:
| Old Port: | 25.1% |
| San Jose: | 20.9% |
Percentage of never married females 15 years old and over:
| Old Port: | 16.5% |
| city: | 16.7% |
Percentage of people that speak English not well or not at all:
| Old Port: | 18.4% |
| San Jose: | 11.4% |
Percentage of people born in this state:
Percentage of people born in another U.S. state:
Percentage of native residents but born outside the U.S.:
Percentage of foreign born residents:
| Here: | 40.2% |
| San Jose: | 46.1% |
Percentage of people born in another U.S. state:
| Old Port: | 3.2% |
| San Jose: | 10.4% |
Percentage of native residents but born outside the U.S.:
| Here: | 2.4% |
| city: | 1.7% |
Percentage of foreign born residents:
| Here: | 54.2% |
| San Jose: | 41.8% |
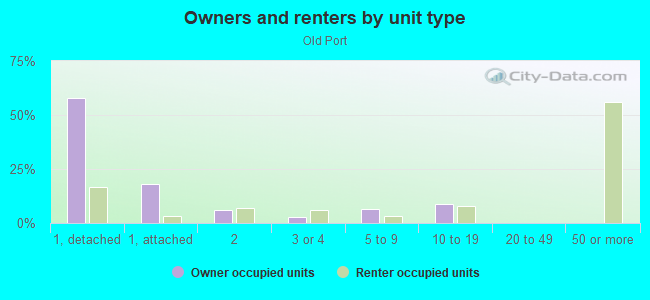
Owner-occupied
Renter-occupied

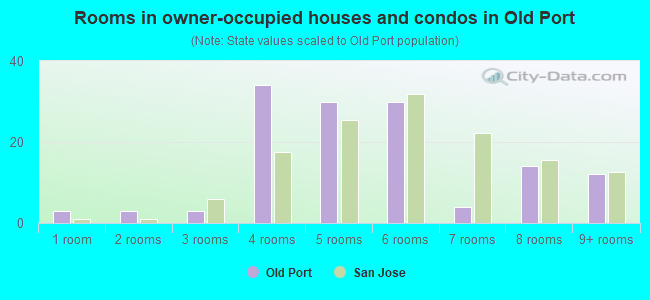
- Rooms in owner-occupied houses and condos in Old Port
- 31 room
- 32 rooms
- 33 rooms
- 344 rooms
- 305 rooms
- 306 rooms
- 47 rooms
- 148 rooms
- 129+ rooms
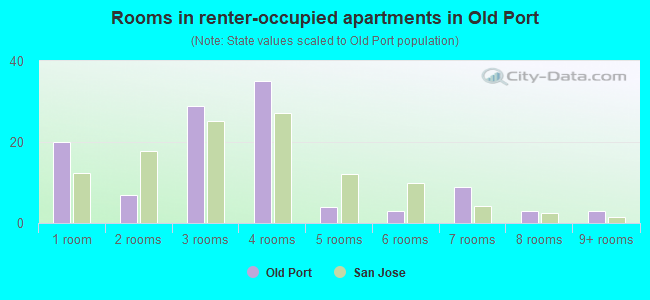
- Rooms in renter-occupied apartments in Old Port
- 201 room
- 72 rooms
- 293 rooms
- 354 rooms
- 45 rooms
- 36 rooms
- 97 rooms
- 38 rooms
- 39+ rooms
Owner-occupied
Renter-occupied
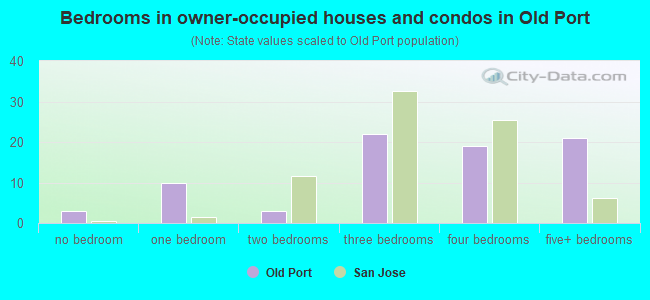
- Bedrooms in owner-occupied houses and condos in Old Port
- 3no bedroom
- 101 bedroom
- 32 bedrooms
- 223 bedrooms
- 194 bedrooms
- 215+ bedrooms
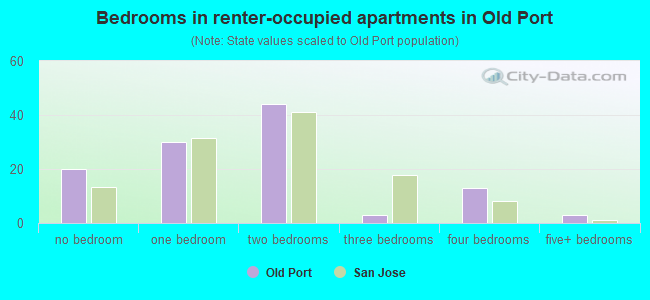
- Bedrooms in renter-occupied apartments in Old Port
- 20no bedroom
- 301 bedroom
- 442 bedrooms
- 33 bedrooms
- 134 bedrooms
- 35+ bedrooms
Average number of cars or other vehicles available in houses/condos:
Average number of cars or other vehicles available in apartments:
| This neighborhood: | 2.4 |
| San Jose: | 2.3 |
Average number of cars or other vehicles available in apartments:
| Here: | 2.6 |
| city: | 1.6 |
Percentage of units with a mortgage:
| Old Port: | 36.9% |
| San Jose: | 66.9% |
Average estimated value of detached houses in 2022 (43.1% of all units):
| Old Port: | $1,066,905 |
| San Jose: | $1,532,815 |
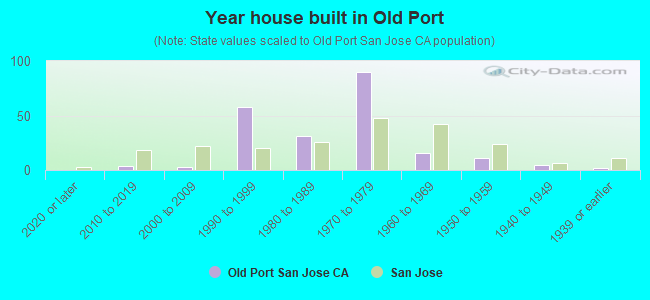
- Year house built in Old Port
- 02020 or later
- 42010 to 2019
- 32000 to 2009
- 581990 to 1999
- 311980 to 1989
- 901970 to 1979
- 161960 to 1969
- 111950 to 1959
- 51940 to 1949
- 21939 or earlier
City-data.com crime index for city in 2020 (higher means more crime):
| City: | 268.4 |
| U.S. average: | 219.5 |
Travel time to work (commute)
![Travel time to work (commute)]()
- 4Less than 5 minutes
- 85 to 9 minutes
- 4010 to 14 minutes
- 3415 to 19 minutes
- 6820 to 24 minutes
- 2425 to 29 minutes
- 5730 to 34 minutes
- 935 to 39 minutes
- 240 to 44 minutes
- 2045 to 59 minutes
- 2160 to 89 minutes
- 1090 or more minutes

Means of transportation to work
![Means of transportation to work]()
- 61.0%222Drove a car alone
- 12.9%47Carpooled
- 7.4%27Bus
- 1.1%4Subway or elevated rail
- 4.9%18Light rail, streetcar or trolley
- 10.4%38Motorcycle
- 7.1%26Other means
- 12.9%47Worked at home

Time leaving home to go to work
![Time leaving home to go to work]()
- 1612:00 a.m. to 4:59 a.m.
- 145:00 a.m. to 5:29 a.m.
- 115:30 a.m. to 5:59 a.m.
- 206:00 a.m. to 6:29 a.m.
- 246:30 a.m. to 6:59 a.m.
- 277:00 a.m. to 7:29 a.m.
- 137:30 a.m. to 7:59 a.m.
- 518:00 a.m. to 8:29 a.m.
- 278:30 a.m. to 8:59 a.m.
- 429:00 a.m. to 9:59 a.m.
- 1310:00 a.m. to 10:59 a.m.
- 711:00 a.m. to 11:59 a.m.
- 2512:00 p.m. to 3:59 p.m.
- 104:00 p.m. to 11:59 p.m.

Occupations of males:
- Percentage of males in management occupations (except farmers):
Here: 4.6% city: 13.0%
- Percentage of males in business and financial operations occupations:
Here: 2.0% city: 4.6%
- Percentage of males in computer and mathematical occupations:
Here: 5.8% city: 13.6%
- Percentage of males in architecture and engineering occupations:
Here: 10.8% city: 10.2%
- Percentage of males in arts, design, entertainment, sports, and media occupations:
Here: 1.7% city: 1.8%
- Percentage of males in healthcare practitioners and technical occupations:
Here: 2.0% city: 2.0%
- Percentage of males in service occupations:
Here: 10.7% city: 12.7%
- Percentage of males in sales and office occupations:
Here: 16.5% city: 12.8%
- Percentage of males in construction, extraction, and maintenance occupations:
Here: 13.0% city: 7.8%
- Percentage of males in production occupations:
Here: 16.5% city: 5.5%
- Percentage of males in transportation occupations:
Here: 9.0% city: 3.6%
- Percentage of males in material moving occupations:
Here: 5.1% city: 3.1%
Occupations of females:
- Percentage of females in management occupations (except farmers):
Here: 9.2% city: 11.0%
- Percentage of females in business and financial operations occupations:
Here: 14.2% city: 8.6%
- Percentage of females in computer and mathematical occupations:
Here: 4.8% city: 5.4%
- Percentage of females in architecture and engineering occupations:
Here: 2.2% city: 2.8%
- Percentage of females in community and social services occupations:
Here: 2.0% city: 1.8%
- Percentage of females in arts, design, entertainment, sports, and media occupations:
Here: 2.0% city: 2.0%
- Percentage of females in healthcare practitioners and technical occupations:
Here: 6.9% city: 6.8%
- Percentage of females in service occupations:
Here: 19.1% city: 21.7%
- Percentage of females in sales and office occupations:
Here: 22.7% city: 22.0%
- Percentage of females in production occupations:
Here: 11.3% city: 4.0%
- Percentage of females in material moving occupations:
Here: 5.5% city: 1.5%
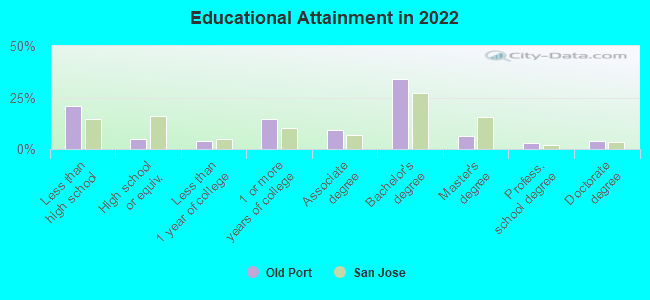
Education in this neighborhood (subdivision or community):
- Percentage of people 3 years and older in K-12 schools:
Old Port: 22.3% San Jose: 16.1%
- Percentage of people 3 years and older in undergraduate colleges:
Old Port: 6.4% San Jose: 6.5%
- Percentage of people 3 years and older in grad. or professional schools:
Old Port: 1.5% San Jose: 2.0%
- Percentage of students K-12 enrolled in private schools:
Old Port: 23.0% San Jose: 14.9%
Percentage of population below poverty level:
| Old Port: | 5.9% |
| San Jose: | 9.0% |
Median year owner moved in (as recorded in 2022):
Median year renter moved in (as recorded in 2022):
| Old Port: | 2000 |
| San Jose: | 2008 |
Median year renter moved in (as recorded in 2022):
| Old Port: | 2017 |
| San Jose: | 2020 |
Percentage of married-couple families with both working:
| Old Port: | 90.1% |
| San Jose: | 72.5% |
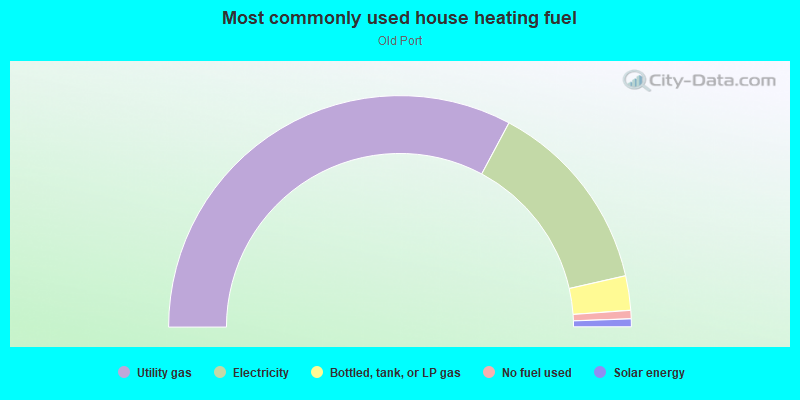
- 65.7%Utility gas
- 27.3%Electricity
- 4.8%Bottled, tank, or LP gas
- 1.2%No fuel used
- 1.1%Solar energy
Roads and streets:
N Capitol Ave
Length: 0.38 miles
Direction: SE-NW
Address range: 1356 to 1583
Direction: SE-NW
Address range: 1356 to 1583
Old Stone Way
Length: 0.21 miles
Directions: N-S, SE-NW
Address range: 1300 to 1499
Directions: N-S, SE-NW
Address range: 1300 to 1499
Olivestone Way
Length: 0.19 miles
Direction: SW-NE
Address range: 2600 to 2699
Direction: SW-NE
Address range: 2600 to 2699
Orangestone Way
Length: 0.19 miles
Direction: SW-NE
Address range: 2600 to 2699
Direction: SW-NE
Address range: 2600 to 2699
Old Post Way Exd (Old Post Way)
Length: 0.18 miles
Directions: E-W, SW-NE
Address range: 2301 to 2399
Directions: E-W, SW-NE
Address range: 2301 to 2399
Cam del Rey
Length: 0.18 miles
Directions: E-W, SW-NE
Address range: 2600 to 2699
Directions: E-W, SW-NE
Address range: 2600 to 2699
Brookhollow Dr
Length: 0.13 miles
Directions: E-W, SW-NE
Address range: 2600 to 2670
Directions: E-W, SW-NE
Address range: 2600 to 2670
Caminonola Ct
Length: 0.11 miles
Directions: SE-NW, SW-NE
Directions: SE-NW, SW-NE
Old Rose Pl
Length: 0.08 miles
Direction: SE-NW
Address range: 1300 to 1399
Direction: SE-NW
Address range: 1300 to 1399
Old Park Pl
Length: 0.07 miles
Direction: SE-NW
Address range: 1300 to 1399
Direction: SE-NW
Address range: 1300 to 1399
Old Stone Pl
Length: 0.06 miles
Directions: E-W, SE-NW
Address range: 1300 to 1399
Directions: E-W, SE-NW
Address range: 1300 to 1399
Glen Hollow Way
Length: 0.05 miles
Direction: SE-NW
Address range: 1300 to 1399
Direction: SE-NW
Address range: 1300 to 1399
Camino Nola Ct
Length: 0.03 miles
Direction: SW-NE
Address range: 2600 to 3099
Direction: SW-NE
Address range: 2600 to 3099