Old Palo Alto neighborhood in Palo Alto, California (CA), 94301 detailed profile
Settings
X


Business Search - 14 Million verified businesses
Area: 0.581 square miles
Population: 3,618
Population density:
| Old Palo Alto: | 6,229 people per square mile |
| Palo Alto: | 2,789 people per square mile |

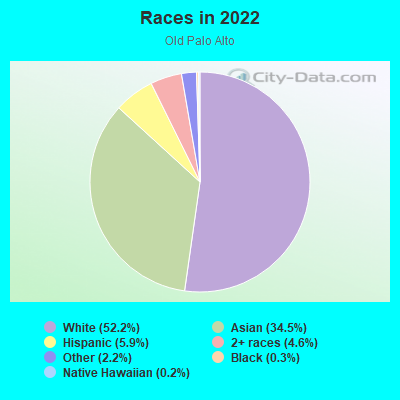
- 1,96152.2%White
- 1,29534.5%Asian
- 2215.9%Hispanic or Latino
- 1714.6%Two or more races
- 842.2%Some other race
- 130.3%Black
- 90.2%Native Hawaiian and Other
Pacific Islander

Median household income in 2022:
| Old Palo Alto: | $229,418 |
| Palo Alto: | $179,707 |
Distribution of median household income
![Distribution of median household income]()
- 58Less than $10,000
- 23$10,000 to $19,999
- 96$20,000 to $29,999
- 47$30,000 to $39,999
- 87$40,000 to $49,999
- 33$50,000 to $59,999
- 32$60,000 to $74,999
- 35$75,000 to $99,999
- 33$100,000 to $124,999
- 82$125,000 to $149,999
- 87$150,000 to $199,999
- 987$200,000 or more

Distribution of owner-occupied house/condo value
![Distribution of owner-occupied house/condo value]()
- 28Less than $50,000
- 38$50,000 to $99,999
- 9$100,000 to $149,999
- 31$400,000 to $499,999
- 33$500,000 to $749,999
- 932$1,000,000 or more

Distribution of rent paid by renters
![Distribution of rent paid by renters]()
- 64$800 to $899
- 44$1,250 to $1,499
- 63$1,500 to $1,999
- 510$2,000 or more

Median rent in 2022:
| Old Palo Alto: | $3,386 |
| Palo Alto: | $2,001 |
| Males: | 1,723 |
| Females: | 1,894 |
Males:
| This neighborhood: | 48.4 years |
| Whole city: | 47.1 years |
| This neighborhood: | 49.2 years |
| Whole city: | 48.1 years |
Average household size:
| Old Palo Alto: | 2.6 people |
| Palo Alto: | 2.3 people |
Percentage of family households:
| Old Palo Alto: | 49.4% |
| Palo Alto: | 42.2% |
| Here: | 68.8% |
| Palo Alto: | 52.1% |
Percentage of married-couple families with children (among all households):
| Old Palo Alto: | 30.7% |
| Palo Alto: | 37.5% |
Percentage of single-mother households (among all households):
| Old Palo Alto: | 4.4% |
| Palo Alto: | 3.5% |
Percentage of never married males 15 years old and over:
Percentage of never married females 15 years old and over:
| Old Palo Alto: | 7.1% |
| Palo Alto: | 17.4% |
Percentage of never married females 15 years old and over:
| Old Palo Alto: | 11.5% |
| city: | 11.8% |
Percentage of people that speak English not well or not at all:
| Old Palo Alto: | 3.4% |
| Palo Alto: | 3.7% |
Percentage of people born in this state:
Percentage of people born in another U.S. state:
Percentage of native residents but born outside the U.S.:
Percentage of foreign born residents:
| Here: | 34.5% |
| Palo Alto: | 36.4% |
Percentage of people born in another U.S. state:
| Old Palo Alto: | 26.8% |
| Palo Alto: | 28.3% |
Percentage of native residents but born outside the U.S.:
| Here: | 1.3% |
| city: | 3.7% |
Percentage of foreign born residents:
| Here: | 37.5% |
| Palo Alto: | 31.6% |
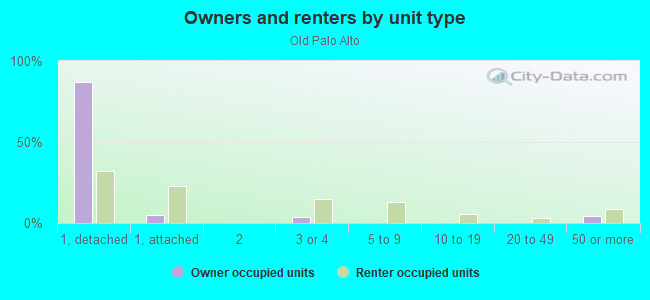
Owner-occupied
Renter-occupied

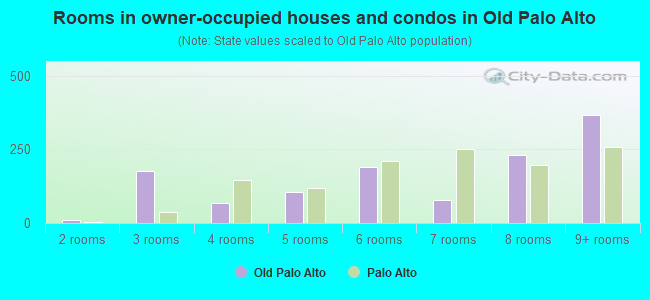
- Rooms in owner-occupied houses and condos in Old Palo Alto
- 01 room
- 112 rooms
- 1783 rooms
- 694 rooms
- 1045 rooms
- 1906 rooms
- 787 rooms
- 2308 rooms
- 3679+ rooms
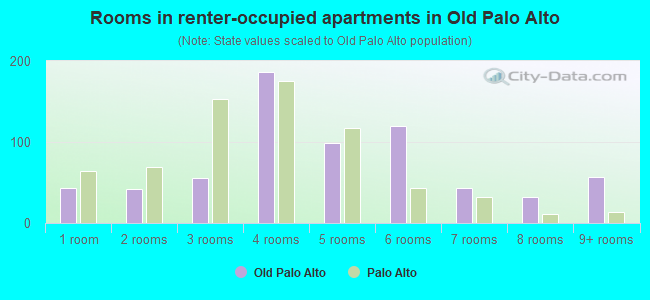
- Rooms in renter-occupied apartments in Old Palo Alto
- 431 room
- 422 rooms
- 553 rooms
- 1864 rooms
- 995 rooms
- 1206 rooms
- 437 rooms
- 328 rooms
- 579+ rooms
Owner-occupied
Renter-occupied
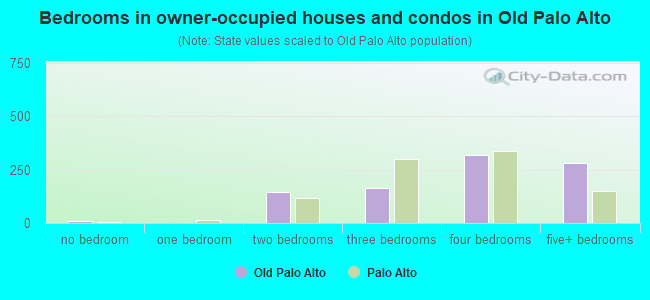
- Bedrooms in owner-occupied houses and condos in Old Palo Alto
- 11no bedroom
- 01 bedroom
- 1472 bedrooms
- 1633 bedrooms
- 3204 bedrooms
- 2845+ bedrooms
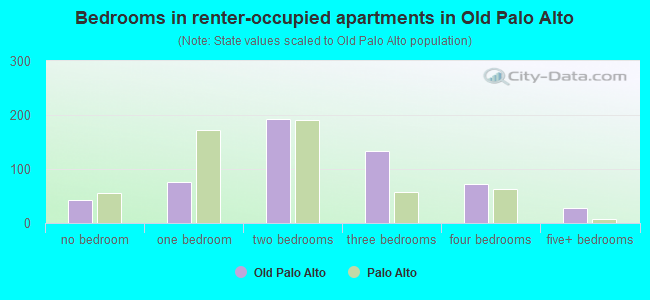
- Bedrooms in renter-occupied apartments in Old Palo Alto
- 43no bedroom
- 761 bedroom
- 1922 bedrooms
- 1343 bedrooms
- 724 bedrooms
- 275+ bedrooms
Average number of cars or other vehicles available in houses/condos:
Average number of cars or other vehicles available in apartments:
| This neighborhood: | 2.1 |
| Palo Alto: | 2.1 |
Average number of cars or other vehicles available in apartments:
| Here: | 1.6 |
| city: | 1.1 |
Percentage of units with a mortgage:
| Old Palo Alto: | 52.8% |
| Palo Alto: | 58.3% |
Average estimated value of detached houses in 2022 (80.5% of all units):
| Old Palo Alto: | $4,273,650 |
| California: | $988,808 |
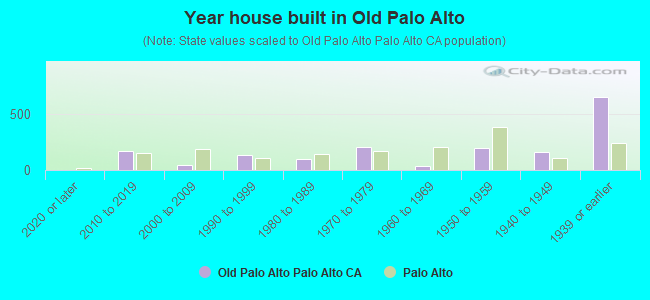
- Year house built in Old Palo Alto
- 02020 or later
- 1702010 to 2019
- 452000 to 2009
- 1351990 to 1999
- 1011980 to 1989
- 2081970 to 1979
- 391960 to 1969
- 1941950 to 1959
- 1571940 to 1949
- 6471939 or earlier
City-data.com crime index for city in 2020 (higher means more crime):
| City: | 180.8 |
| U.S. average: | 219.5 |
Travel time to work (commute)
![Travel time to work (commute)]()
- 11Less than 5 minutes
- 855 to 9 minutes
- 16610 to 14 minutes
- 22015 to 19 minutes
- 27020 to 24 minutes
- 7225 to 29 minutes
- 19030 to 34 minutes
- 1735 to 39 minutes
- 3040 to 44 minutes
- 11045 to 59 minutes
- 2560 to 89 minutes
- 4190 or more minutes

Means of transportation to work
![Means of transportation to work]()
- 51.1%926Drove a car alone
- 4.7%86Carpooled
- 0.5%9Bus
- 3.1%56Long-distance train or commuter rail
- 1.7%30Taxi
- 0.3%6Motorcycle
- 6.2%112Bicycle
- 3.7%68Walked
- 2.1%38Other means
- 34.7%629Worked at home

Time leaving home to go to work
![Time leaving home to go to work]()
- 1012:00 a.m. to 4:59 a.m.
- 155:00 a.m. to 5:29 a.m.
- 415:30 a.m. to 5:59 a.m.
- 486:00 a.m. to 6:29 a.m.
- 716:30 a.m. to 6:59 a.m.
- 1427:00 a.m. to 7:29 a.m.
- 1707:30 a.m. to 7:59 a.m.
- 1788:00 a.m. to 8:29 a.m.
- 1098:30 a.m. to 8:59 a.m.
- 2469:00 a.m. to 9:59 a.m.
- 1610:00 a.m. to 10:59 a.m.
- 4811:00 a.m. to 11:59 a.m.
- 7512:00 p.m. to 3:59 p.m.
- 1304:00 p.m. to 11:59 p.m.

Occupations of males:
- Percentage of males in management occupations (except farmers):
Here: 26.0% city: 19.1%
- Percentage of males in business and financial operations occupations:
Here: 11.6% city: 7.0%
- Percentage of males in computer and mathematical occupations:
Here: 7.6% city: 22.2%
- Percentage of males in architecture and engineering occupations:
Here: 15.2% city: 10.1%
- Percentage of males in life, physical, and social science occupations:
Here: 7.4% city: 6.4%
- Percentage of males in legal occupations:
Here: 3.7% city: 2.5%
- Percentage of males in education, training, and library occupations:
Here: 1.2% city: 7.2%
- Percentage of males in arts, design, entertainment, sports, and media occupations:
Here: 3.4% city: 3.2%
- Percentage of males in healthcare practitioners and technical occupations:
Here: 9.2% city: 4.6%
- Percentage of males in service occupations:
Here: 1.6% city: 4.5%
- Percentage of males in sales and office occupations:
Here: 6.9% city: 5.7%
- Percentage of males in construction, extraction, and maintenance occupations:
Here: 1.0% city: 1.7%
- Percentage of males in production occupations:
Here: 1.5% city: 1.4%
Occupations of females:
- Percentage of females in management occupations (except farmers):
Here: 30.5% city: 19.0%
- Percentage of females in business and financial operations occupations:
Here: 4.7% city: 8.3%
- Percentage of females in computer and mathematical occupations:
Here: 5.0% city: 8.6%
- Percentage of females in architecture and engineering occupations:
Here: 15.0% city: 4.0%
- Percentage of females in life, physical, and social science occupations:
Here: 3.7% city: 6.8%
- Percentage of females in legal occupations:
Here: 10.4% city: 4.8%
- Percentage of females in education, training, and library occupations:
Here: 7.4% city: 12.9%
- Percentage of females in arts, design, entertainment, sports, and media occupations:
Here: 1.8% city: 4.3%
- Percentage of females in healthcare practitioners and technical occupations:
Here: 9.9% city: 8.7%
- Percentage of females in service occupations:
Here: 7.2% city: 8.4%
- Percentage of females in sales and office occupations:
Here: 4.3% city: 11.7%
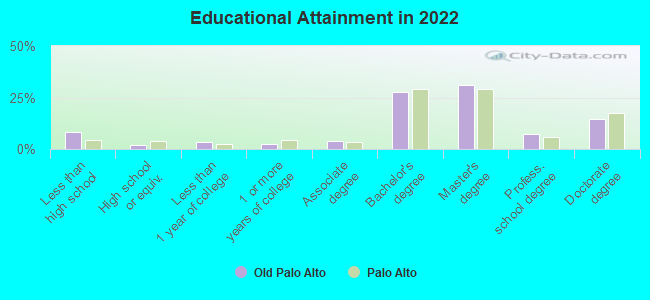
Education in this neighborhood (subdivision or community):
- Percentage of people 3 years and older in K-12 schools:
Old Palo Alto: 25.8% Palo Alto: 14.2%
- Percentage of people 3 years and older in undergraduate colleges:
Old Palo Alto: 2.2% Palo Alto: 2.4%
- Percentage of people 3 years and older in grad. or professional schools:
Old Palo Alto: 5.1% Palo Alto: 2.8%
- Percentage of students K-12 enrolled in private schools:
Old Palo Alto: 39.8% Palo Alto: 22.1%
Percentage of population below poverty level:
| Old Palo Alto: | 3.2% |
| Palo Alto: | 4.5% |
Median year owner moved in (as recorded in 2022):
Median year renter moved in (as recorded in 2022):
| Old Palo Alto: | 2001 |
| Palo Alto: | 2001 |
Median year renter moved in (as recorded in 2022):
| Old Palo Alto: | 2019 |
| Palo Alto: | 2019 |
Percentage of married-couple families with both working:
| Old Palo Alto: | 81.2% |
| Palo Alto: | 68.5% |
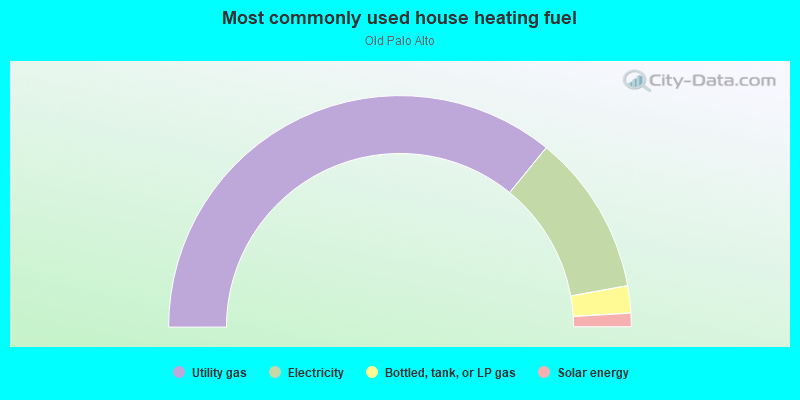
- 71.8%Utility gas
- 22.5%Electricity
- 3.8%Bottled, tank, or LP gas
- 1.9%Solar energy
Limited-access highways (interstate or state) in this neighborhood:
Oregon Expy
Length: 0.68 miles
Directions: E-W, SW-NE
Directions: E-W, SW-NE
Roads and streets:
Emerson St
Length: 1.11 miles
Direction: SE-NW
Address range: 1300 to 2399
Direction: SE-NW
Address range: 1300 to 2399
Waverley St
Length: 1.05 miles
Directions: E-W, SE-NW
Address range: 1408 to 2399
Directions: E-W, SE-NW
Address range: 1408 to 2399
Bryant St
Length: 1.02 miles
Direction: SE-NW
Address range: 1400 to 2399
Direction: SE-NW
Address range: 1400 to 2399
Cowper St
Length: 0.97 miles
Direction: SE-NW
Address range: 1456 to 2399
Direction: SE-NW
Address range: 1456 to 2399
Webster St
Length: 0.90 miles
Direction: SE-NW
Address range: 1508 to 2499
Direction: SE-NW
Address range: 1508 to 2499
Oregon Ave
Length: 0.70 miles
Directions: E-W, SW-NE
Address range: 100 to 749
Directions: E-W, SW-NE
Address range: 100 to 749
Santa Rita Ave
Length: 0.64 miles
Direction: SW-NE
Address range: 151 to 699
Direction: SW-NE
Address range: 151 to 699
N California Ave
Length: 0.64 miles
Direction: SW-NE
Address range: 1 to 641
Direction: SW-NE
Address range: 1 to 641
Lowell Ave
Length: 0.59 miles
Direction: SW-NE
Address range: 200 to 699
Direction: SW-NE
Address range: 200 to 699
Seale Ave
Length: 0.59 miles
Direction: SW-NE
Address range: 200 to 699
Direction: SW-NE
Address range: 200 to 699
Tennyson Ave
Length: 0.58 miles
Direction: SW-NE
Address range: 200 to 699
Direction: SW-NE
Address range: 200 to 699
Coleridge Ave
Length: 0.58 miles
Directions: N-S, SW-NE
Address range: 200 to 699
Directions: N-S, SW-NE
Address range: 200 to 699
Middlefield Rd
Length: 0.57 miles
Direction: SE-NW
Address range: 1608 to 2399
Direction: SE-NW
Address range: 1608 to 2399
Byron St
Length: 0.50 miles
Direction: SE-NW
Address range: 1900 to 2399
Direction: SE-NW
Address range: 1900 to 2399
Churchill Ave
Length: 0.42 miles
Directions: N-S, SW-NE
Address range: 200 to 599
Directions: N-S, SW-NE
Address range: 200 to 599
Washington Ave
Length: 0.42 miles
Direction: SW-NE
Address range: 100 to 599
Direction: SW-NE
Address range: 100 to 599
Tasso St
Length: 0.38 miles
Direction: SE-NW
Address range: 1900 to 2399
Direction: SE-NW
Address range: 1900 to 2399
High St
Length: 0.30 miles
Directions: E-W, SE-NW
Address range: 2100 to 2398
Directions: E-W, SE-NW
Address range: 2100 to 2398
Nevada Ave
Length: 0.29 miles
Direction: SW-NE
Address range: 100 to 599
Direction: SW-NE
Address range: 100 to 599
Kellogg Ave
Length: 0.24 miles
Direction: SW-NE
Address range: 200 to 399
Direction: SW-NE
Address range: 200 to 399
Ramona St
Length: 0.20 miles
Direction: SE-NW
Address range: 2200 to 2399
Direction: SE-NW
Address range: 2200 to 2399
South Ct
Length: 0.16 miles
Direction: SE-NW
Address range: 2200 to 2399
Direction: SE-NW
Address range: 2200 to 2399
Rinconada Ave
Length: 0.12 miles
Direction: SW-NE
Address range: 200 to 299
Direction: SW-NE
Address range: 200 to 299
Alma St
Length: 0.11 miles
Directions: E-W, SE-NW
Address range: 2200 to 2399
Directions: E-W, SE-NW
Address range: 2200 to 2399
Waverley Oaks
Length: 0.10 miles
Directions: SE-NW, SW-NE
Address range: 1 to 199
Directions: SE-NW, SW-NE
Address range: 1 to 199