Ohlone neighborhood in San Jose, California (CA), 95132 detailed profile
Settings
X

Business Search - 14 Million verified businesses
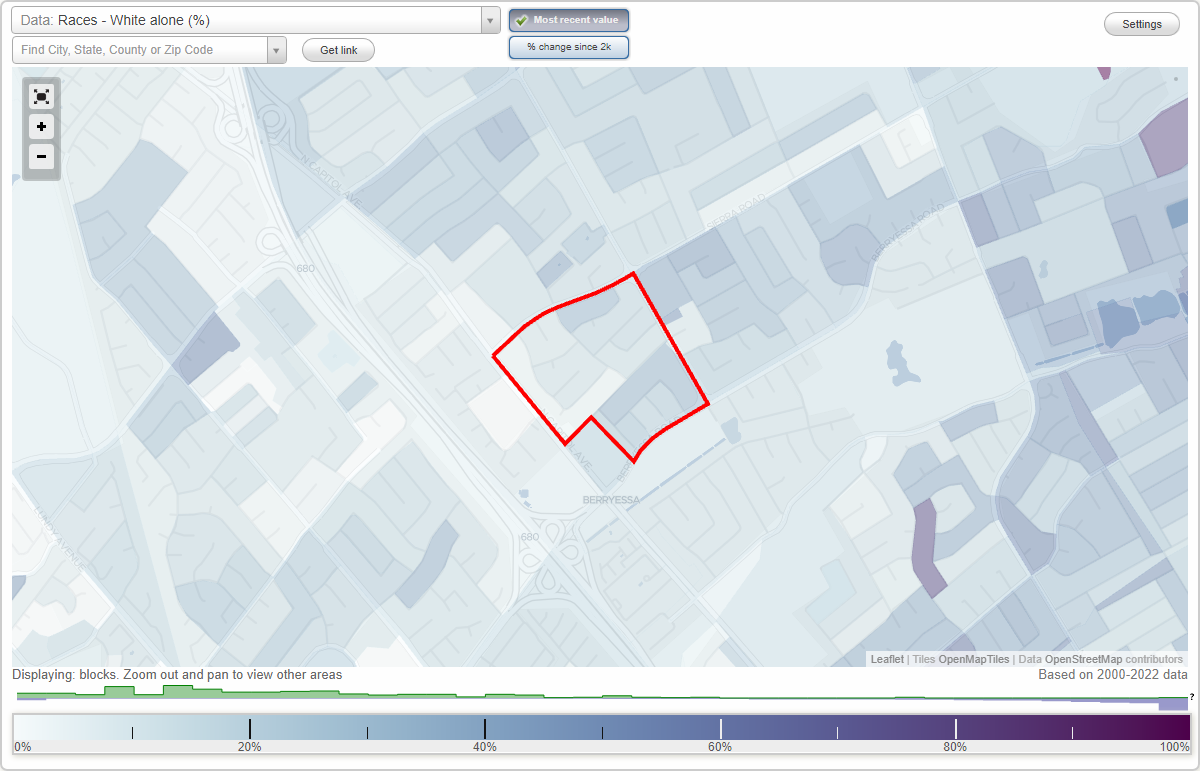
Area: 0.122 square miles
Population: 1,277
Population density:
| Ohlone: | 10,500 people per square mile |
| San Jose: | 5,554 people per square mile |

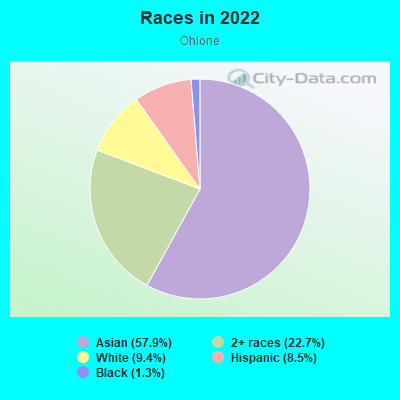
- 74057.9%Asian
- 29022.7%Two or more races
- 1209.4%White
- 1098.5%Hispanic or Latino
- 171.3%Black
- 10.08%Some other race
Median household income in 2022:
| Ohlone: | $158,549 |
| San Jose: | $133,835 |
Distribution of median household income
![Distribution of median household income]()
- 12Less than $10,000
- 25$10,000 to $19,999
- 19$20,000 to $29,999
- 14$30,000 to $39,999
- 12$40,000 to $49,999
- 10$50,000 to $59,999
- 23$60,000 to $74,999
- 13$75,000 to $99,999
- 33$100,000 to $124,999
- 12$125,000 to $149,999
- 122$150,000 to $199,999
- 158$200,000 or more

Distribution of owner-occupied house/condo value
![Distribution of owner-occupied house/condo value]()
- 6Less than $50,000
- 5$50,000 to $99,999
- 3$100,000 to $149,999
- 2$150,000 to $199,999
- 2$300,000 to $399,999
- 4$400,000 to $499,999
- 27$500,000 to $749,999
- 45$750,000 to $999,999
- 265$1,000,000 or more

Distribution of rent paid by renters
![Distribution of rent paid by renters]()
- 1$400 to $499
- 5$500 to $599
- 1$1,250 to $1,499
- 15$1,500 to $1,999
- 80$2,000 or more

Median rent in 2022:
| Ohlone: | $3,400 |
| San Jose: | $2,001 |
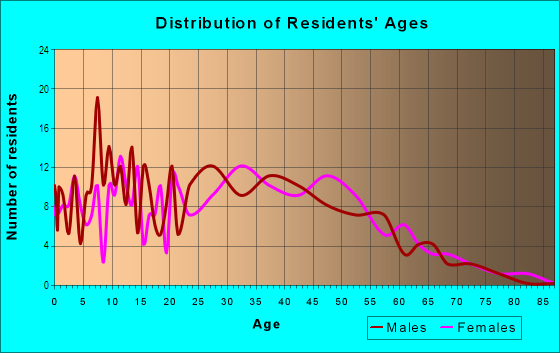
| Males: | 785 |
| Females: | 491 |
Males:
| This neighborhood: | 41.0 years |
| Whole city: | 37.6 years |
| This neighborhood: | 37.6 years |
| Whole city: | 39.1 years |
Average household size:
| Ohlone: | 14.2 people |
| San Jose: | 2.9 people |
Percentage of family households:
| Ohlone: | 44.7% |
| San Jose: | 49.9% |
| Here: | 76.4% |
| San Jose: | 53.0% |
Percentage of married-couple families with children (among all households):
| Ohlone: | 32.0% |
| San Jose: | 25.8% |
Percentage of single-mother households (among all households):
| Ohlone: | 0.2% |
| San Jose: | 5.2% |
Percentage of never married males 15 years old and over:
Percentage of never married females 15 years old and over:
| Ohlone: | 12.0% |
| San Jose: | 20.9% |
Percentage of never married females 15 years old and over:
| Ohlone: | 9.8% |
| city: | 16.7% |
Percentage of people that speak English not well or not at all:
| Ohlone: | 5.3% |
| San Jose: | 11.4% |
Percentage of people born in this state:
Percentage of people born in another U.S. state:
Percentage of native residents but born outside the U.S.:
Percentage of foreign born residents:
| Here: | 40.2% |
| San Jose: | 46.1% |
Percentage of people born in another U.S. state:
| Ohlone: | 3.3% |
| San Jose: | 10.4% |
Percentage of native residents but born outside the U.S.:
| Here: | 2.4% |
| city: | 1.7% |
Percentage of foreign born residents:
| Here: | 54.2% |
| San Jose: | 41.8% |
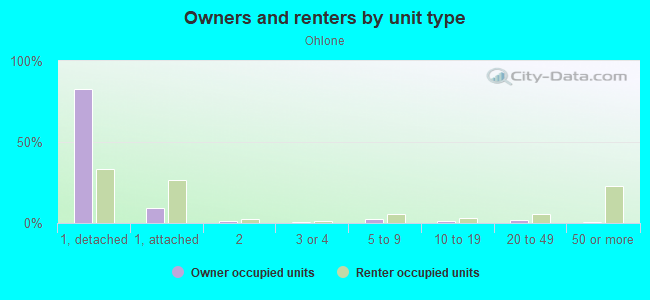
Owner-occupied
Renter-occupied

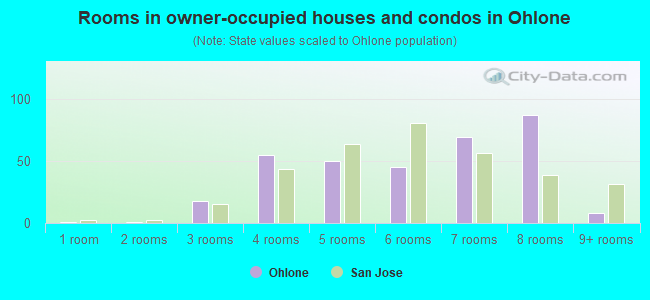
- Rooms in owner-occupied houses and condos in Ohlone
- 11 room
- 12 rooms
- 183 rooms
- 554 rooms
- 505 rooms
- 456 rooms
- 697 rooms
- 878 rooms
- 89+ rooms
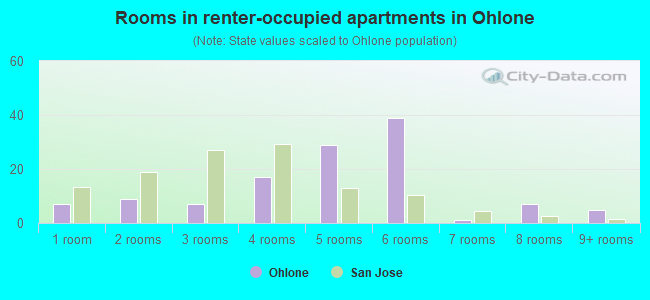
- Rooms in renter-occupied apartments in Ohlone
- 71 room
- 92 rooms
- 73 rooms
- 174 rooms
- 295 rooms
- 396 rooms
- 17 rooms
- 78 rooms
- 59+ rooms
Owner-occupied
Renter-occupied
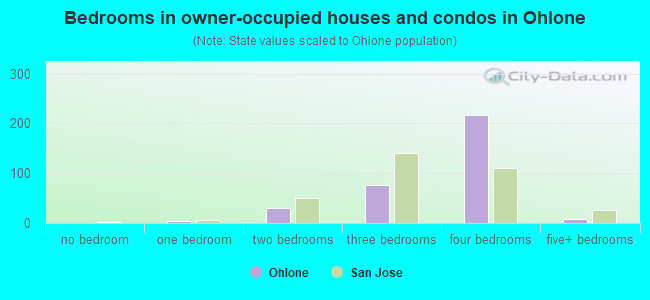
- Bedrooms in owner-occupied houses and condos in Ohlone
- 1no bedroom
- 41 bedroom
- 312 bedrooms
- 773 bedrooms
- 2174 bedrooms
- 85+ bedrooms
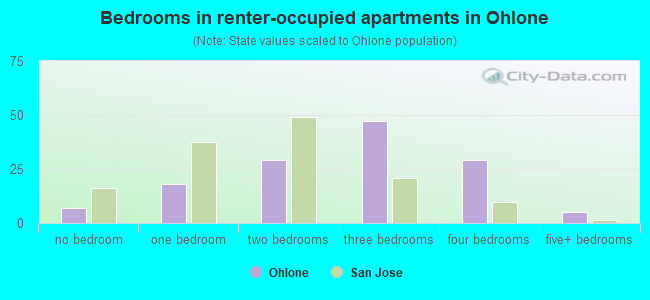
- Bedrooms in renter-occupied apartments in Ohlone
- 7no bedroom
- 181 bedroom
- 292 bedrooms
- 473 bedrooms
- 294 bedrooms
- 55+ bedrooms
Average number of cars or other vehicles available in houses/condos:
Average number of cars or other vehicles available in apartments:
| This neighborhood: | 2.5 |
| San Jose: | 2.3 |
Average number of cars or other vehicles available in apartments:
| Here: | 2.1 |
| city: | 1.6 |
Percentage of units with a mortgage:
| Ohlone: | 82.9% |
| San Jose: | 66.9% |
Housing prices:
- Average estimated value of detached houses in 2022 (76.3% of all units):
Ohlone: $1,250,633 San Jose: $1,532,815
- Average estimated value of townhouses or other attached units in 2022 (15.8% of all units):
This neighborhood: $974,254 city: $1,024,857
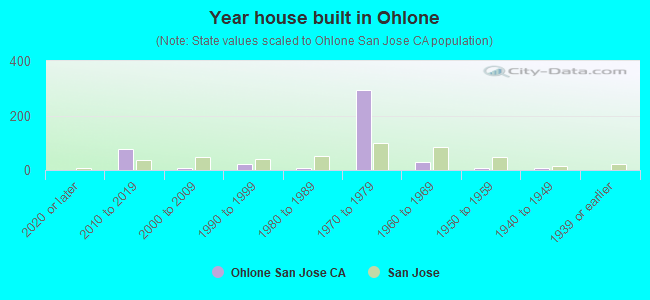
- Year house built in Ohlone
- 02020 or later
- 772010 to 2019
- 72000 to 2009
- 211990 to 1999
- 71980 to 1989
- 2931970 to 1979
- 291960 to 1969
- 71950 to 1959
- 91940 to 1949
- 11939 or earlier
City-data.com crime index for city in 2020 (higher means more crime):
| City: | 268.4 |
| U.S. average: | 219.5 |
Travel time to work (commute)
![Travel time to work (commute)]()
- 6Less than 5 minutes
- 125 to 9 minutes
- 6210 to 14 minutes
- 5315 to 19 minutes
- 10520 to 24 minutes
- 3725 to 29 minutes
- 8730 to 34 minutes
- 1535 to 39 minutes
- 440 to 44 minutes
- 5445 to 59 minutes
- 3360 to 89 minutes
- 1590 or more minutes

Means of transportation to work
![Means of transportation to work]()
- 63.1%380Drove a car alone
- 18.9%114Carpooled
- 3.5%21Bus
- 0.2%1Subway or elevated rail
- 1.2%7Light rail, streetcar or trolley
- 7.6%46Motorcycle
- 0.2%1Bicycle
- 1.7%10Other means
- 6.3%38Worked at home

Time leaving home to go to work
![Time leaving home to go to work]()
- 2512:00 a.m. to 4:59 a.m.
- 225:00 a.m. to 5:29 a.m.
- 185:30 a.m. to 5:59 a.m.
- 316:00 a.m. to 6:29 a.m.
- 376:30 a.m. to 6:59 a.m.
- 437:00 a.m. to 7:29 a.m.
- 207:30 a.m. to 7:59 a.m.
- 788:00 a.m. to 8:29 a.m.
- 418:30 a.m. to 8:59 a.m.
- 659:00 a.m. to 9:59 a.m.
- 2010:00 a.m. to 10:59 a.m.
- 1211:00 a.m. to 11:59 a.m.
- 3912:00 p.m. to 3:59 p.m.
- 164:00 p.m. to 11:59 p.m.

Occupations of males:
- Percentage of males in management occupations (except farmers):
Here: 3.6% city: 13.0%
- Percentage of males in business and financial operations occupations:
Here: 16.5% city: 4.6%
- Percentage of males in computer and mathematical occupations:
Here: 25.0% city: 13.6%
- Percentage of males in architecture and engineering occupations:
Here: 18.4% city: 10.2%
- Percentage of males in life, physical, and social science occupations:
Here: 2.2% city: 1.1%
- Percentage of males in legal occupations:
Here: 5.6% city: 0.8%
- Percentage of males in education, training, and library occupations:
Here: 1.5% city: 2.8%
- Percentage of males in service occupations:
Here: 9.6% city: 12.7%
- Percentage of males in sales and office occupations:
Here: 6.8% city: 12.8%
- Percentage of males in construction, extraction, and maintenance occupations:
Here: 4.4% city: 7.8%
- Percentage of males in production occupations:
Here: 4.4% city: 5.5%
- Percentage of males in transportation occupations:
Here: 1.5% city: 3.6%
Occupations of females:
- Percentage of females in management occupations (except farmers):
Here: 19.5% city: 11.0%
- Percentage of females in business and financial operations occupations:
Here: 9.4% city: 8.6%
- Percentage of females in computer and mathematical occupations:
Here: 4.6% city: 5.4%
- Percentage of females in architecture and engineering occupations:
Here: 5.9% city: 2.8%
- Percentage of females in life, physical, and social science occupations:
Here: 4.9% city: 1.7%
- Percentage of females in healthcare practitioners and technical occupations:
Here: 15.3% city: 6.8%
- Percentage of females in service occupations:
Here: 19.2% city: 21.7%
- Percentage of females in sales and office occupations:
Here: 10.7% city: 22.0%
- Percentage of females in production occupations:
Here: 4.3% city: 4.0%
- Percentage of females in material moving occupations:
Here: 6.2% city: 1.5%
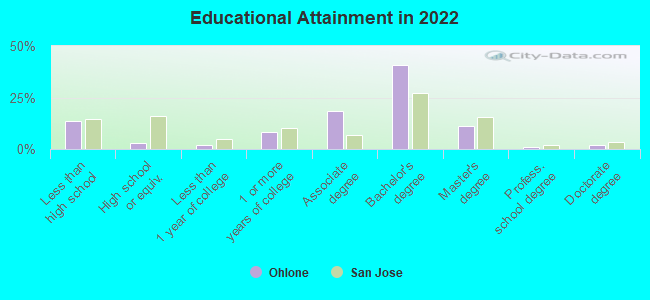
Education in this neighborhood (subdivision or community):
- Percentage of people 3 years and older in K-12 schools:
Ohlone: 8.7% San Jose: 16.1%
- Percentage of people 3 years and older in undergraduate colleges:
Ohlone: 2.8% San Jose: 6.5%
- Percentage of people 3 years and older in grad. or professional schools:
Ohlone: 1.3% San Jose: 2.0%
- Percentage of students K-12 enrolled in private schools:
Ohlone: 23.0% San Jose: 14.9%
Percentage of population below poverty level:
| Ohlone: | 5.9% |
| San Jose: | 9.0% |
Median year owner moved in (as recorded in 2022):
Median year renter moved in (as recorded in 2022):
| Ohlone: | 2008 |
| San Jose: | 2008 |
Median year renter moved in (as recorded in 2022):
| Ohlone: | 2015 |
| San Jose: | 2020 |
Percentage of married-couple families with both working:
| Ohlone: | 63.5% |
| San Jose: | 72.5% |
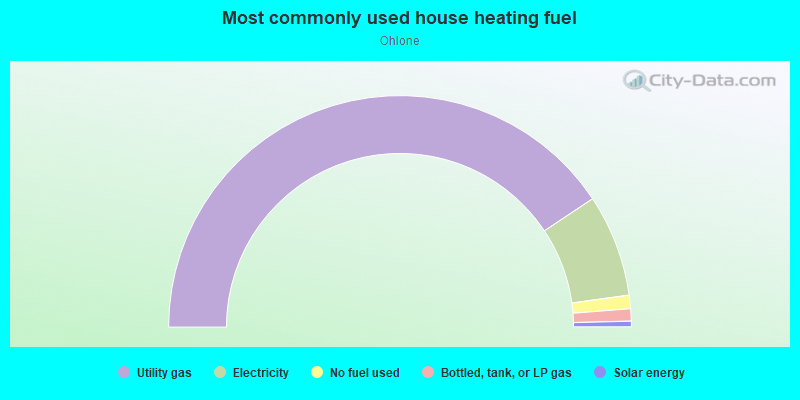
- 81.3%Utility gas
- 14.3%Electricity
- 1.9%No fuel used
- 1.7%Bottled, tank, or LP gas
- 0.8%Solar energy
Roads and streets:
Morrill Ave
Length: 0.32 miles
Directions: E-W, SE-NW, SW-NE
Address range: 1100 to 1284
Directions: E-W, SE-NW, SW-NE
Address range: 1100 to 1284
Amaryl Dr
Length: 0.31 miles
Directions: E-W, N-S, SE-NW, SW-NE
Address range: 2472 to 2699
Directions: E-W, N-S, SE-NW, SW-NE
Address range: 2472 to 2699
Flagstone Dr
Length: 0.28 miles
Directions: E-W, SE-NW, SW-NE
Address range: 2500 to 2699
Directions: E-W, SE-NW, SW-NE
Address range: 2500 to 2699
Ohlone Dr
Length: 0.27 miles
Directions: E-W, SW-NE
Address range: 2552 to 2799
Directions: E-W, SW-NE
Address range: 2552 to 2799
Berryessa Rd
Length: 0.23 miles
Direction: SW-NE
Address range: 2550 to 2699
Direction: SW-NE
Address range: 2550 to 2699
Lodestone Dr
Length: 0.20 miles
Directions: E-W, SE-NW
Address range: 1200 to 1259
Directions: E-W, SE-NW
Address range: 1200 to 1259
Peridot Pl
Length: 0.18 miles
Direction: SW-NE
Address range: 2600 to 2799
Direction: SW-NE
Address range: 2600 to 2799
Peridot Dr
Length: 0.18 miles
Directions: E-W, SE-NW, SW-NE
Address range: 2600 to 2799
Directions: E-W, SE-NW, SW-NE
Address range: 2600 to 2799
Sandstone Ln
Length: 0.16 miles
Direction: SE-NW
Address range: 1100 to 1199
Direction: SE-NW
Address range: 1100 to 1199
Pantalis Dr
Length: 0.15 miles
Directions: E-W, SW-NE
Address range: 2500 to 2599
Directions: E-W, SW-NE
Address range: 2500 to 2599
Amaryl Ct
Length: 0.09 miles
Direction: SW-NE
Address range: 2500 to 2599
Direction: SW-NE
Address range: 2500 to 2599
Keystone Ct
Length: 0.07 miles
Direction: SE-NW
Address range: 1100 to 1199
Direction: SE-NW
Address range: 1100 to 1199
Carlo Scimeca Dr
Length: 0.07 miles
Directions: E-W, SW-NE
Address range: 2600 to 2646
Directions: E-W, SW-NE
Address range: 2600 to 2646
Ironstone Ct
Length: 0.06 miles
Direction: SE-NW
Address range: 1100 to 1199
Direction: SE-NW
Address range: 1100 to 1199
Pantalis Ct
Length: 0.02 miles
Directions: N-S, SE-NW
Address range: 2500 to 2599
Directions: N-S, SE-NW
Address range: 2500 to 2599