Nyeland Acres neighborhood in Oxnard, California (CA), 93030 detailed profile
Settings
X

Business Search - 14 Million verified businesses
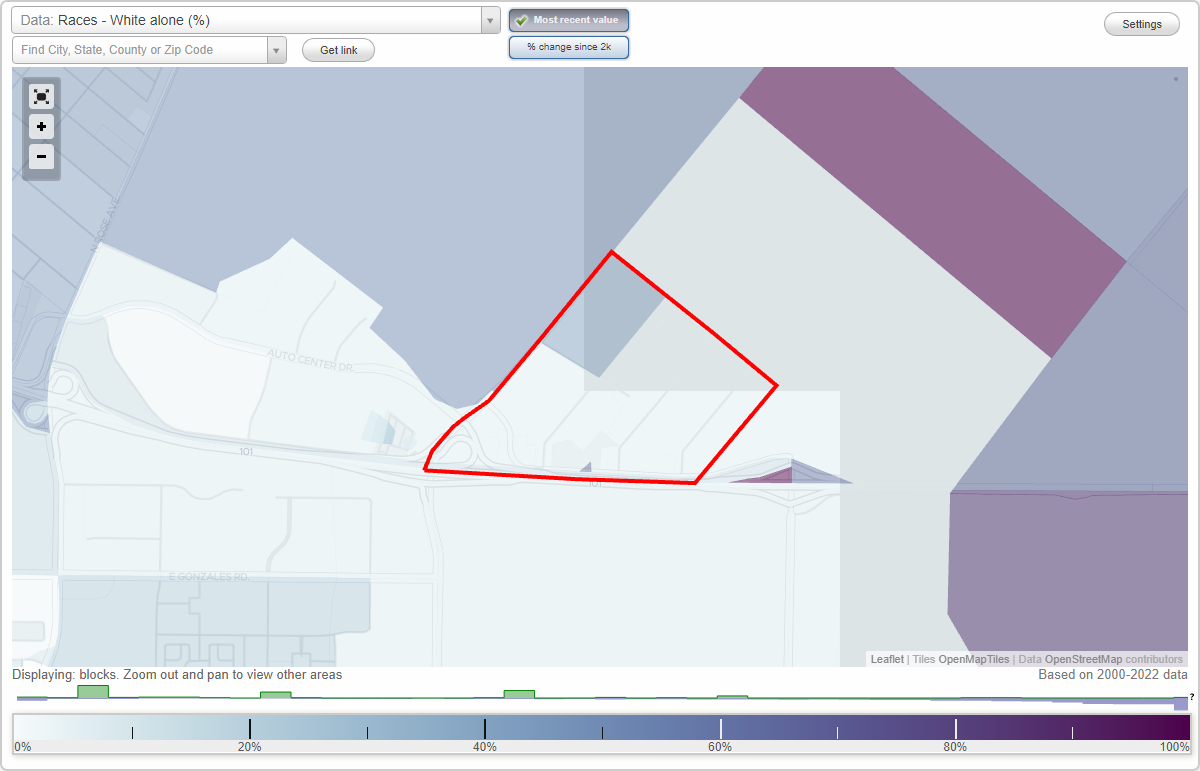
Area: 0.268 square miles
Population: 238
Population density:
| Nyeland Acres: | 889 people per square mile |
| Oxnard: | 7,918 people per square mile |

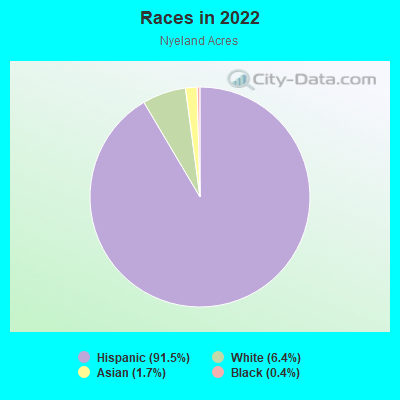
- 21691.5%Hispanic or Latino
- 156.4%White
- 41.7%Asian
- 10.4%Black
Median household income in 2022:
| Nyeland Acres: | $51,223 |
| Oxnard: | $84,941 |
Distribution of median household income
![Distribution of median household income]()
- 6$10,000 to $19,999
- 10$20,000 to $29,999
- 4$30,000 to $39,999
- 9$40,000 to $49,999
- 9$50,000 to $59,999
- 5$60,000 to $74,999
- 8$75,000 to $99,999
- 3$100,000 to $124,999
- 5$125,000 to $149,999
- 2$150,000 to $199,999
- 4$200,000 or more

Distribution of owner-occupied house/condo value
![Distribution of owner-occupied house/condo value]()
- 6Less than $50,000
- 3$50,000 to $99,999
- 2$100,000 to $149,999
- 1$150,000 to $199,999
- 6$400,000 to $499,999
- 5$500,000 to $749,999
- 2$750,000 to $999,999
- 4$1,000,000 or more

Distribution of rent paid by renters
![Distribution of rent paid by renters]()
- 2$100 to $199
- 2$500 to $599
- 3$800 to $899
- 8$1,000 to $1,249
- 5$1,250 to $1,499
- 7$1,500 to $1,999
- 8$2,000 or more

Median rent in 2022:
| Nyeland Acres: | $1,407 |
| Oxnard: | $1,876 |
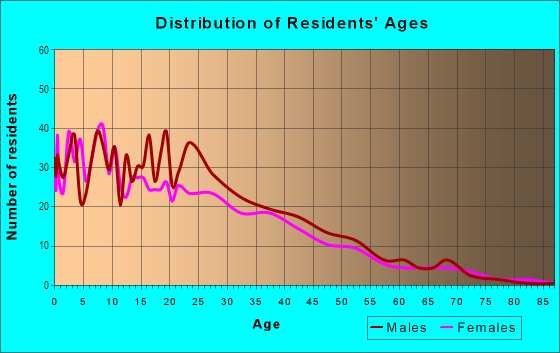
| Males: | 114 |
| Females: | 124 |
Males:
| This neighborhood: | 30.9 years |
| Whole city: | 35.1 years |
| This neighborhood: | 30.7 years |
| Whole city: | 34.3 years |
Average household size:
| Nyeland Acres: | 4.0 people |
| Oxnard: | 3.6 people |
Percentage of family households:
| Nyeland Acres: | 57.3% |
| Oxnard: | 51.5% |
| Here: | 47.3% |
| Oxnard: | 47.9% |
Percentage of married-couple families with children (among all households):
| Nyeland Acres: | 13.8% |
| Oxnard: | 16.4% |
Percentage of single-mother households (among all households):
| Nyeland Acres: | 10.6% |
| Oxnard: | 8.1% |
Percentage of never married males 15 years old and over:
Percentage of never married females 15 years old and over:
| Nyeland Acres: | 25.8% |
| Oxnard: | 22.9% |
Percentage of never married females 15 years old and over:
| Nyeland Acres: | 22.4% |
| city: | 20.1% |
Percentage of people that speak English not well or not at all:
| Nyeland Acres: | 28.4% |
| Oxnard: | 20.2% |
Percentage of people born in this state:
Percentage of people born in another U.S. state:
Percentage of native residents but born outside the U.S.:
Percentage of foreign born residents:
| Here: | 52.6% |
| Oxnard: | 58.8% |
Percentage of people born in another U.S. state:
| Nyeland Acres: | 6.2% |
| Oxnard: | 6.5% |
Percentage of native residents but born outside the U.S.:
| Here: | 0.4% |
| city: | 1.4% |
Percentage of foreign born residents:
| Here: | 40.8% |
| Oxnard: | 33.3% |
Owner-occupied
Renter-occupied

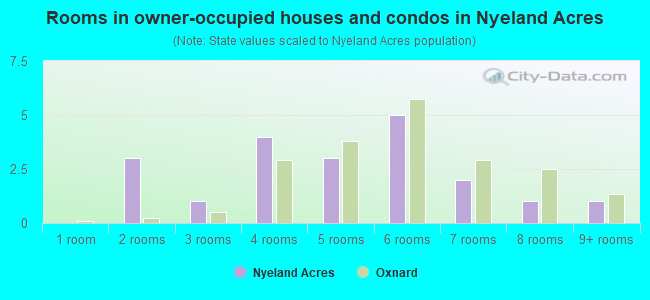
- Rooms in owner-occupied houses and condos in Nyeland Acres
- 01 room
- 32 rooms
- 13 rooms
- 44 rooms
- 35 rooms
- 56 rooms
- 27 rooms
- 18 rooms
- 19+ rooms
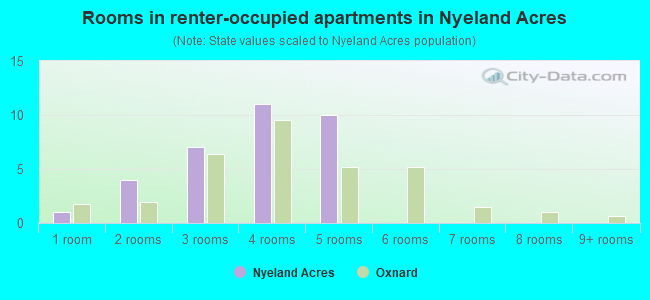
- Rooms in renter-occupied apartments in Nyeland Acres
- 11 room
- 42 rooms
- 73 rooms
- 114 rooms
- 105 rooms
- 06 rooms
- 07 rooms
- 08 rooms
- 09+ rooms
Owner-occupied
Renter-occupied
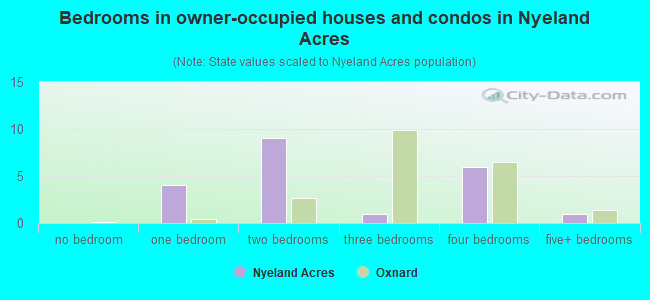
- Bedrooms in owner-occupied houses and condos in Nyeland Acres
- 0no bedroom
- 41 bedroom
- 92 bedrooms
- 13 bedrooms
- 64 bedrooms
- 15+ bedrooms
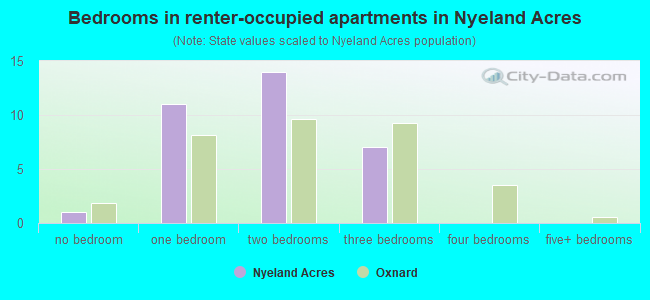
- Bedrooms in renter-occupied apartments in Nyeland Acres
- 1no bedroom
- 111 bedroom
- 142 bedrooms
- 73 bedrooms
- 04 bedrooms
- 05+ bedrooms
Average number of cars or other vehicles available in houses/condos:
Average number of cars or other vehicles available in apartments:
| This neighborhood: | 2.7 |
| Oxnard: | 2.5 |
Average number of cars or other vehicles available in apartments:
| Here: | 2.3 |
| city: | 1.9 |
Percentage of units with a mortgage:
| Nyeland Acres: | 42.4% |
| Oxnard: | 65.5% |
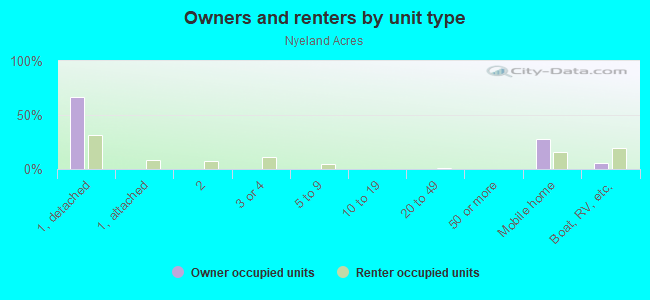
Housing prices:
- Average estimated value of detached houses in 2022 (45.9% of all units):
Nyeland Acres: $649,868 Oxnard: $645,968
- Average estimated value of mobile home in 2022 (21.3% of all units):
Nyeland Acres: $43,980 Oxnard: $168,523
- Average estimated value of boats, RVs, vans, etc. in 2022 (13.1% of all units):
This neighborhood: $29,518 city: $11,298
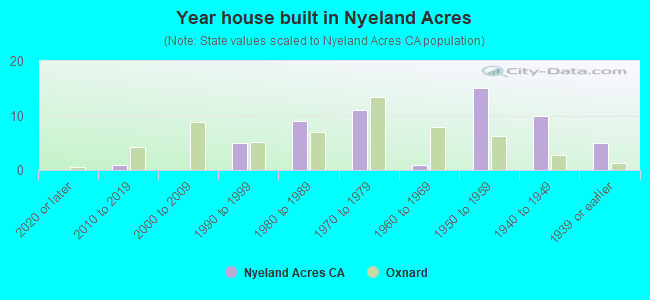
- Year house built in Nyeland Acres
- 02020 or later
- 12010 to 2019
- 02000 to 2009
- 51990 to 1999
- 91980 to 1989
- 111970 to 1979
- 11960 to 1969
- 151950 to 1959
- 101940 to 1949
- 51939 or earlier
City-data.com crime index for city in 2020 (higher means more crime):
| City: | 220.0 |
| U.S. average: | 219.5 |
Travel time to work (commute)
![Travel time to work (commute)]()
- 1110 to 14 minutes
- 1115 to 19 minutes
- 1220 to 24 minutes
- 4225 to 29 minutes
- 1230 to 34 minutes
- 135 to 39 minutes
- 245 to 59 minutes
- 160 to 89 minutes

Means of transportation to work
![Means of transportation to work]()
- 85.7%85Drove a car alone
- 10.1%10Carpooled
- 3.0%3Worked at home

Time leaving home to go to work
![Time leaving home to go to work]()
- 212:00 a.m. to 4:59 a.m.
- 85:00 a.m. to 5:29 a.m.
- 75:30 a.m. to 5:59 a.m.
- 196:00 a.m. to 6:29 a.m.
- 106:30 a.m. to 6:59 a.m.
- 127:00 a.m. to 7:29 a.m.
- 67:30 a.m. to 7:59 a.m.
- 68:00 a.m. to 8:29 a.m.
- 98:30 a.m. to 8:59 a.m.
- 39:00 a.m. to 9:59 a.m.
- 512:00 p.m. to 3:59 p.m.
- 24:00 p.m. to 11:59 p.m.

Occupations of males:
- Percentage of males in management occupations (except farmers):
Here: 3.4% city: 6.2%
- Percentage of males in business and financial operations occupations:
Here: 3.3% city: 2.6%
- Percentage of males in community and social services occupations:
Here: 2.5% city: 0.8%
- Percentage of males in service occupations:
Here: 24.7% city: 16.9%
- Percentage of males in sales and office occupations:
Here: 7.3% city: 11.7%
- Percentage of males in farming, fishing, and forestry occupations:
Here: 22.8% city: 14.1%
- Percentage of males in construction, extraction, and maintenance occupations:
Here: 19.8% city: 9.8%
- Percentage of males in production occupations:
Here: 4.8% city: 9.6%
- Percentage of males in transportation occupations:
Here: 2.2% city: 6.5%
- Percentage of males in material moving occupations:
Here: 4.4% city: 6.3%
Occupations of females:
- Percentage of females in management occupations (except farmers):
Here: 9.2% city: 6.3%
- Percentage of females in business and financial operations occupations:
Here: 11.3% city: 5.3%
- Percentage of females in arts, design, entertainment, sports, and media occupations:
Here: 1.0% city: 1.5%
- Percentage of females in service occupations:
Here: 18.7% city: 23.6%
- Percentage of females in sales and office occupations:
Here: 32.5% city: 27.3%
- Percentage of females in farming, fishing, and forestry occupations:
Here: 19.5% city: 8.0%
- Percentage of females in production occupations:
Here: 6.3% city: 6.8%
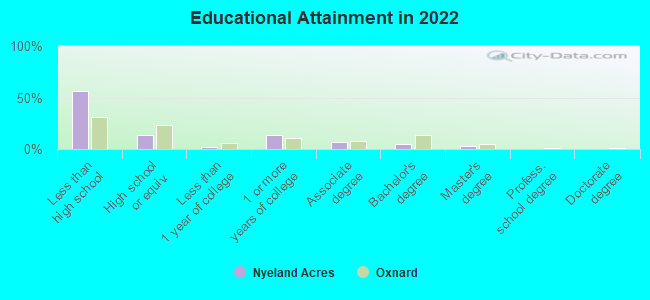
Education in this neighborhood (subdivision or community):
- Percentage of people 3 years and older in K-12 schools:
Nyeland Acres: 25.1% Oxnard: 21.0%
- Percentage of people 3 years and older in undergraduate colleges:
Nyeland Acres: 4.0% Oxnard: 5.2%
- Percentage of people 3 years and older in grad. or professional schools:
Nyeland Acres: 0.0% Oxnard: 0.8%
- Percentage of students K-12 enrolled in private schools:
Nyeland Acres: 0.0% Oxnard: 4.0%
Percentage of population below poverty level:
| Nyeland Acres: | 28.0% |
| Oxnard: | 12.8% |
Median year owner moved in (as recorded in 2022):
Median year renter moved in (as recorded in 2022):
| Nyeland Acres: | 2006 |
| Oxnard: | 2006 |
Median year renter moved in (as recorded in 2022):
| Nyeland Acres: | 2014 |
| Oxnard: | 2019 |
Percentage of married-couple families with both working:
| Nyeland Acres: | 38.8% |
| Oxnard: | 71.8% |
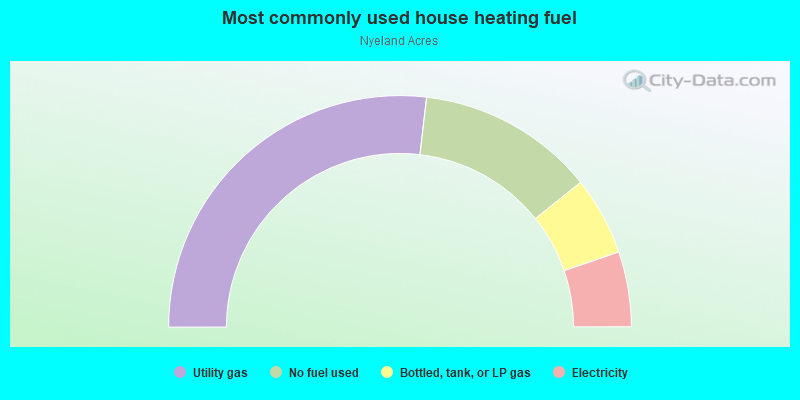
- 53.7%Utility gas
- 24.8%No fuel used
- 11.0%Bottled, tank, or LP gas
- 10.5%Electricity
Highways in this neighborhood:
el Camino Real (Ventura Fwy, US Hwy 101)
Length: 0.03 miles
Direction: E-W
Direction: E-W
Roads and streets:
Ventura Blvd
Length: 0.72 miles
Direction: E-W
Address range: 2500 to 3007
Direction: E-W
Address range: 2500 to 3007
Nyland Ave
Length: 0.57 miles
Directions: N-S, SW-NE
Address range: 3207 to 3799
Directions: N-S, SW-NE
Address range: 3207 to 3799
Orange Dr
Length: 0.45 miles
Directions: N-S, SW-NE
Address range: 3100 to 3613
Directions: N-S, SW-NE
Address range: 3100 to 3613
Friedrich Rd
Length: 0.39 miles
Direction: SE-NW
Address range: 2700 to 3199
Direction: SE-NW
Address range: 2700 to 3199
Almond Dr
Length: 0.35 miles
Directions: N-S, SW-NE
Address range: 3400 to 3898
Directions: N-S, SW-NE
Address range: 3400 to 3898
Santa Clara Ave
Length: 0.18 miles
Directions: E-W, N-S, SE-NW, SW-NE
Address range: 3100 to 3163
Directions: E-W, N-S, SE-NW, SW-NE
Address range: 3100 to 3163
Eucalyptus Dr
Length: 0.10 miles
Direction: SE-NW
Address range: 2700 to 2799
Direction: SE-NW
Address range: 2700 to 2799