Northlake neighborhood in San Jose, California (CA), 95117 detailed profile
Settings
X

Business Search - 14 Million verified businesses
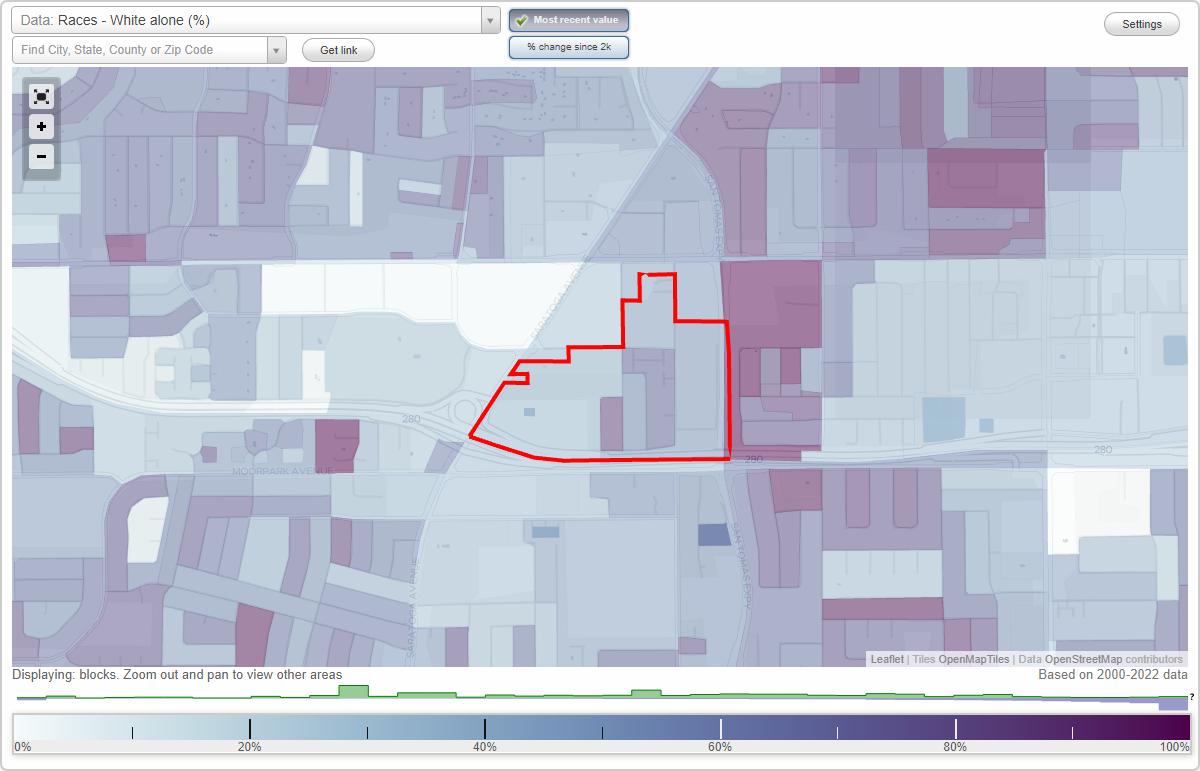
Area: 0.165 square miles
Population: 939
Population density:
| Northlake: | 5,676 people per square mile |
| San Jose: | 5,554 people per square mile |

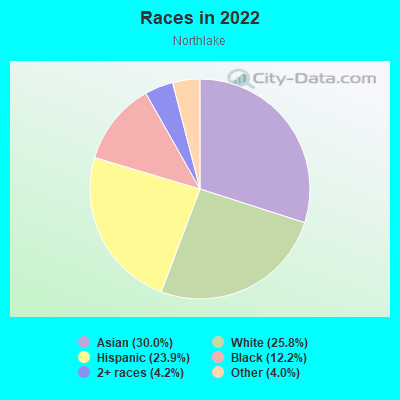
- 29330.0%Asian
- 25225.8%White
- 23423.9%Hispanic or Latino
- 11912.2%Black
- 414.2%Two or more races
- 394.0%Some other race
Median household income in 2022:
| Northlake: | $178,331 |
| San Jose: | $133,835 |
Distribution of median household income
![Distribution of median household income]()
- 2Less than $10,000
- 46$10,000 to $19,999
- 29$20,000 to $29,999
- 59$30,000 to $39,999
- 24$40,000 to $49,999
- 50$50,000 to $59,999
- 15$60,000 to $74,999
- 33$75,000 to $99,999
- 12$100,000 to $124,999
- 37$125,000 to $149,999
- 102$150,000 to $199,999
- 76$200,000 or more

Distribution of owner-occupied house/condo value
![Distribution of owner-occupied house/condo value]()
- 9Less than $50,000
- 3$50,000 to $99,999
- 8$100,000 to $149,999
- 3$150,000 to $199,999
- 18$200,000 to $249,999
- 3$300,000 to $399,999
- 10$400,000 to $499,999
- 3$500,000 to $749,999
- 13$750,000 to $999,999
- 142$1,000,000 or more

Distribution of rent paid by renters
![Distribution of rent paid by renters]()
- 9Less than $100
- 3$100 to $199
- 3$200 to $299
- 15$300 to $399
- 19$400 to $499
- 4$500 to $599
- 3$900 to $999
- 43$1,000 to $1,249
- 12$1,250 to $1,499
- 26$1,500 to $1,999
- 270$2,000 or more

Median rent in 2022:
| Northlake: | $2,557 |
| San Jose: | $2,001 |
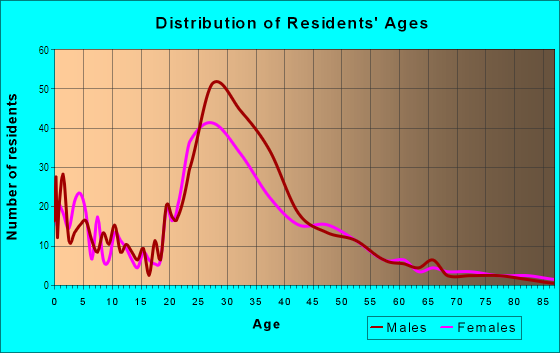
| Males: | 448 |
| Females: | 491 |
Males:
| This neighborhood: | 41.4 years |
| Whole city: | 37.6 years |
| This neighborhood: | 39.6 years |
| Whole city: | 39.1 years |
Average household size:
| Northlake: | 10.0 people |
| San Jose: | 2.9 people |
Percentage of family households:
| Northlake: | 40.7% |
| San Jose: | 49.9% |
| Here: | 38.5% |
| San Jose: | 53.0% |
Percentage of married-couple families with children (among all households):
| Northlake: | 23.9% |
| San Jose: | 25.8% |
Percentage of single-mother households (among all households):
| Northlake: | 14.6% |
| San Jose: | 5.2% |
Percentage of never married males 15 years old and over:
Percentage of never married females 15 years old and over:
| Northlake: | 27.8% |
| San Jose: | 20.9% |
Percentage of never married females 15 years old and over:
| Northlake: | 29.0% |
| city: | 16.7% |
Percentage of people that speak English not well or not at all:
| Northlake: | 10.1% |
| San Jose: | 11.4% |
Percentage of people born in this state:
Percentage of people born in another U.S. state:
Percentage of native residents but born outside the U.S.:
Percentage of foreign born residents:
| Here: | 50.9% |
| San Jose: | 46.1% |
Percentage of people born in another U.S. state:
| Northlake: | 17.7% |
| San Jose: | 10.4% |
Percentage of native residents but born outside the U.S.:
| Here: | 2.3% |
| city: | 1.7% |
Percentage of foreign born residents:
| Here: | 29.1% |
| San Jose: | 41.8% |
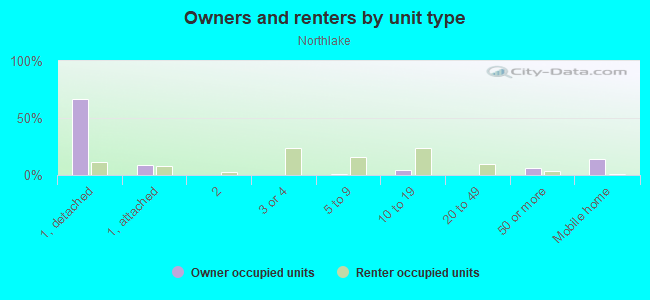
Owner-occupied
Renter-occupied

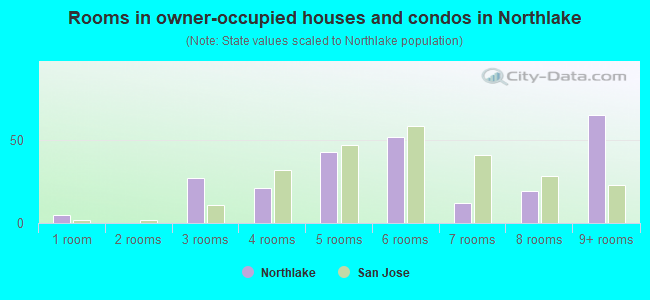
- Rooms in owner-occupied houses and condos in Northlake
- 51 room
- 02 rooms
- 273 rooms
- 214 rooms
- 435 rooms
- 526 rooms
- 127 rooms
- 198 rooms
- 659+ rooms
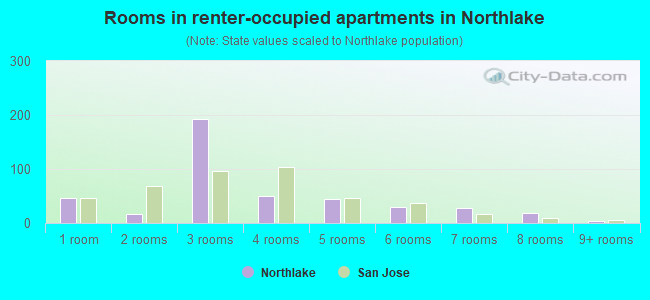
- Rooms in renter-occupied apartments in Northlake
- 471 room
- 172 rooms
- 1933 rooms
- 504 rooms
- 455 rooms
- 306 rooms
- 277 rooms
- 188 rooms
- 39+ rooms
Owner-occupied
Renter-occupied
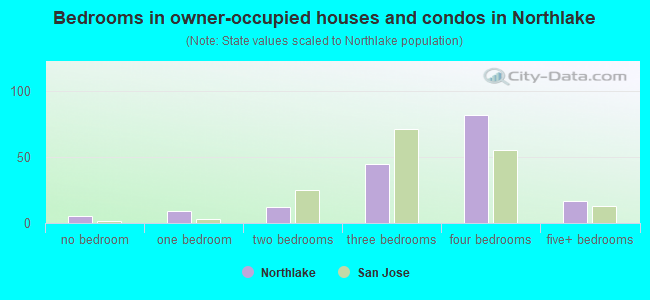
- Bedrooms in owner-occupied houses and condos in Northlake
- 5no bedroom
- 91 bedroom
- 122 bedrooms
- 453 bedrooms
- 824 bedrooms
- 175+ bedrooms
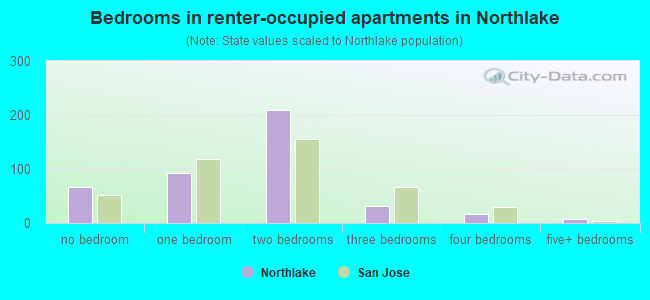
- Bedrooms in renter-occupied apartments in Northlake
- 66no bedroom
- 931 bedroom
- 2102 bedrooms
- 323 bedrooms
- 174 bedrooms
- 85+ bedrooms
Average number of cars or other vehicles available in houses/condos:
Average number of cars or other vehicles available in apartments:
| This neighborhood: | 5.0 |
| San Jose: | 2.3 |
Average number of cars or other vehicles available in apartments:
| Here: | 3.0 |
| city: | 1.6 |
Percentage of units with a mortgage:
| Northlake: | 44.8% |
| San Jose: | 66.9% |
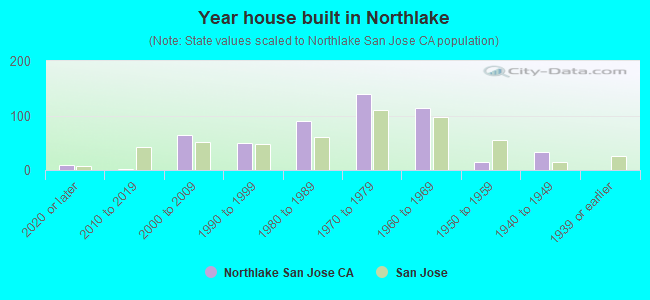
- Year house built in Northlake
- 92020 or later
- 22010 to 2019
- 652000 to 2009
- 491990 to 1999
- 891980 to 1989
- 1391970 to 1979
- 1141960 to 1969
- 141950 to 1959
- 331940 to 1949
- 01939 or earlier
City-data.com crime index for city in 2020 (higher means more crime):
| City: | 268.4 |
| U.S. average: | 219.5 |
Travel time to work (commute)
![Travel time to work (commute)]()
- 7Less than 5 minutes
- 295 to 9 minutes
- 8710 to 14 minutes
- 7215 to 19 minutes
- 7520 to 24 minutes
- 6125 to 29 minutes
- 3930 to 34 minutes
- 1135 to 39 minutes
- 1340 to 44 minutes
- 2145 to 59 minutes
- 1260 to 89 minutes
- 690 or more minutes

Means of transportation to work
![Means of transportation to work]()
- 68.2%469Drove a car alone
- 9.7%67Carpooled
- 1.5%10Bus
- 0.7%5Subway or elevated rail
- 1.5%10Long-distance train or commuter rail
- 1.0%7Motorcycle
- 1.3%9Bicycle
- 4.7%32Walked
- 1.2%8Other means
- 16.0%110Worked at home

Time leaving home to go to work
![Time leaving home to go to work]()
- 812:00 a.m. to 4:59 a.m.
- 55:00 a.m. to 5:29 a.m.
- 175:30 a.m. to 5:59 a.m.
- 516:00 a.m. to 6:29 a.m.
- 306:30 a.m. to 6:59 a.m.
- 447:00 a.m. to 7:29 a.m.
- 887:30 a.m. to 7:59 a.m.
- 548:00 a.m. to 8:29 a.m.
- 178:30 a.m. to 8:59 a.m.
- 539:00 a.m. to 9:59 a.m.
- 4410:00 a.m. to 10:59 a.m.
- 211:00 a.m. to 11:59 a.m.
- 812:00 p.m. to 3:59 p.m.
- 234:00 p.m. to 11:59 p.m.

Occupations of males:
- Percentage of males in management occupations (except farmers):
Here: 11.1% city: 13.0%
- Percentage of males in business and financial operations occupations:
Here: 11.8% city: 4.6%
- Percentage of males in computer and mathematical occupations:
Here: 16.6% city: 13.6%
- Percentage of males in architecture and engineering occupations:
Here: 6.2% city: 10.2%
- Percentage of males in legal occupations:
Here: 4.1% city: 0.8%
- Percentage of males in education, training, and library occupations:
Here: 3.1% city: 2.8%
- Percentage of males in healthcare practitioners and technical occupations:
Here: 3.2% city: 2.0%
- Percentage of males in service occupations:
Here: 28.8% city: 12.7%
- Percentage of males in material moving occupations:
Here: 9.9% city: 3.1%
Occupations of females:
- Percentage of females in management occupations (except farmers):
Here: 14.4% city: 11.0%
- Percentage of females in business and financial operations occupations:
Here: 24.3% city: 8.6%
- Percentage of females in healthcare practitioners and technical occupations:
Here: 15.9% city: 6.8%
- Percentage of females in service occupations:
Here: 17.1% city: 21.7%
- Percentage of females in sales and office occupations:
Here: 17.7% city: 22.0%
- Percentage of females in material moving occupations:
Here: 9.2% city: 1.5%
Percentage of people 16-64 in Armed Forces:
| Northlake: | 0.0% |
| San Jose: | 0.0% |
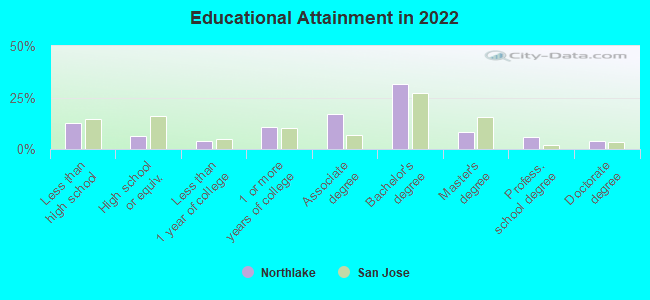
Education in this neighborhood (subdivision or community):
- Percentage of people 3 years and older in K-12 schools:
Northlake: 37.8% San Jose: 16.1%
- Percentage of people 3 years and older in undergraduate colleges:
Northlake: 7.7% San Jose: 6.5%
- Percentage of people 3 years and older in grad. or professional schools:
Northlake: 3.1% San Jose: 2.0%
- Percentage of students K-12 enrolled in private schools:
Northlake: 13.3% San Jose: 14.9%
Percentage of population below poverty level:
| Northlake: | 6.8% |
| San Jose: | 9.0% |
Median year renter moved in (as recorded in 2022):
| Northlake: | 2017 |
| San Jose: | 2020 |
Percentage of married-couple families with both working:
| Northlake: | 82.8% |
| San Jose: | 72.5% |
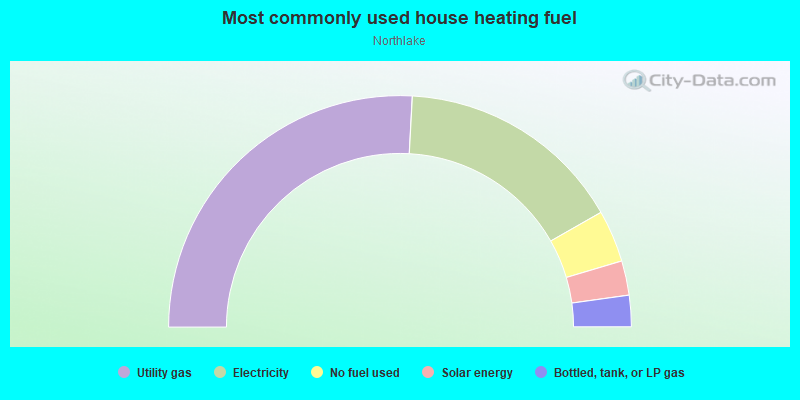
- 51.7%Utility gas
- 31.8%Electricity
- 7.3%No fuel used
- 4.8%Solar energy
- 4.4%Bottled, tank, or LP gas
Limited-access highways (interstate or state) in this neighborhood:
I- 280 (Junipero Serra Fwy)
Length: 0.58 miles
Direction: E-W
Direction: E-W
San Tomas Expy
Length: 0.18 miles
Direction: N-S
Direction: N-S
Roads and streets:
Greenlee Dr
Length: 0.32 miles
Directions: E-W, N-S, SE-NW, SW-NE
Address range: 3500 to 3699
Directions: E-W, N-S, SE-NW, SW-NE
Address range: 3500 to 3699
Akron Way
Length: 0.24 miles
Direction: E-W
Address range: 3700 to 3799
Direction: E-W
Address range: 3700 to 3799
Northlake Dr
Length: 0.24 miles
Direction: N-S
Address range: 400 to 599
Direction: N-S
Address range: 400 to 599
Boynton Ave
Length: 0.24 miles
Directions: E-W, N-S, SW-NE
Address range: 411 to 599
Directions: E-W, N-S, SW-NE
Address range: 411 to 599
Troy Dr
Length: 0.19 miles
Directions: E-W, N-S, SW-NE
Address range: 500 to 599
Directions: E-W, N-S, SW-NE
Address range: 500 to 599
Westlake Dr
Length: 0.18 miles
Directions: N-S, SE-NW
Address range: 400 to 599
Directions: N-S, SE-NW
Address range: 400 to 599
Kiely Blvd
Length: 0.16 miles
Direction: E-W
Address range: 519 to 550
Direction: E-W
Address range: 519 to 550
Trina Way
Length: 0.07 miles
Directions: E-W, SE-NW
Address range: 3700 to 3799
Directions: E-W, SE-NW
Address range: 3700 to 3799
Clardy Pl
Length: 0.06 miles
Directions: E-W, N-S
Address range: 500 to 599
Directions: E-W, N-S
Address range: 500 to 599
Victorian Pines Pl
Length: 0.02 miles
Direction: E-W
Address range: 3700 to 3799
Direction: E-W
Address range: 3700 to 3799
Phunglau Ct
Length: 0.01 miles
Direction: N-S
Direction: N-S