Northern Strip neighborhood in Las Vegas, Nevada (NV), 89102, 89104 detailed profile
Settings
X

Business Search - 14 Million verified businesses
Area: 0.394 square miles
Population: 3,801
Population density:
| Northern Strip: | 9,641 people per square mile |
| Las Vegas: | 5,792 people per square mile |

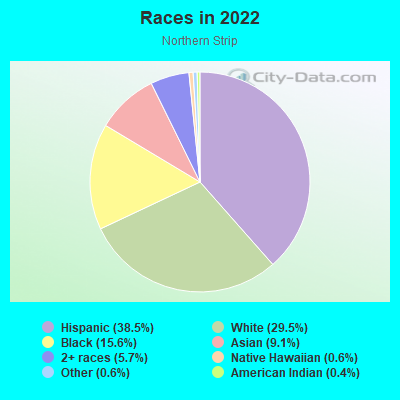
- 1,48038.5%Hispanic or Latino
- 1,13529.5%White
- 60115.6%Black
- 3519.1%Asian
- 2185.7%Two or more races
- 250.6%Native Hawaiian and Other
Pacific Islander - 230.6%Some other race
- 140.4%American Indian
Distribution of median household income
![Distribution of median household income]()
- 250Less than $10,000
- 768$10,000 to $19,999
- 185$20,000 to $29,999
- 110$30,000 to $39,999
- 163$40,000 to $49,999
- 122$50,000 to $59,999
- 93$60,000 to $74,999
- 216$75,000 to $99,999
- 220$100,000 to $124,999
- 82$125,000 to $149,999
- 64$150,000 to $199,999
- 228$200,000 or more

Distribution of owner-occupied house/condo value
![Distribution of owner-occupied house/condo value]()
- 74Less than $50,000
- 58$50,000 to $99,999
- 20$100,000 to $149,999
- 33$150,000 to $199,999
- 60$200,000 to $249,999
- 29$250,000 to $299,999
- 146$300,000 to $399,999
- 38$400,000 to $499,999
- 132$500,000 to $749,999
- 25$750,000 to $999,999
- 103$1,000,000 or more

Distribution of rent paid by renters
![Distribution of rent paid by renters]()
- 48Less than $100
- 403$100 to $199
- 118$200 to $299
- 129$300 to $399
- 89$400 to $499
- 277$500 to $599
- 354$600 to $699
- 215$700 to $799
- 157$800 to $899
- 31$900 to $999
- 133$1,000 to $1,249
- 190$1,250 to $1,499
- 285$1,500 to $1,999
- 172$2,000 or more

Median rent in 2022:
| Northern Strip: | $803 |
| Las Vegas: | $1,277 |
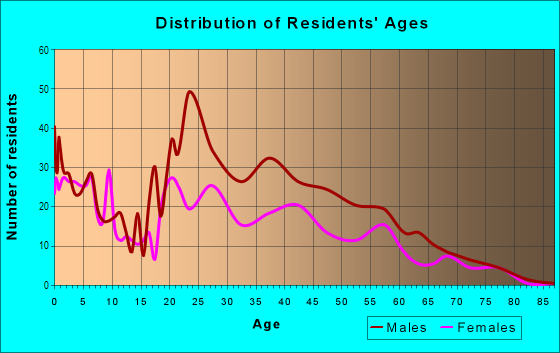
| Males: | 2,043 |
| Females: | 1,757 |
Males:
| This neighborhood: | 35.7 years |
| Whole city: | 38.4 years |
| This neighborhood: | 45.2 years |
| Whole city: | 38.9 years |
Average household size:
| Northern Strip: | 2.5 people |
| Las Vegas: | 2.7 people |
Percentage of family households:
| Northern Strip: | 21.1% |
| Las Vegas: | 45.8% |
| Here: | 17.0% |
| Las Vegas: | 40.9% |
Percentage of married-couple families with children (among all households):
| Northern Strip: | 33.7% |
| Las Vegas: | 23.4% |
Percentage of single-mother households (among all households):
| Northern Strip: | 18.1% |
| Las Vegas: | 10.1% |
Percentage of never married males 15 years old and over:
Percentage of never married females 15 years old and over:
| Northern Strip: | 30.0% |
| Las Vegas: | 19.7% |
Percentage of never married females 15 years old and over:
| Northern Strip: | 19.4% |
| city: | 17.0% |
Percentage of people that speak English not well or not at all:
| Northern Strip: | 17.3% |
| Las Vegas: | 7.0% |
Percentage of people born in this state:
Percentage of people born in another U.S. state:
Percentage of native residents but born outside the U.S.:
Percentage of foreign born residents:
| Here: | 19.2% |
| Las Vegas: | 27.3% |
Percentage of people born in another U.S. state:
| Northern Strip: | 43.8% |
| Las Vegas: | 49.8% |
Percentage of native residents but born outside the U.S.:
| Here: | 4.4% |
| city: | 1.9% |
Percentage of foreign born residents:
| Here: | 33.2% |
| Las Vegas: | 21.0% |
Owner-occupied
Renter-occupied

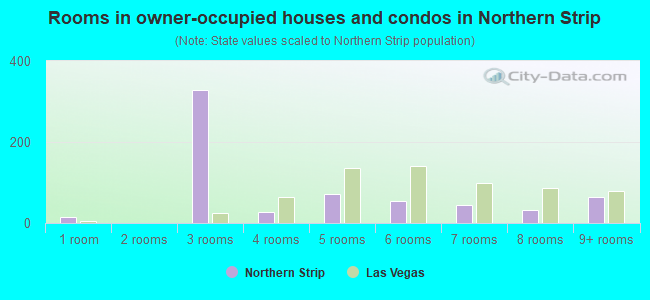
- Rooms in owner-occupied houses and condos in Northern Strip
- 141 room
- 02 rooms
- 3283 rooms
- 274 rooms
- 725 rooms
- 556 rooms
- 447 rooms
- 328 rooms
- 639+ rooms
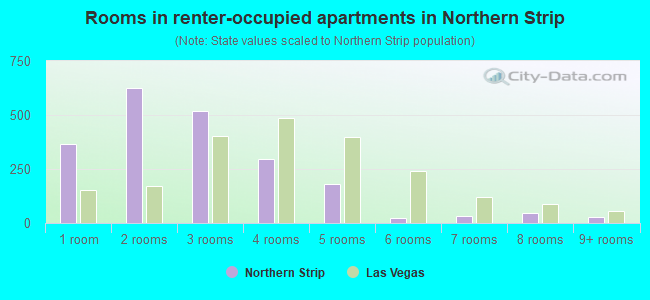
- Rooms in renter-occupied apartments in Northern Strip
- 3671 room
- 6272 rooms
- 5173 rooms
- 2964 rooms
- 1795 rooms
- 216 rooms
- 337 rooms
- 488 rooms
- 269+ rooms
Owner-occupied
Renter-occupied
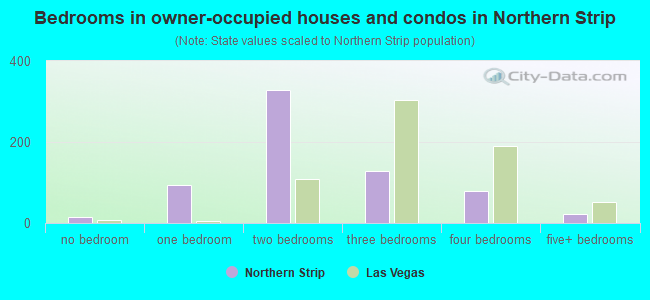
- Bedrooms in owner-occupied houses and condos in Northern Strip
- 14no bedroom
- 951 bedroom
- 3282 bedrooms
- 1293 bedrooms
- 794 bedrooms
- 225+ bedrooms
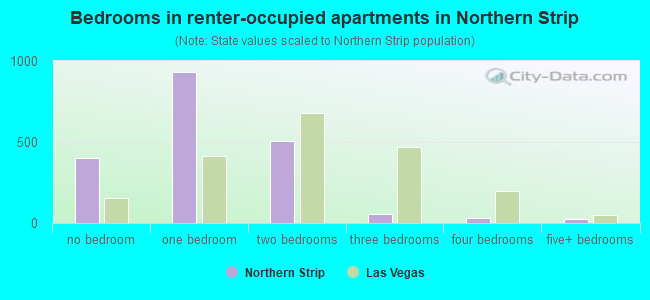
- Bedrooms in renter-occupied apartments in Northern Strip
- 403no bedroom
- 9341 bedroom
- 5042 bedrooms
- 563 bedrooms
- 334 bedrooms
- 265+ bedrooms
Average number of cars or other vehicles available in houses/condos:
Average number of cars or other vehicles available in apartments:
| This neighborhood: | |
| Las Vegas: |
Average number of cars or other vehicles available in apartments:
| Here: | 0.7 |
| city: | 1.3 |
Percentage of units with a mortgage:
| Northern Strip: | 77.7% |
| Las Vegas: | 69.3% |
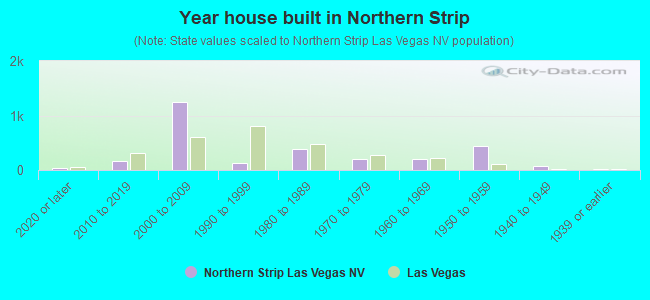
- Year house built in Northern Strip
- 352020 or later
- 1722010 to 2019
- 1,2422000 to 2009
- 1281990 to 1999
- 3911980 to 1989
- 2111970 to 1979
- 2031960 to 1969
- 4361950 to 1959
- 701940 to 1949
- 221939 or earlier
City-data.com crime index for city in 2020 (higher means more crime):
| City: | 280.7 |
| U.S. average: | 219.5 |
Travel time to work (commute)
![Travel time to work (commute)]()
- 43Less than 5 minutes
- 1835 to 9 minutes
- 17610 to 14 minutes
- 18915 to 19 minutes
- 31420 to 24 minutes
- 6825 to 29 minutes
- 8430 to 34 minutes
- 1935 to 39 minutes
- 2740 to 44 minutes
- 13845 to 59 minutes
- 2860 to 89 minutes
- 2190 or more minutes

Means of transportation to work
![Means of transportation to work]()
- 54.2%839Drove a car alone
- 14.3%222Carpooled
- 14.5%224Bus
- 1.1%17Subway or elevated rail
- 0.3%5Long-distance train or commuter rail
- 2.1%32Motorcycle
- 2.1%33Bicycle
- 7.7%119Walked
- 5.3%82Other means
- 14.9%231Worked at home

Time leaving home to go to work
![Time leaving home to go to work]()
- 12312:00 a.m. to 4:59 a.m.
- 855:00 a.m. to 5:29 a.m.
- 275:30 a.m. to 5:59 a.m.
- 746:00 a.m. to 6:29 a.m.
- 346:30 a.m. to 6:59 a.m.
- 1177:00 a.m. to 7:29 a.m.
- 527:30 a.m. to 7:59 a.m.
- 1518:00 a.m. to 8:29 a.m.
- 1158:30 a.m. to 8:59 a.m.
- 939:00 a.m. to 9:59 a.m.
- 8110:00 a.m. to 10:59 a.m.
- 811:00 a.m. to 11:59 a.m.
- 24912:00 p.m. to 3:59 p.m.
- 1074:00 p.m. to 11:59 p.m.

Occupations of males:
- Percentage of males in management occupations (except farmers):
Here: 18.3% city: 9.6%
- Percentage of males in business and financial operations occupations:
Here: 4.7% city: 3.6%
- Percentage of males in education, training, and library occupations:
Here: 1.1% city: 2.5%
- Percentage of males in arts, design, entertainment, sports, and media occupations:
Here: 3.4% city: 2.5%
- Percentage of males in healthcare practitioners and technical occupations:
Here: 1.1% city: 3.3%
- Percentage of males in service occupations:
Here: 21.9% city: 23.3%
- Percentage of males in sales and office occupations:
Here: 22.2% city: 16.6%
- Percentage of males in construction, extraction, and maintenance occupations:
Here: 5.6% city: 10.6%
- Percentage of males in production occupations:
Here: 2.4% city: 3.3%
- Percentage of males in transportation occupations:
Here: 8.8% city: 6.6%
- Percentage of males in material moving occupations:
Here: 7.1% city: 5.4%
Occupations of females:
- Percentage of females in management occupations (except farmers):
Here: 2.3% city: 8.5%
- Percentage of females in business and financial operations occupations:
Here: 2.8% city: 5.7%
- Percentage of females in education, training, and library occupations:
Here: 3.9% city: 8.0%
- Percentage of females in arts, design, entertainment, sports, and media occupations:
Here: 4.5% city: 1.8%
- Percentage of females in healthcare practitioners and technical occupations:
Here: 7.1% city: 7.4%
- Percentage of females in service occupations:
Here: 41.8% city: 26.5%
- Percentage of females in sales and office occupations:
Here: 26.2% city: 30.5%
- Percentage of females in production occupations:
Here: 3.7% city: 1.8%
- Percentage of females in material moving occupations:
Here: 6.1% city: 2.2%
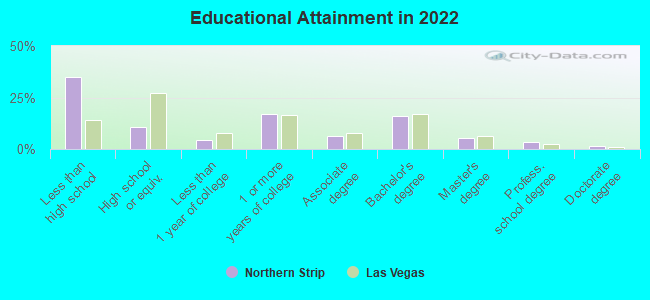
Education in this neighborhood (subdivision or community):
- Percentage of people 3 years and older in K-12 schools:
Northern Strip: 12.3% Las Vegas: 17.4%
- Percentage of people 3 years and older in undergraduate colleges:
Northern Strip: 5.3% Las Vegas: 4.2%
- Percentage of people 3 years and older in grad. or professional schools:
Northern Strip: 0.6% Las Vegas: 1.0%
- Percentage of students K-12 enrolled in private schools:
Northern Strip: 16.4% Las Vegas: 12.9%
Percentage of population below poverty level:
| Northern Strip: | 27.2% |
| Las Vegas: | 14.1% |
Median year renter moved in (as recorded in 2022):
| Northern Strip: | 2013 |
| Las Vegas: | 2020 |
Percentage of married-couple families with both working:
| Northern Strip: | 65.6% |
| Las Vegas: | 62.0% |
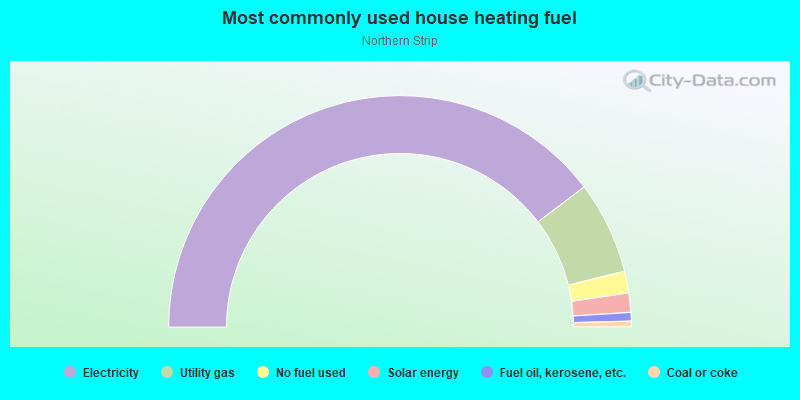
- 78.9%Electricity
- 12.9%Utility gas
- 3.0%No fuel used
- 2.7%Solar energy
- 1.2%Fuel oil, kerosene, etc.
- 0.8%Coal or coke
Highways in this neighborhood:
Las Vegas Blvd S (State Rte 604)
Length: 0.62 miles
Direction: SW-NE
Address range: 1600 to 2399
Direction: SW-NE
Address range: 1600 to 2399
Roads and streets:
Industrial Rd
Length: 0.70 miles
Direction: SW-NE
Address range: 1604 to 2499
Direction: SW-NE
Address range: 1604 to 2499
Fairfield Ave
Length: 0.57 miles
Directions: E-W, N-S, SE-NW, SW-NE
Address range: 1600 to 2399
Directions: E-W, N-S, SE-NW, SW-NE
Address range: 1600 to 2399
W Wyoming Ave
Length: 0.45 miles
Direction: E-W
Address range: 1 to 399
Direction: E-W
Address range: 1 to 399
Tam Dr
Length: 0.42 miles
Directions: E-W, N-S, SE-NW, SW-NE
Address range: 2100 to 2499
Directions: E-W, N-S, SE-NW, SW-NE
Address range: 2100 to 2499
W Cincinnati Ave
Length: 0.41 miles
Directions: E-W, SE-NW
Address range: 100 to 399
Directions: E-W, SE-NW
Address range: 100 to 399
W Cleveland Ave
Length: 0.41 miles
Directions: E-W, SE-NW
Address range: 100 to 399
Directions: E-W, SE-NW
Address range: 100 to 399
W Baltimore Ave
Length: 0.41 miles
Directions: E-W, SE-NW
Address range: 100 to 399
Directions: E-W, SE-NW
Address range: 100 to 399
W Chicago Ave
Length: 0.35 miles
Direction: E-W
Address range: 100 to 399
Direction: E-W
Address range: 100 to 399
W New York Ave
Length: 0.32 miles
Direction: E-W
Address range: 100 to 299
Direction: E-W
Address range: 100 to 299
W Philadelphia Ave
Length: 0.30 miles
Direction: E-W
Address range: 100 to 299
Direction: E-W
Address range: 100 to 299
W Sahara Ave
Length: 0.29 miles
Direction: E-W
Address range: 401 to 1399
Direction: E-W
Address range: 401 to 1399
S Main St
Length: 0.27 miles
Direction: N-S
Address range: 1600 to 1999
Direction: N-S
Address range: 1600 to 1999
W Saint Louis Ave
Length: 0.26 miles
Directions: E-W, SE-NW
Address range: 200 to 399
Directions: E-W, SE-NW
Address range: 200 to 399
W Boston Ave
Length: 0.25 miles
Directions: E-W, SE-NW
Address range: 200 to 399
Directions: E-W, SE-NW
Address range: 200 to 399
S Commerce St
Length: 0.22 miles
Direction: N-S
Address range: 1600 to 1899
Direction: N-S
Address range: 1600 to 1899
E Wyoming Ave
Length: 0.15 miles
Direction: E-W
Address range: 1 to 299
Direction: E-W
Address range: 1 to 299
E Oakey Blvd
Length: 0.11 miles
Direction: E-W
Address range: 1 to 499
Direction: E-W
Address range: 1 to 499
W Oakey Blvd
Length: 0.10 miles
Direction: E-W
Address range: 1 to 199
Direction: E-W
Address range: 1 to 199
Northbridge St
Length: 0.09 miles
Directions: E-W, SE-NW
Address range: 300 to 499
Directions: E-W, SE-NW
Address range: 300 to 499
Western Ave
Length: 0.08 miles
Direction: SW-NE
Address range: 1600 to 1831
Direction: SW-NE
Address range: 1600 to 1831
S Casino Center Blvd
Length: 0.06 miles
Direction: N-S
Address range: 1600 to 1699
Direction: N-S
Address range: 1600 to 1699
Railroad features:
Union Pacific RR
Length: 0.67 miles
Direction: SW-NE
Direction: SW-NE
Up RR
Length: 0.03 miles
Direction: SW-NE
Direction: SW-NE