North Wonderland neighborhood in Boulder, Colorado (CO), 80304 detailed profile
Settings
X


Business Search - 14 Million verified businesses
Area: 0.138 square miles
Population: 218
Population density:
| North Wonderland: | 1,583 people per square mile |
| Boulder: | 4,328 people per square mile |

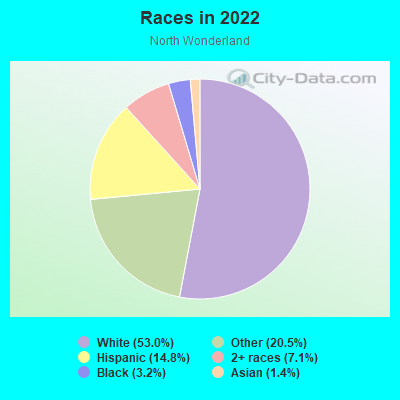
- 15053.0%White
- 5820.5%Some other race
- 4214.8%Hispanic or Latino
- 207.1%Two or more races
- 93.2%Black
- 41.4%Asian
Median household income in 2022:
| North Wonderland: | $104,524 |
| Boulder: | $81,608 |
Distribution of median household income
![Distribution of median household income]()
- 3Less than $10,000
- 53$10,000 to $19,999
- 86$20,000 to $29,999
- 7$30,000 to $39,999
- 95$40,000 to $49,999
- 3$50,000 to $59,999
- 4$60,000 to $74,999
- 7$75,000 to $99,999
- 6$100,000 to $124,999
- 5$125,000 to $149,999
- 10$150,000 to $199,999
- 41$200,000 or more

Distribution of owner-occupied house/condo value
![Distribution of owner-occupied house/condo value]()
- 131Less than $50,000
- 146$50,000 to $99,999
- 21$100,000 to $149,999
- 7$150,000 to $199,999
- 10$200,000 to $249,999
- 4$250,000 to $299,999
- 2$400,000 to $499,999
- 4$500,000 to $749,999
- 10$750,000 to $999,999
- 49$1,000,000 or more

Distribution of rent paid by renters
![Distribution of rent paid by renters]()
- 4$100 to $199
- 34$200 to $299
- 3$500 to $599
- 19$800 to $899
- 6$900 to $999
- 12$1,000 to $1,249
- 60$1,250 to $1,499
- 2$1,500 to $1,999
- 189$2,000 or more

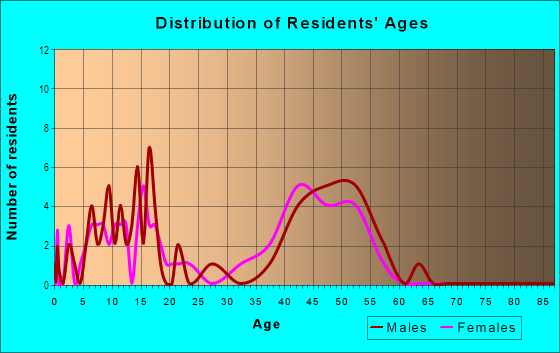
| Males: | 88 |
| Females: | 129 |
Males:
| This neighborhood: | 42.5 years |
| Whole city: | 28.3 years |
| This neighborhood: | 40.1 years |
| Whole city: | 29.2 years |
Average household size:
| North Wonderland: | 17.3 people |
| Boulder: | 2.1 people |
Percentage of family households:
| North Wonderland: | 30.0% |
| Boulder: | 26.9% |
| Here: | 48.5% |
| Boulder: | 30.4% |
Percentage of married-couple families with children (among all households):
| North Wonderland: | 30.7% |
| Boulder: | 32.8% |
Percentage of single-mother households (among all households):
| North Wonderland: | 89.4% |
| Boulder: | 6.3% |
Percentage of never married males 15 years old and over:
Percentage of never married females 15 years old and over:
| North Wonderland: | 12.3% |
| Boulder: | 32.7% |
Percentage of never married females 15 years old and over:
| North Wonderland: | 18.0% |
| city: | 28.3% |
Percentage of people that speak English not well or not at all:
| North Wonderland: | 2.0% |
| Boulder: | 1.0% |
Percentage of people born in this state:
Percentage of people born in another U.S. state:
Percentage of native residents but born outside the U.S.:
Percentage of foreign born residents:
| Here: | 24.1% |
| Boulder: | 28.3% |
Percentage of people born in another U.S. state:
| North Wonderland: | 60.7% |
| Boulder: | 60.5% |
Percentage of native residents but born outside the U.S.:
| Here: | 1.6% |
| city: | 2.1% |
Percentage of foreign born residents:
| Here: | 13.6% |
| Boulder: | 9.1% |
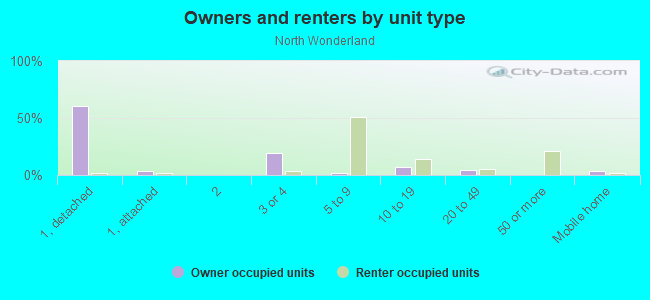
Owner-occupied
Renter-occupied

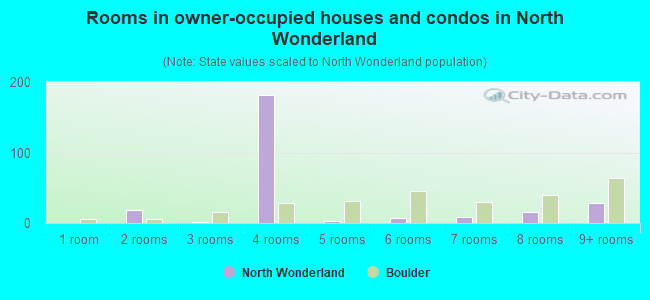
- Rooms in owner-occupied houses and condos in North Wonderland
- 01 room
- 182 rooms
- 23 rooms
- 1824 rooms
- 35 rooms
- 76 rooms
- 97 rooms
- 158 rooms
- 289+ rooms
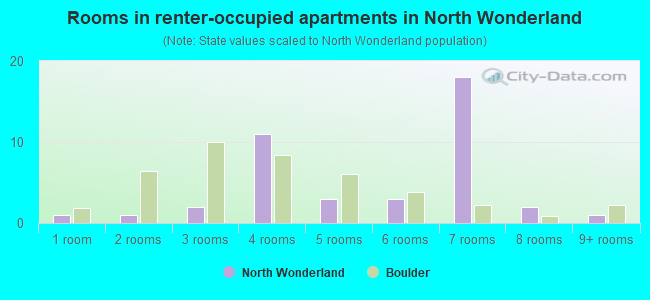
- Rooms in renter-occupied apartments in North Wonderland
- 11 room
- 12 rooms
- 23 rooms
- 114 rooms
- 35 rooms
- 36 rooms
- 187 rooms
- 28 rooms
- 19+ rooms
Owner-occupied
Renter-occupied
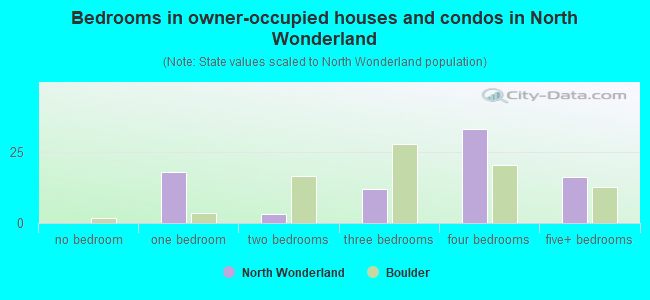
- Bedrooms in owner-occupied houses and condos in North Wonderland
- 0no bedroom
- 181 bedroom
- 32 bedrooms
- 123 bedrooms
- 334 bedrooms
- 165+ bedrooms
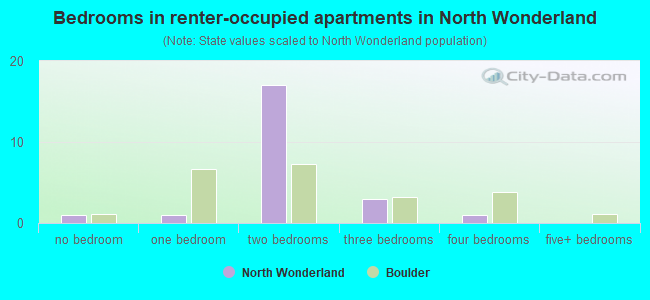
- Bedrooms in renter-occupied apartments in North Wonderland
- 1no bedroom
- 11 bedroom
- 172 bedrooms
- 33 bedrooms
- 14 bedrooms
- 05+ bedrooms
Average number of cars or other vehicles available in houses/condos:
Average number of cars or other vehicles available in apartments:
| This neighborhood: | 1.8 |
| Boulder: | 1.8 |
Average number of cars or other vehicles available in apartments:
| Here: | 0.7 |
| city: | 1.6 |
Percentage of units with a mortgage:
| North Wonderland: | 76.0% |
| Boulder: | 60.5% |
Housing prices:
- Average estimated value of detached houses in 2022 (65.3% of all units):
North Wonderland: $1,993,451 Boulder: $1,567,950
- Average estimated value of townhouses or other attached units in 2022 (7.9% of all units):
This neighborhood: $6,007,886 city: $729,034
- Average estimated '22 value of housing units in 3-to-4-unit structures (8.9% of all units):
North Wonderland: $424,181 city: $449,233
- Average estimated '22 value of housing units in 5-or-more-unit structures (57.4% of all units):
North Wonderland: $1,073,530 Boulder: $527,099
- Average estimated value of mobile home in 2022 (7.9% of all units):
North Wonderland: $596,672 Boulder: $38,736
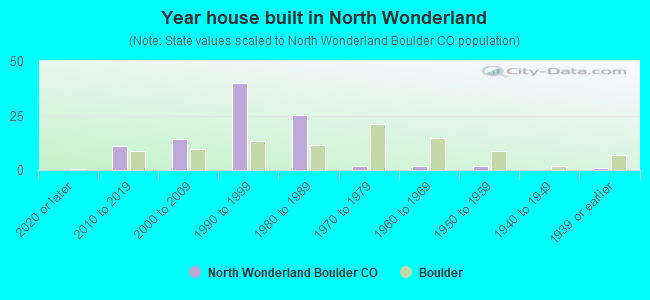
- Year house built in North Wonderland
- 02020 or later
- 112010 to 2019
- 142000 to 2009
- 401990 to 1999
- 251980 to 1989
- 21970 to 1979
- 21960 to 1969
- 21950 to 1959
- 01940 to 1949
- 11939 or earlier
City-data.com crime index for city in 2020 (higher means more crime):
| City: | 275.1 |
| U.S. average: | 219.5 |
Travel time to work (commute)
![Travel time to work (commute)]()
- 75 to 9 minutes
- 610 to 14 minutes
- 715 to 19 minutes
- 820 to 24 minutes
- 325 to 29 minutes
- 330 to 34 minutes
- 735 to 39 minutes
- 160 to 89 minutes
- 290 or more minutes

Means of transportation to work
![Means of transportation to work]()
- 34.2%33Drove a car alone
- 6.2%6Carpooled
- 7.3%7Bus
- 1.0%1Bicycle
- 16.6%16Walked
- 1.0%1Other means
- 47.7%46Worked at home

Time leaving home to go to work
![Time leaving home to go to work]()
- 25:00 a.m. to 5:29 a.m.
- 25:30 a.m. to 5:59 a.m.
- 26:00 a.m. to 6:29 a.m.
- 36:30 a.m. to 6:59 a.m.
- 57:00 a.m. to 7:29 a.m.
- 107:30 a.m. to 7:59 a.m.
- 68:00 a.m. to 8:29 a.m.
- 68:30 a.m. to 8:59 a.m.
- 109:00 a.m. to 9:59 a.m.
- 110:00 a.m. to 10:59 a.m.
- 1411:00 a.m. to 11:59 a.m.
- 112:00 p.m. to 3:59 p.m.
- 14:00 p.m. to 11:59 p.m.

Occupations of males:
- Percentage of males in management occupations (except farmers):
Here: 10.0% city: 12.9%
- Percentage of males in business and financial operations occupations:
Here: 8.6% city: 7.6%
- Percentage of males in computer and mathematical occupations:
Here: 5.3% city: 10.0%
- Percentage of males in architecture and engineering occupations:
Here: 2.1% city: 6.1%
- Percentage of males in legal occupations:
Here: 20.6% city: 2.1%
- Percentage of males in education, training, and library occupations:
Here: 5.1% city: 8.1%
- Percentage of males in arts, design, entertainment, sports, and media occupations:
Here: 11.3% city: 3.3%
- Percentage of males in healthcare practitioners and technical occupations:
Here: 12.0% city: 1.9%
- Percentage of males in service occupations:
Here: 5.3% city: 14.4%
- Percentage of males in sales and office occupations:
Here: 8.6% city: 14.5%
- Percentage of males in construction, extraction, and maintenance occupations:
Here: 6.2% city: 2.8%
Occupations of females:
- Percentage of females in management occupations (except farmers):
Here: 12.7% city: 8.8%
- Percentage of females in business and financial operations occupations:
Here: 2.7% city: 6.4%
- Percentage of females in architecture and engineering occupations:
Here: 4.4% city: 1.9%
- Percentage of females in life, physical, and social science occupations:
Here: 4.3% city: 4.7%
- Percentage of females in community and social services occupations:
Here: 7.4% city: 2.1%
- Percentage of females in legal occupations:
Here: 8.3% city: 1.4%
- Percentage of females in education, training, and library occupations:
Here: 14.3% city: 13.1%
- Percentage of females in arts, design, entertainment, sports, and media occupations:
Here: 2.8% city: 5.5%
- Percentage of females in healthcare practitioners and technical occupations:
Here: 3.1% city: 7.2%
- Percentage of females in service occupations:
Here: 31.0% city: 20.9%
- Percentage of females in sales and office occupations:
Here: 9.1% city: 19.4%
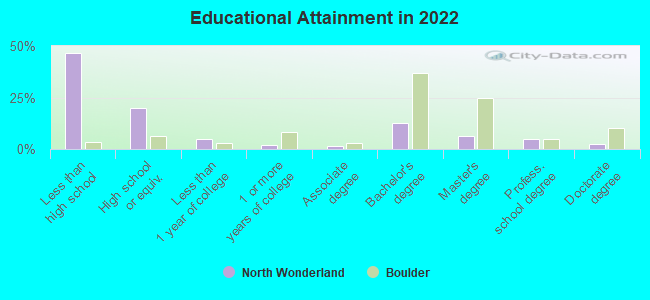
Education in this neighborhood (subdivision or community):
- Percentage of people 3 years and older in K-12 schools:
North Wonderland: 22.8% Boulder: 8.8%
- Percentage of people 3 years and older in undergraduate colleges:
North Wonderland: 16.5% Boulder: 28.2%
- Percentage of people 3 years and older in grad. or professional schools:
North Wonderland: 13.1% Boulder: 6.1%
- Percentage of students K-12 enrolled in private schools:
North Wonderland: 31.9% Boulder: 8.5%
Percentage of population below poverty level:
| North Wonderland: | 5.3% |
| Boulder: | 24.1% |
Median year owner moved in (as recorded in 2022):
Median year renter moved in (as recorded in 2022):
| North Wonderland: | 2011 |
| Boulder: | 2012 |
Median year renter moved in (as recorded in 2022):
| North Wonderland: | 2017 |
| Boulder: | 2022 |
Percentage of married-couple families with both working:
| North Wonderland: | 74.8% |
| Boulder: | 76.2% |
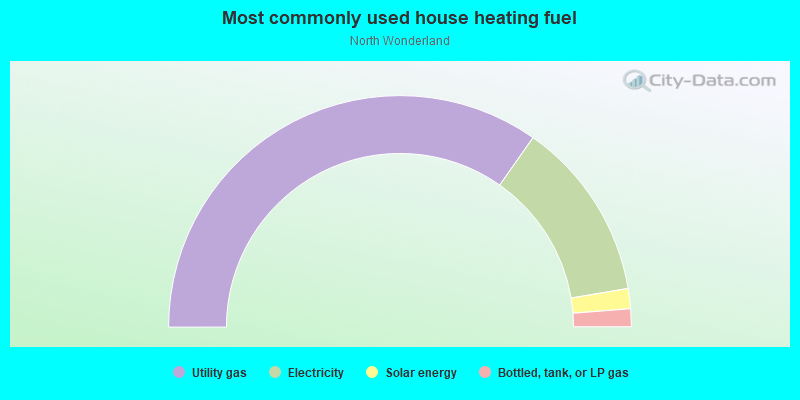
- 69.5%Utility gas
- 25.2%Electricity
- 2.8%Solar energy
- 2.5%Bottled, tank, or LP gas
Highways in this neighborhood:
Broadway St (State Hwy 7)
Length: 0.08 miles
Direction: N-S
Address range: 4178 to 4265
Direction: N-S
Address range: 4178 to 4265
Roads and streets:
Utica Ave
Length: 0.69 miles
Directions: E-W, N-S, SE-NW, SW-NE
Address range: 401 to 1199
Directions: E-W, N-S, SE-NW, SW-NE
Address range: 401 to 1199
Union Ave
Length: 0.56 miles
Direction: E-W
Address range: 500 to 1199
Direction: E-W
Address range: 500 to 1199
Locust Ave
Length: 0.36 miles
Directions: E-W, SW-NE
Address range: 500 to 1087
Directions: E-W, SW-NE
Address range: 500 to 1087
6th St
Length: 0.20 miles
Directions: E-W, N-S, SE-NW, SW-NE
Address range: 4300 to 4399
Directions: E-W, N-S, SE-NW, SW-NE
Address range: 4300 to 4399
Utica Cir
Length: 0.18 miles
Directions: E-W, N-S, SE-NW, SW-NE
Address range: 900 to 1199
Directions: E-W, N-S, SE-NW, SW-NE
Address range: 900 to 1199
Violet Ave
Length: 0.16 miles
Direction: E-W
Address range: 999 to 1199
Direction: E-W
Address range: 999 to 1199
9th St
Length: 0.16 miles
Directions: N-S, SW-NE
Address range: 4300 to 4399
Directions: N-S, SW-NE
Address range: 4300 to 4399
Utica Ct
Length: 0.12 miles
Directions: E-W, N-S, SE-NW, SW-NE
Address range: 500 to 599
Directions: E-W, N-S, SE-NW, SW-NE
Address range: 500 to 599
Cottage Ln
Length: 0.12 miles
Directions: E-W, N-S, SE-NW
Address range: 734 to 772
Directions: E-W, N-S, SE-NW
Address range: 734 to 772
Locust Pl
Length: 0.10 miles
Directions: E-W, SE-NW
Address range: 459 to 599
Directions: E-W, SE-NW
Address range: 459 to 599
Snowberry Cir
Length: 0.06 miles
Direction: N-S
Address range: 4313 to 4399
Direction: N-S
Address range: 4313 to 4399
Cherry Ave
Length: 0.06 miles
Directions: E-W, N-S, SW-NE
Directions: E-W, N-S, SW-NE
Other features:
Silver Lake Ditch
Length: 0.27 miles
Directions: E-W, N-S, SE-NW, SW-NE
Directions: E-W, N-S, SE-NW, SW-NE