North Side Homes neighborhood in Tampa, Florida (FL), 33612 detailed profile
Settings
X


Business Search - 14 Million verified businesses
Area: 0.084 square miles
Population: 459
Population density:
| North Side Homes: | 5,440 people per square mile |
| Tampa: | 3,553 people per square mile |

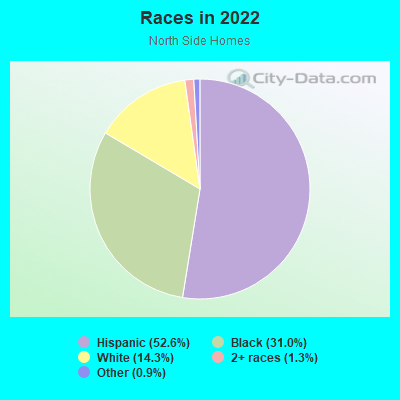
- 24352.6%Hispanic or Latino
- 14331.0%Black
- 6614.3%White
- 61.3%Two or more races
- 40.9%Some other race
Median household income in 2022:
| North Side Homes: | $55,639 |
| Tampa: | $71,089 |
Distribution of median household income
![Distribution of median household income]()
- 15Less than $10,000
- 15$10,000 to $19,999
- 41$20,000 to $29,999
- 5$30,000 to $39,999
- 13$40,000 to $49,999
- 23$50,000 to $59,999
- 19$60,000 to $74,999
- 31$75,000 to $99,999
- 11$100,000 to $124,999
- 4$150,000 to $199,999

Distribution of owner-occupied house/condo value
![Distribution of owner-occupied house/condo value]()
- 11Less than $50,000
- 7$50,000 to $99,999
- 12$100,000 to $149,999
- 9$150,000 to $199,999
- 30$200,000 to $249,999
- 10$250,000 to $299,999
- 10$300,000 to $399,999

Distribution of rent paid by renters
![Distribution of rent paid by renters]()
- 11$400 to $499
- 8$500 to $599
- 3$600 to $699
- 8$700 to $799
- 4$800 to $899
- 19$900 to $999
- 23$1,000 to $1,249
- 13$1,250 to $1,499
- 7$1,500 to $1,999
- 4$2,000 or more

Median rent in 2022:
| North Side Homes: | $1,083 |
| Tampa: | $1,444 |
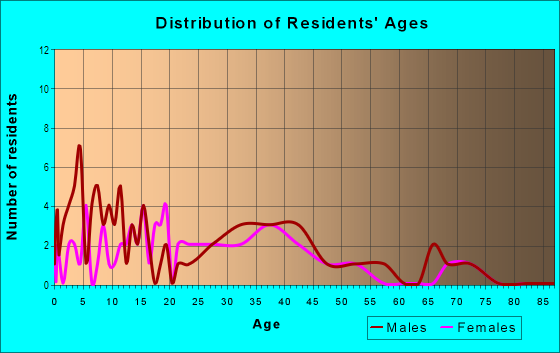
| Males: | 225 |
| Females: | 234 |
Males:
| This neighborhood: | 28.6 years |
| Whole city: | 35.5 years |
| This neighborhood: | 32.4 years |
| Whole city: | 35.1 years |
Average household size:
| North Side Homes: | 3.6 people |
| Tampa: | 2.3 people |
Percentage of family households:
| North Side Homes: | 60.1% |
| Tampa: | 39.9% |
| Here: | 49.1% |
| Tampa: | 35.4% |
Percentage of married-couple families with children (among all households):
| North Side Homes: | 19.3% |
| Tampa: | 25.1% |
Percentage of single-mother households (among all households):
| North Side Homes: | 8.2% |
| Tampa: | 12.2% |
Percentage of never married males 15 years old and over:
Percentage of never married females 15 years old and over:
| North Side Homes: | 26.3% |
| Tampa: | 23.6% |
Percentage of never married females 15 years old and over:
| North Side Homes: | 28.1% |
| city: | 20.9% |
Percentage of people that speak English not well or not at all:
| North Side Homes: | 21.2% |
| Tampa: | 6.4% |
Percentage of people born in this state:
Percentage of people born in another U.S. state:
Percentage of native residents but born outside the U.S.:
Percentage of foreign born residents:
| Here: | 30.0% |
| Tampa: | 39.7% |
Percentage of people born in another U.S. state:
| North Side Homes: | 26.3% |
| Tampa: | 35.7% |
Percentage of native residents but born outside the U.S.:
| Here: | 5.4% |
| city: | 4.6% |
Percentage of foreign born residents:
| Here: | 38.3% |
| Tampa: | 20.0% |
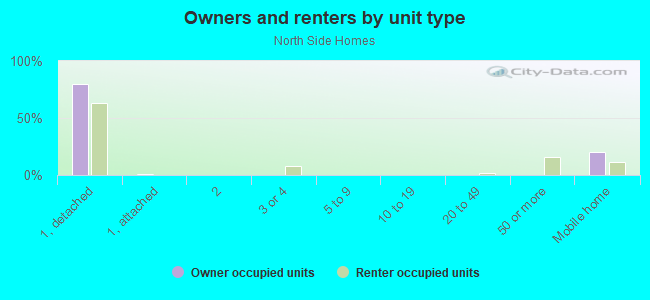
Owner-occupied
Renter-occupied

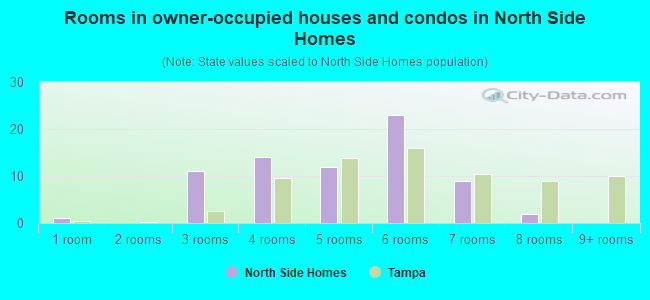
- Rooms in owner-occupied houses and condos in North Side Homes
- 11 room
- 02 rooms
- 113 rooms
- 144 rooms
- 125 rooms
- 236 rooms
- 97 rooms
- 28 rooms
- 09+ rooms
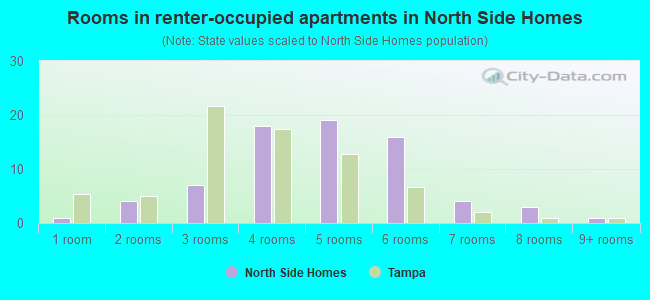
- Rooms in renter-occupied apartments in North Side Homes
- 11 room
- 42 rooms
- 73 rooms
- 184 rooms
- 195 rooms
- 166 rooms
- 47 rooms
- 38 rooms
- 19+ rooms
Owner-occupied
Renter-occupied
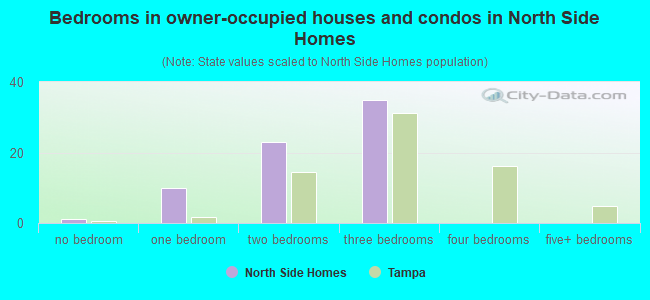
- Bedrooms in owner-occupied houses and condos in North Side Homes
- 1no bedroom
- 101 bedroom
- 232 bedrooms
- 353 bedrooms
- 04 bedrooms
- 05+ bedrooms
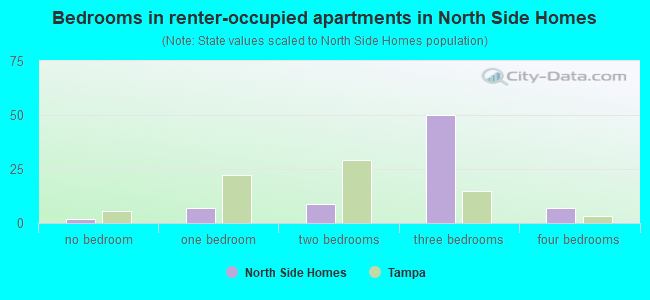
- Bedrooms in renter-occupied apartments in North Side Homes
- 2no bedroom
- 71 bedroom
- 92 bedrooms
- 503 bedrooms
- 74 bedrooms
- 05+ bedrooms
Average number of cars or other vehicles available in houses/condos:
Average number of cars or other vehicles available in apartments:
| This neighborhood: | 1.5 |
| Tampa: | 1.9 |
Average number of cars or other vehicles available in apartments:
| Here: | 1.4 |
| city: | 1.3 |
Percentage of units with a mortgage:
| North Side Homes: | 20.4% |
| Tampa: | 65.8% |
Average estimated value of detached houses in 2022 (89.7% of all units):
| North Side Homes: | $235,150 |
| Tampa: | $505,567 |
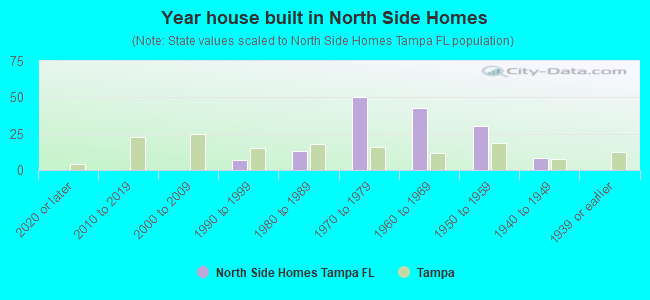
- Year house built in North Side Homes
- 02020 or later
- 02010 to 2019
- 02000 to 2009
- 71990 to 1999
- 131980 to 1989
- 501970 to 1979
- 431960 to 1969
- 301950 to 1959
- 81940 to 1949
- 01939 or earlier
City-data.com crime index for city in 2020 (higher means more crime):
| City: | 212.7 |
| U.S. average: | 219.5 |
Travel time to work (commute)
![Travel time to work (commute)]()
- 2Less than 5 minutes
- 95 to 9 minutes
- 810 to 14 minutes
- 1215 to 19 minutes
- 1320 to 24 minutes
- 2225 to 29 minutes
- 5030 to 34 minutes
- 135 to 39 minutes
- 540 to 44 minutes
- 3345 to 59 minutes
- 3160 to 89 minutes
- 290 or more minutes

Means of transportation to work
![Means of transportation to work]()
- 63.8%132Drove a car alone
- 30.4%63Carpooled
- 5.3%11Bus
- 1.0%2Walked
- 4.3%9Worked at home

Time leaving home to go to work
![Time leaving home to go to work]()
- 312:00 a.m. to 4:59 a.m.
- 115:00 a.m. to 5:29 a.m.
- 135:30 a.m. to 5:59 a.m.
- 126:00 a.m. to 6:29 a.m.
- 46:30 a.m. to 6:59 a.m.
- 417:00 a.m. to 7:29 a.m.
- 117:30 a.m. to 7:59 a.m.
- 78:00 a.m. to 8:29 a.m.
- 49:00 a.m. to 9:59 a.m.
- 210:00 a.m. to 10:59 a.m.
- 5212:00 p.m. to 3:59 p.m.
- 154:00 p.m. to 11:59 p.m.

Occupations of males:
- Percentage of males in legal occupations:
Here: 2.3% city: 2.8%
- Percentage of males in education, training, and library occupations:
Here: 2.6% city: 2.2%
- Percentage of males in arts, design, entertainment, sports, and media occupations:
Here: 1.5% city: 2.5%
- Percentage of males in service occupations:
Here: 26.6% city: 13.7%
- Percentage of males in sales and office occupations:
Here: 17.3% city: 16.3%
- Percentage of males in construction, extraction, and maintenance occupations:
Here: 57.6% city: 8.2%
- Percentage of males in production occupations:
Here: 25.5% city: 3.7%
- Percentage of males in transportation occupations:
Here: 8.1% city: 5.8%
- Percentage of males in material moving occupations:
Here: 6.7% city: 3.8%
Occupations of females:
- Percentage of females in management occupations (except farmers):
Here: 2.3% city: 10.9%
- Percentage of females in education, training, and library occupations:
Here: 7.0% city: 7.2%
- Percentage of females in healthcare practitioners and technical occupations:
Here: 20.5% city: 10.3%
- Percentage of females in service occupations:
Here: 42.0% city: 19.1%
- Percentage of females in sales and office occupations:
Here: 13.7% city: 27.1%
- Percentage of females in construction, extraction, and maintenance occupations:
Here: 13.7% city: 0.8%
- Percentage of females in production occupations:
Here: 10.2% city: 2.0%
- Percentage of females in material moving occupations:
Here: 1.9% city: 1.4%
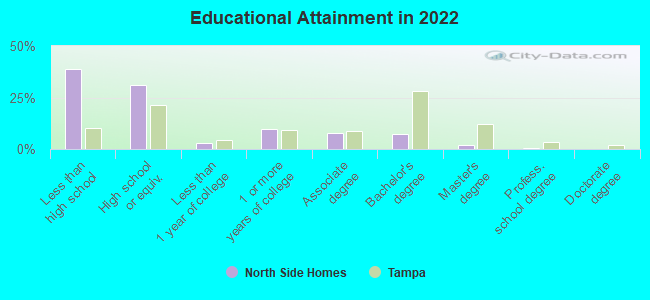
Education in this neighborhood (subdivision or community):
- Percentage of people 3 years and older in K-12 schools:
North Side Homes: 23.3% Tampa: 14.3%
- Percentage of people 3 years and older in undergraduate colleges:
North Side Homes: 4.8% Tampa: 7.8%
- Percentage of people 3 years and older in grad. or professional schools:
North Side Homes: 0.0% Tampa: 2.0%
- Percentage of students K-12 enrolled in private schools:
North Side Homes: 3.9% Tampa: 12.5%
Percentage of population below poverty level:
| North Side Homes: | 30.8% |
| Tampa: | 16.3% |
Median year owner moved in (as recorded in 2022):
Median year renter moved in (as recorded in 2022):
| North Side Homes: | 2013 |
| Tampa: | 2013 |
Median year renter moved in (as recorded in 2022):
| North Side Homes: | 2017 |
| Tampa: | 2020 |
Percentage of married-couple families with both working:
| North Side Homes: | 56.2% |
| Tampa: | 70.4% |
Electricity used as house heating fuel (%):
| North Side Homes: | 100.0% |
| Tampa: | 91.7% |
Limited-access highways (interstate or state) in this neighborhood:
State Hwy 93 (I- 275)
Length: 0.28 miles
Direction: N-S
Direction: N-S
Roads and streets:
N Taliaferro Ave
Length: 0.32 miles
Direction: N-S
Address range: 9300 to 9902
Direction: N-S
Address range: 9300 to 9902
Castle Ct N
Length: 0.08 miles
Direction: E-W
Address range: 700 to 799
Direction: E-W
Address range: 700 to 799
Castle Ct S
Length: 0.08 miles
Direction: E-W
Address range: 700 to 799
Direction: E-W
Address range: 700 to 799
E Lotus Ave
Length: 0.08 miles
Direction: E-W
Address range: 600 to 799
Direction: E-W
Address range: 600 to 799
E Annie St
Length: 0.07 miles
Direction: E-W
Address range: 700 to 799
Direction: E-W
Address range: 700 to 799
Orchid Ave
Length: 0.07 miles
Direction: E-W
Address range: 700 to 799
Direction: E-W
Address range: 700 to 799
Richmere St E
Length: 0.05 miles
Direction: E-W
Address range: 700 to 799
Direction: E-W
Address range: 700 to 799
E Wilma St
Length: 0.04 miles
Direction: E-W
Address range: 700 to 799
Direction: E-W
Address range: 700 to 799