North Campus neighborhood in San Jose, California (CA), 95112 detailed profile
Settings
X

Business Search - 14 Million verified businesses
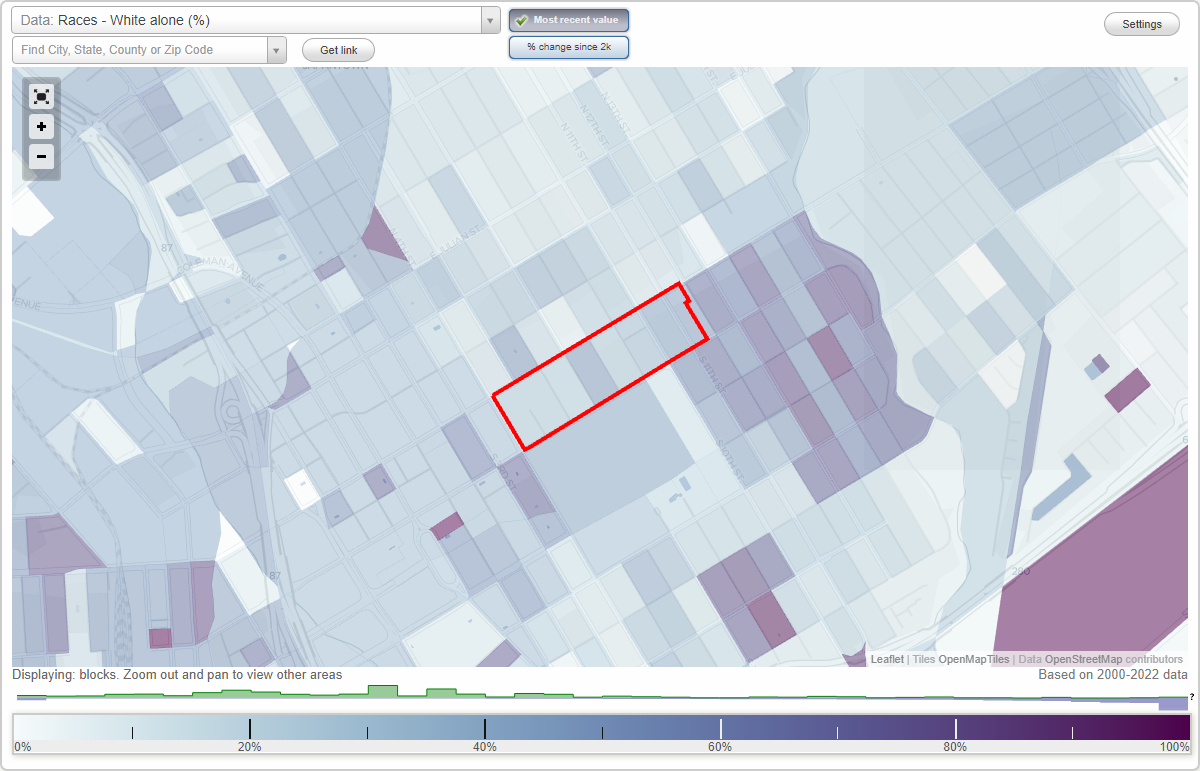
Area: 0.075 square miles
Population: 698
Population density:
| North Campus: | 9,332 people per square mile |
| San Jose: | 5,554 people per square mile |

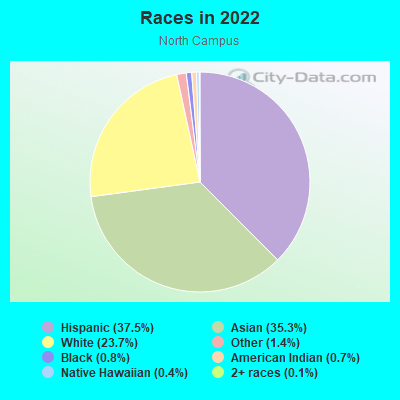
- 26837.5%Hispanic or Latino
- 25235.3%Asian
- 16923.7%White
- 101.4%Some other race
- 60.8%Black
- 50.7%American Indian
- 30.4%Native Hawaiian and Other
Pacific Islander - 10.1%Two or more races
Distribution of median household income
![Distribution of median household income]()
- 45Less than $10,000
- 91$10,000 to $19,999
- 19$20,000 to $29,999
- 20$30,000 to $39,999
- 17$40,000 to $49,999
- 22$50,000 to $59,999
- 41$60,000 to $74,999
- 28$75,000 to $99,999
- 6$100,000 to $124,999
- 16$125,000 to $149,999
- 4$150,000 to $199,999
- 7$200,000 or more

Distribution of owner-occupied house/condo value
![Distribution of owner-occupied house/condo value]()
- 24$200,000 to $249,999
- 10$400,000 to $499,999
- 4$500,000 to $749,999
- 21$750,000 to $999,999
- 68$1,000,000 or more

Distribution of rent paid by renters
![Distribution of rent paid by renters]()
- 30Less than $100
- 5$100 to $199
- 44$200 to $299
- 45$300 to $399
- 16$400 to $499
- 97$500 to $599
- 10$600 to $699
- 60$700 to $799
- 49$800 to $899
- 32$900 to $999
- 84$1,000 to $1,249
- 6$1,250 to $1,499
- 48$1,500 to $1,999
- 79$2,000 or more

| Males: | 439 |
| Females: | 259 |
Males:
| This neighborhood: | 31.3 years |
| Whole city: | 37.6 years |
| This neighborhood: | 31.9 years |
| Whole city: | 39.1 years |
Average household size:
| North Campus: | 2.5 people |
| San Jose: | 2.9 people |
Percentage of family households:
| North Campus: | 12.2% |
| San Jose: | 49.9% |
| Here: | 9.0% |
| San Jose: | 53.0% |
Percentage of married-couple families with children (among all households):
| North Campus: | 35.4% |
| San Jose: | 25.8% |
Percentage of single-mother households (among all households):
| North Campus: | 8.7% |
| San Jose: | 5.2% |
Percentage of never married males 15 years old and over:
Percentage of never married females 15 years old and over:
| North Campus: | 46.3% |
| San Jose: | 20.9% |
Percentage of never married females 15 years old and over:
| North Campus: | 15.6% |
| city: | 16.7% |
Percentage of people that speak English not well or not at all:
| North Campus: | 9.2% |
| San Jose: | 11.4% |
Percentage of people born in this state:
Percentage of people born in another U.S. state:
Percentage of native residents but born outside the U.S.:
Percentage of foreign born residents:
| Here: | 42.6% |
| San Jose: | 46.1% |
Percentage of people born in another U.S. state:
| North Campus: | 18.1% |
| San Jose: | 10.4% |
Percentage of native residents but born outside the U.S.:
| Here: | 2.5% |
| city: | 1.7% |
Percentage of foreign born residents:
| Here: | 36.9% |
| San Jose: | 41.8% |
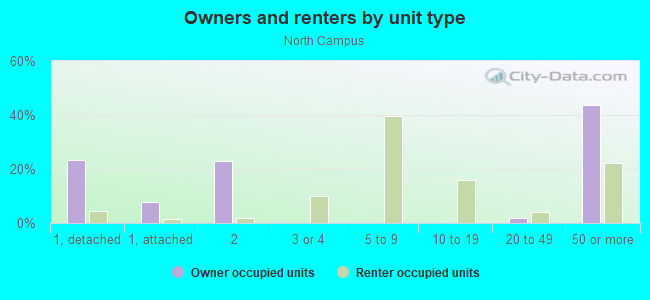
Owner-occupied
Renter-occupied

- Rooms in owner-occupied houses and condos in North Campus
- 31 room
- 232 rooms
- 83 rooms
- 284 rooms
- 35 rooms
- 576 rooms
- 87 rooms
- 378 rooms
- 229+ rooms
- Rooms in renter-occupied apartments in North Campus
- 1001 room
- 562 rooms
- 343 rooms
- 504 rooms
- 165 rooms
- 186 rooms
- 87 rooms
- 48 rooms
- 569+ rooms
Owner-occupied
Renter-occupied
- Bedrooms in owner-occupied houses and condos in North Campus
- 23no bedroom
- 111 bedroom
- 42 bedrooms
- 503 bedrooms
- 404 bedrooms
- 225+ bedrooms
- Bedrooms in renter-occupied apartments in North Campus
- 104no bedroom
- 671 bedroom
- 672 bedrooms
- 83 bedrooms
- 124 bedrooms
- 85+ bedrooms
Average number of cars or other vehicles available in houses/condos:
Average number of cars or other vehicles available in apartments:
| This neighborhood: | 7.0 |
| San Jose: | 2.3 |
Average number of cars or other vehicles available in apartments:
| Here: | 1.1 |
| city: | 1.6 |
Percentage of units with a mortgage:
| North Campus: | 84.2% |
| San Jose: | 66.9% |
Average estimated value of detached houses in 2022 (14.2% of all units):
| North Campus: | $889,705 |
| San Jose: | $1,532,815 |
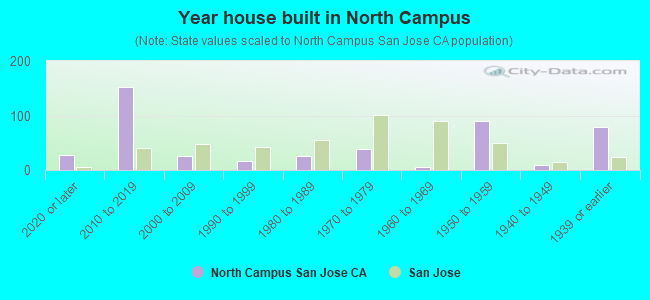
- Year house built in North Campus
- 272020 or later
- 1522010 to 2019
- 252000 to 2009
- 161990 to 1999
- 261980 to 1989
- 381970 to 1979
- 61960 to 1969
- 891950 to 1959
- 101940 to 1949
- 791939 or earlier
City-data.com crime index for city in 2020 (higher means more crime):
| City: | 268.4 |
| U.S. average: | 219.5 |
Travel time to work (commute)
![Travel time to work (commute)]()
- 4Less than 5 minutes
- 205 to 9 minutes
- 4010 to 14 minutes
- 3515 to 19 minutes
- 5520 to 24 minutes
- 1225 to 29 minutes
- 2930 to 34 minutes
- 635 to 39 minutes
- 440 to 44 minutes
- 3545 to 59 minutes
- 2760 to 89 minutes
- 890 or more minutes

Means of transportation to work
![Means of transportation to work]()
- 49.5%125Drove a car alone
- 4.8%12Carpooled
- 3.6%9Bus
- 1.2%3Subway or elevated rail
- 2.4%6Long-distance train or commuter rail
- 3.2%8Light rail, streetcar or trolley
- 6.7%17Taxi
- 0.8%2Motorcycle
- 1.2%3Bicycle
- 21.0%53Walked
- 4.0%10Other means
- 13.9%35Worked at home

Time leaving home to go to work
![Time leaving home to go to work]()
- 712:00 a.m. to 4:59 a.m.
- 45:00 a.m. to 5:29 a.m.
- 45:30 a.m. to 5:59 a.m.
- 66:00 a.m. to 6:29 a.m.
- 286:30 a.m. to 6:59 a.m.
- 267:00 a.m. to 7:29 a.m.
- 247:30 a.m. to 7:59 a.m.
- 448:00 a.m. to 8:29 a.m.
- 268:30 a.m. to 8:59 a.m.
- 339:00 a.m. to 9:59 a.m.
- 1710:00 a.m. to 10:59 a.m.
- 211:00 a.m. to 11:59 a.m.
- 2212:00 p.m. to 3:59 p.m.
- 124:00 p.m. to 11:59 p.m.

Occupations of males:
- Percentage of males in management occupations (except farmers):
Here: 4.0% city: 13.0%
- Percentage of males in business and financial operations occupations:
Here: 5.7% city: 4.6%
- Percentage of males in computer and mathematical occupations:
Here: 4.4% city: 13.6%
- Percentage of males in architecture and engineering occupations:
Here: 7.5% city: 10.2%
- Percentage of males in legal occupations:
Here: 1.3% city: 0.8%
- Percentage of males in education, training, and library occupations:
Here: 2.5% city: 2.8%
- Percentage of males in healthcare practitioners and technical occupations:
Here: 6.8% city: 2.0%
- Percentage of males in service occupations:
Here: 14.5% city: 12.7%
- Percentage of males in sales and office occupations:
Here: 12.1% city: 12.8%
- Percentage of males in farming, fishing, and forestry occupations:
Here: 18.0% city: 0.4%
- Percentage of males in construction, extraction, and maintenance occupations:
Here: 16.5% city: 7.8%
- Percentage of males in transportation occupations:
Here: 6.1% city: 3.6%
Occupations of females:
- Percentage of females in management occupations (except farmers):
Here: 2.9% city: 11.0%
- Percentage of females in business and financial operations occupations:
Here: 20.4% city: 8.6%
- Percentage of females in architecture and engineering occupations:
Here: 6.3% city: 2.8%
- Percentage of females in life, physical, and social science occupations:
Here: 10.7% city: 1.7%
- Percentage of females in education, training, and library occupations:
Here: 4.4% city: 8.1%
- Percentage of females in arts, design, entertainment, sports, and media occupations:
Here: 5.5% city: 2.0%
- Percentage of females in healthcare practitioners and technical occupations:
Here: 11.0% city: 6.8%
- Percentage of females in service occupations:
Here: 31.3% city: 21.7%
- Percentage of females in sales and office occupations:
Here: 29.1% city: 22.0%
Percentage of people 16-64 in Armed Forces:
| North Campus: | 0.0% |
| San Jose: | 0.0% |
Education in this neighborhood (subdivision or community):
- Percentage of people 3 years and older in K-12 schools:
North Campus: 30.5% San Jose: 16.1%
- Percentage of people 3 years and older in undergraduate colleges:
North Campus: 39.5% San Jose: 6.5%
- Percentage of people 3 years and older in grad. or professional schools:
North Campus: 11.9% San Jose: 2.0%
- Percentage of students K-12 enrolled in private schools:
North Campus: 21.1% San Jose: 14.9%
Percentage of population below poverty level:
| North Campus: | 32.6% |
| San Jose: | 9.0% |
Median year renter moved in (as recorded in 2022):
| North Campus: | 2014 |
| San Jose: | 2020 |
Percentage of married-couple families with both working:
| North Campus: | 224.7% |
| San Jose: | 72.5% |
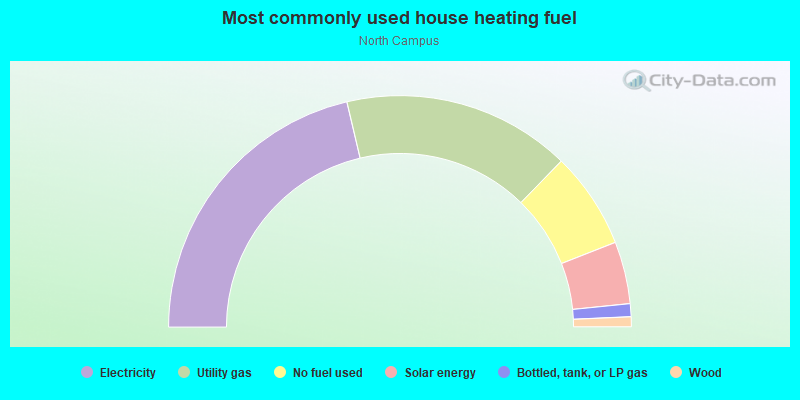
- 42.6%Electricity
- 31.9%Utility gas
- 13.5%No fuel used
- 8.7%Solar energy
- 1.8%Bottled, tank, or LP gas
- 1.4%Wood
Roads and streets:
E San Fernando St
Length: 0.40 miles
Direction: SW-NE
Address range: 201 to 499
Direction: SW-NE
Address range: 201 to 499
S 9th St
Length: 0.11 miles
Direction: SE-NW
Address range: 28 to 99
Direction: SE-NW
Address range: 28 to 99
S 10th St
Length: 0.11 miles
Direction: SE-NW
Address range: 32 to 99
Direction: SE-NW
Address range: 32 to 99
S 5th St
Length: 0.08 miles
Direction: SE-NW
Address range: 1 to 99
Direction: SE-NW
Address range: 1 to 99
Elizabeth St
Length: 0.08 miles
Direction: SW-NE
Address range: 400 to 499
Direction: SW-NE
Address range: 400 to 499