North Beverly Hills neighborhood in Fort Worth, Texas (TX), 76114 detailed profile
Settings
X

Business Search - 14 Million verified businesses
Area: 0.125 square miles
Population: 612
Population density:
| North Beverly Hills: | 4,894 people per square mile |
| Fort Worth: | 3,286 people per square mile |

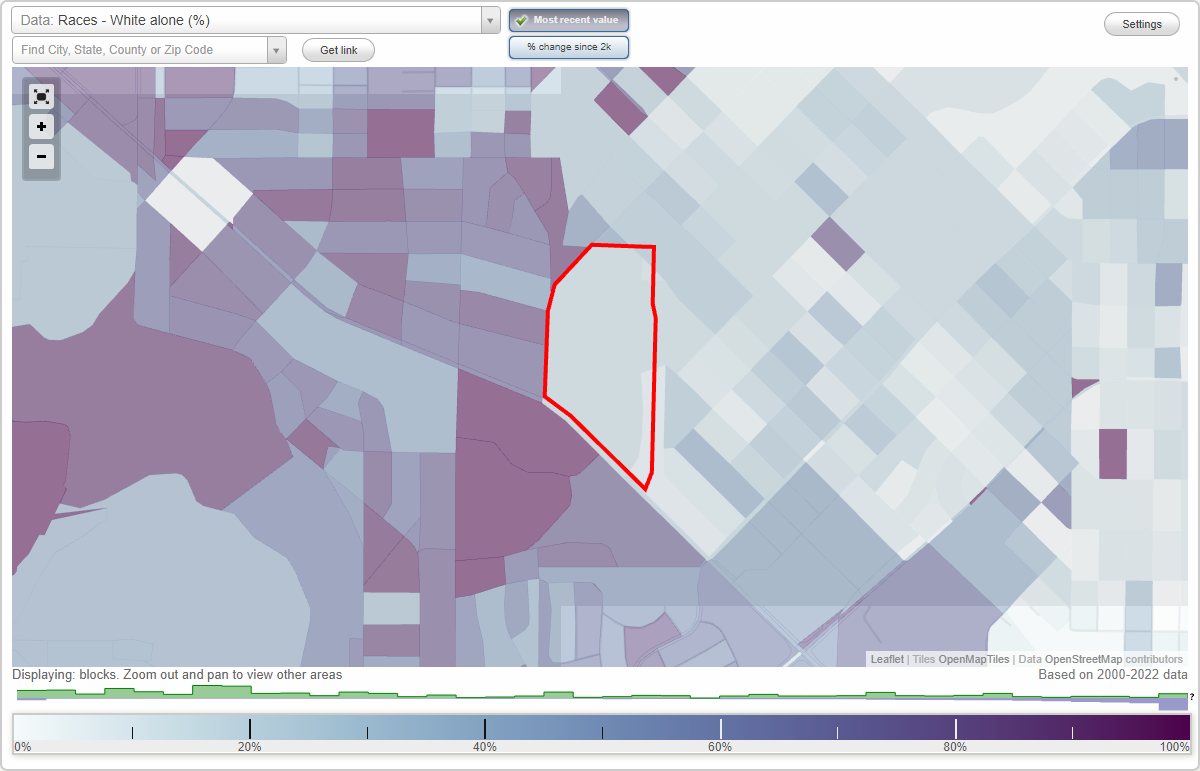
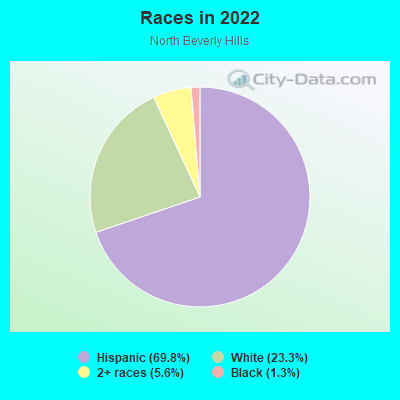
- 42669.8%Hispanic or Latino
- 14223.3%White
- 345.6%Two or more races
- 81.3%Black
Median household income in 2022:
| North Beverly Hills: | $72,596 |
| Fort Worth: | $71,527 |
Distribution of median household income
![Distribution of median household income]()
- 10Less than $10,000
- 8$10,000 to $19,999
- 26$20,000 to $29,999
- 29$30,000 to $39,999
- 12$40,000 to $49,999
- 24$50,000 to $59,999
- 17$60,000 to $74,999
- 25$75,000 to $99,999
- 58$100,000 to $124,999
- 12$125,000 to $149,999
- 1$150,000 to $199,999
- 1$200,000 or more

Distribution of owner-occupied house/condo value
![Distribution of owner-occupied house/condo value]()
- 4Less than $50,000
- 14$50,000 to $99,999
- 61$100,000 to $149,999
- 17$150,000 to $199,999
- 2$200,000 to $249,999
- 4$250,000 to $299,999
- 1$300,000 to $399,999
- 1$750,000 to $999,999

Distribution of rent paid by renters
![Distribution of rent paid by renters]()
- 1$500 to $599
- 22$600 to $699
- 9$700 to $799
- 4$800 to $899
- 23$900 to $999
- 66$1,000 to $1,249
- 8$1,250 to $1,499

Median rent in 2022:
| North Beverly Hills: | $1,038 |
| Fort Worth: | $1,182 |
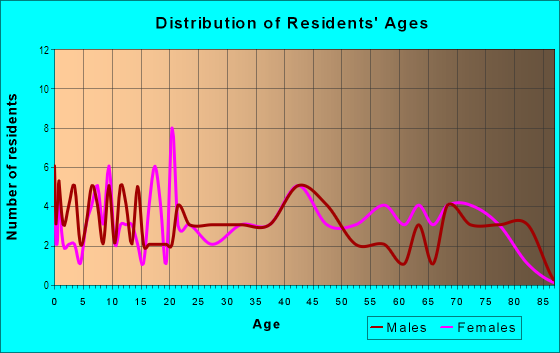
| Males: | 338 |
| Females: | 274 |
Males:
| This neighborhood: | 29.3 years |
| Whole city: | 33.6 years |
| This neighborhood: | 32.6 years |
| Whole city: | 34.8 years |
Average household size:
| North Beverly Hills: | 2.9 people |
| Fort Worth: | 2.7 people |
Percentage of family households:
| North Beverly Hills: | 50.9% |
| Fort Worth: | 52.4% |
| Here: | 50.7% |
| Fort Worth: | 48.2% |
Percentage of married-couple families with children (among all households):
| North Beverly Hills: | 32.0% |
| Fort Worth: | 25.9% |
Percentage of single-mother households (among all households):
| North Beverly Hills: | 2.2% |
| Fort Worth: | 7.4% |
Percentage of never married males 15 years old and over:
Percentage of never married females 15 years old and over:
| North Beverly Hills: | 27.8% |
| Fort Worth: | 18.5% |
Percentage of never married females 15 years old and over:
| North Beverly Hills: | 7.0% |
| city: | 17.3% |
Percentage of people born in this state:
Percentage of people born in another U.S. state:
Percentage of native residents but born outside the U.S.:
Percentage of foreign born residents:
| Here: | 66.0% |
| Fort Worth: | 55.0% |
Percentage of people born in another U.S. state:
| North Beverly Hills: | 17.7% |
| Fort Worth: | 26.2% |
Percentage of native residents but born outside the U.S.:
| Here: | 2.2% |
| city: | 2.1% |
Percentage of foreign born residents:
| Here: | 14.1% |
| Fort Worth: | 16.6% |
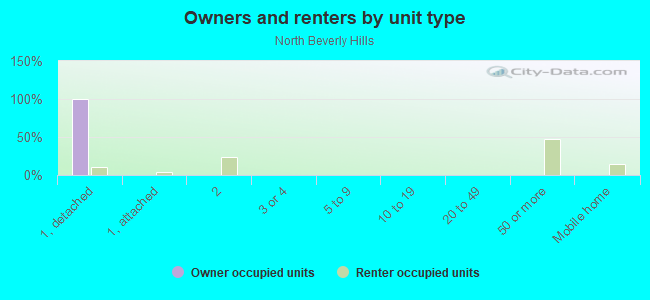
Owner-occupied
Renter-occupied

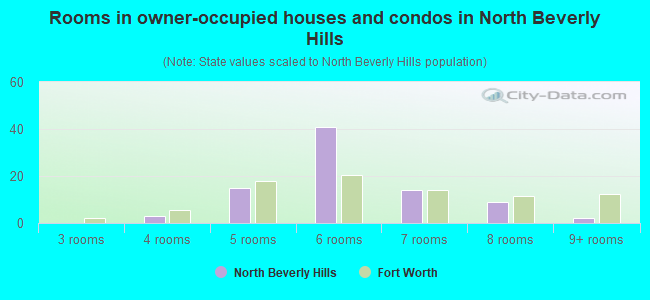
- Rooms in owner-occupied houses and condos in North Beverly Hills
- 01 room
- 02 rooms
- 03 rooms
- 34 rooms
- 155 rooms
- 416 rooms
- 147 rooms
- 98 rooms
- 29+ rooms
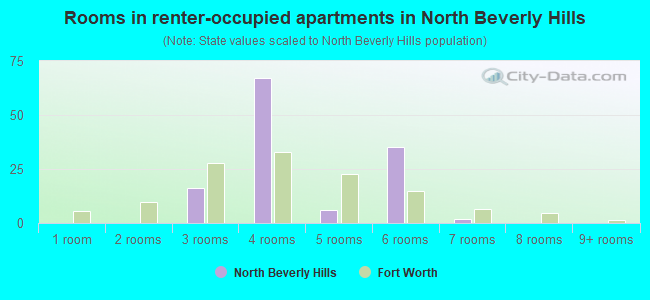
- Rooms in renter-occupied apartments in North Beverly Hills
- 01 room
- 02 rooms
- 163 rooms
- 674 rooms
- 65 rooms
- 356 rooms
- 27 rooms
- 08 rooms
- 09+ rooms
Owner-occupied
Renter-occupied
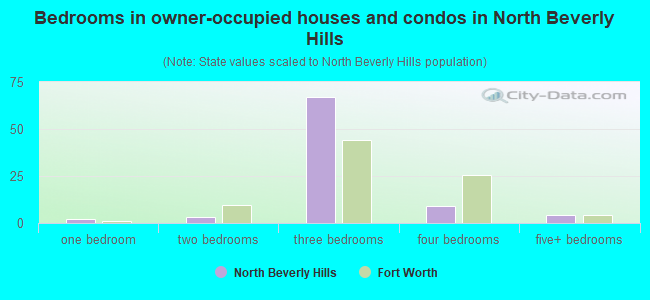
- Bedrooms in owner-occupied houses and condos in North Beverly Hills
- 0no bedroom
- 21 bedroom
- 32 bedrooms
- 673 bedrooms
- 94 bedrooms
- 45+ bedrooms
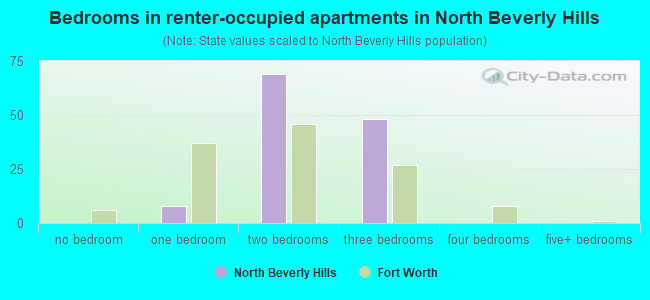
- Bedrooms in renter-occupied apartments in North Beverly Hills
- 0no bedroom
- 81 bedroom
- 692 bedrooms
- 483 bedrooms
- 04 bedrooms
- 05+ bedrooms
Average number of cars or other vehicles available in houses/condos:
Average number of cars or other vehicles available in apartments:
| This neighborhood: | 2.4 |
| Fort Worth: | 2.1 |
Average number of cars or other vehicles available in apartments:
| Here: | 1.8 |
| city: | 1.5 |
Percentage of units with a mortgage:
| North Beverly Hills: | 31.4% |
| Fort Worth: | 61.2% |
Average estimated value of detached houses in 2022 (44.8% of all units):
| North Beverly Hills: | $117,326 |
| Fort Worth: | $264,175 |
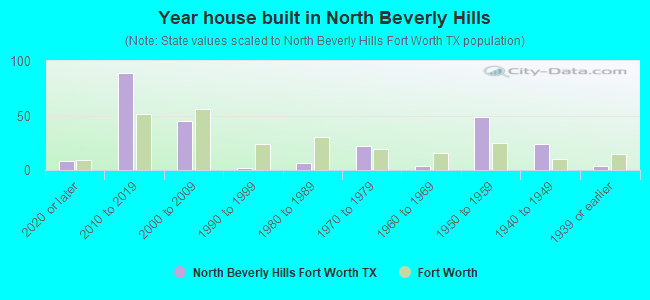
- Year house built in North Beverly Hills
- 82020 or later
- 892010 to 2019
- 452000 to 2009
- 21990 to 1999
- 61980 to 1989
- 221970 to 1979
- 41960 to 1969
- 491950 to 1959
- 241940 to 1949
- 41939 or earlier
City-data.com crime index for city in 2020 (higher means more crime):
| City: | 303.1 |
| U.S. average: | 219.5 |
Travel time to work (commute)
![Travel time to work (commute)]()
- 85 to 9 minutes
- 1910 to 14 minutes
- 1615 to 19 minutes
- 3020 to 24 minutes
- 225 to 29 minutes
- 2530 to 34 minutes
- 135 to 39 minutes
- 540 to 44 minutes
- 10445 to 59 minutes
- 660 to 89 minutes

Means of transportation to work
![Means of transportation to work]()
- 59.2%153Drove a car alone
- 31.7%82Carpooled
- 3.5%9Other means
- 5.0%13Worked at home

Time leaving home to go to work
![Time leaving home to go to work]()
- 512:00 a.m. to 4:59 a.m.
- 25:00 a.m. to 5:29 a.m.
- 95:30 a.m. to 5:59 a.m.
- 136:00 a.m. to 6:29 a.m.
- 166:30 a.m. to 6:59 a.m.
- 277:00 a.m. to 7:29 a.m.
- 127:30 a.m. to 7:59 a.m.
- 58:00 a.m. to 8:29 a.m.
- 38:30 a.m. to 8:59 a.m.
- 229:00 a.m. to 9:59 a.m.
- 311:00 a.m. to 11:59 a.m.
- 1312:00 p.m. to 3:59 p.m.
- 24:00 p.m. to 11:59 p.m.

Occupations of males:
- Percentage of males in management occupations (except farmers):
Here: 1.5% city: 11.7%
- Percentage of males in architecture and engineering occupations:
Here: 3.8% city: 3.4%
- Percentage of males in service occupations:
Here: 18.7% city: 12.0%
- Percentage of males in sales and office occupations:
Here: 6.6% city: 15.8%
- Percentage of males in construction, extraction, and maintenance occupations:
Here: 39.2% city: 11.7%
- Percentage of males in production occupations:
Here: 17.0% city: 7.8%
- Percentage of males in transportation occupations:
Here: 5.2% city: 7.1%
- Percentage of males in material moving occupations:
Here: 1.9% city: 7.1%
Occupations of females:
- Percentage of females in management occupations (except farmers):
Here: 11.3% city: 9.6%
- Percentage of females in education, training, and library occupations:
Here: 3.9% city: 9.5%
- Percentage of females in healthcare practitioners and technical occupations:
Here: 3.9% city: 7.9%
- Percentage of females in service occupations:
Here: 43.8% city: 20.2%
- Percentage of females in sales and office occupations:
Here: 36.9% city: 28.3%
- Percentage of females in production occupations:
Here: 9.8% city: 3.5%
- Percentage of females in material moving occupations:
Here: 6.8% city: 3.4%
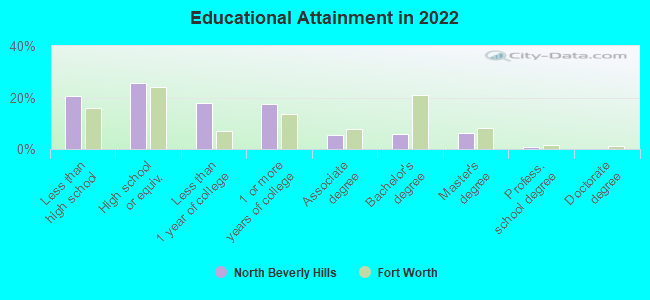
Education in this neighborhood (subdivision or community):
- Percentage of people 3 years and older in K-12 schools:
North Beverly Hills: 16.7% Fort Worth: 20.3%
- Percentage of people 3 years and older in undergraduate colleges:
North Beverly Hills: 0.8% Fort Worth: 4.7%
- Percentage of people 3 years and older in grad. or professional schools:
North Beverly Hills: 4.7% Fort Worth: 1.6%
- Percentage of students K-12 enrolled in private schools:
North Beverly Hills: 0.0% Fort Worth: 7.2%
Percentage of population below poverty level:
| North Beverly Hills: | 24.9% |
| Fort Worth: | 12.0% |
Median year owner moved in (as recorded in 2022):
Median year renter moved in (as recorded in 2022):
| North Beverly Hills: | 2003 |
| Fort Worth: | 2013 |
Median year renter moved in (as recorded in 2022):
| North Beverly Hills: | 2020 |
| Fort Worth: | 2020 |
Percentage of married-couple families with both working:
| North Beverly Hills: | 39.8% |
| Fort Worth: | 71.2% |
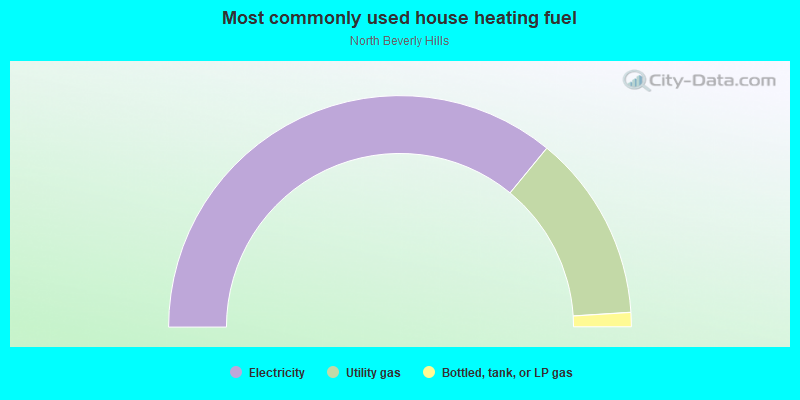
- 71.9%Electricity
- 26.1%Utility gas
- 2.0%Bottled, tank, or LP gas
Roads and streets:
Capri Dr
Length: 0.44 miles
Direction: N-S
Address range: 2250 to 2649
Direction: N-S
Address range: 2250 to 2649
Terrace Trl
Length: 0.26 miles
Directions: E-W, N-S, SE-NW
Address range: 4800 to 4914
Directions: E-W, N-S, SE-NW
Address range: 4800 to 4914
Sewell Ave
Length: 0.16 miles
Direction: E-W
Address range: 4800 to 4999
Direction: E-W
Address range: 4800 to 4999
Macie Ave (Macie St)
Length: 0.15 miles
Directions: E-W, SW-NE
Address range: 4800 to 4899
Directions: E-W, SW-NE
Address range: 4800 to 4899
Trena St
Length: 0.11 miles
Directions: E-W, SE-NW
Address range: 4800 to 4899
Directions: E-W, SE-NW
Address range: 4800 to 4899