Newlands neighborhood in Boulder, Colorado (CO), 80304 detailed profile
Settings
X


Business Search - 14 Million verified businesses
Area: 0.403 square miles
Population: 2,763
Population density:
| Newlands: | 6,862 people per square mile |
| Boulder: | 4,328 people per square mile |

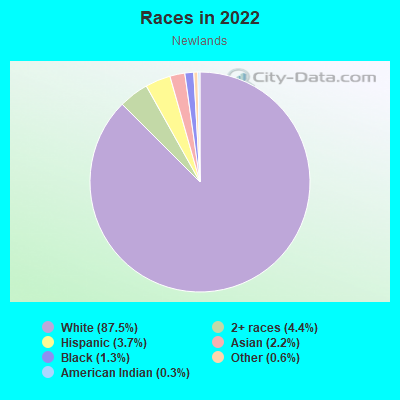
- 2,52687.5%White
- 1274.4%Two or more races
- 1073.7%Hispanic or Latino
- 632.2%Asian
- 381.3%Black
- 180.6%Some other race
- 80.3%American Indian
Median household income in 2022:
| Newlands: | $151,824 |
| Boulder: | $81,608 |
Distribution of median household income
![Distribution of median household income]()
- 29Less than $10,000
- 134$10,000 to $19,999
- 51$20,000 to $29,999
- 112$30,000 to $39,999
- 95$40,000 to $49,999
- 26$50,000 to $59,999
- 121$60,000 to $74,999
- 150$75,000 to $99,999
- 29$100,000 to $124,999
- 52$125,000 to $149,999
- 135$150,000 to $199,999
- 492$200,000 or more

Distribution of owner-occupied house/condo value
![Distribution of owner-occupied house/condo value]()
- 39$50,000 to $99,999
- 40$100,000 to $149,999
- 107$150,000 to $199,999
- 94$300,000 to $399,999
- 47$400,000 to $499,999
- 158$500,000 to $749,999
- 66$750,000 to $999,999
- 706$1,000,000 or more

Distribution of rent paid by renters
![Distribution of rent paid by renters]()
- 16Less than $100
- 19$200 to $299
- 10$300 to $399
- 72$400 to $499
- 208$500 to $599
- 15$600 to $699
- 299$1,000 to $1,249
- 21$1,250 to $1,499
- 23$1,500 to $1,999
- 269$2,000 or more

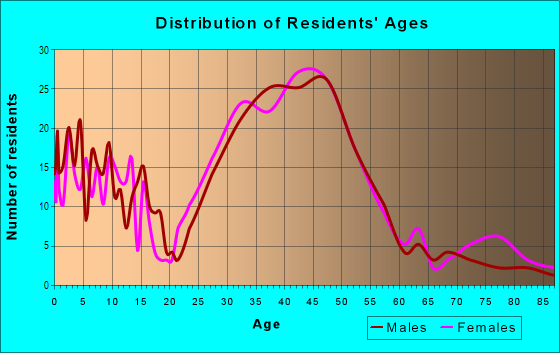
| Males: | 1,367 |
| Females: | 1,396 |
Males:
| This neighborhood: | 41.3 years |
| Whole city: | 28.3 years |
| This neighborhood: | 41.8 years |
| Whole city: | 29.2 years |
Average household size:
| Newlands: | 7.3 people |
| Boulder: | 2.1 people |
Percentage of family households:
| Newlands: | 41.3% |
| Boulder: | 26.9% |
| Here: | 60.0% |
| Boulder: | 30.4% |
Percentage of married-couple families with children (among all households):
| Newlands: | 32.5% |
| Boulder: | 32.8% |
Percentage of single-mother households (among all households):
| Newlands: | 9.4% |
| Boulder: | 6.3% |
Percentage of never married males 15 years old and over:
Percentage of never married females 15 years old and over:
| Newlands: | 17.1% |
| Boulder: | 32.7% |
Percentage of never married females 15 years old and over:
| Newlands: | 10.4% |
| city: | 28.3% |
Percentage of people that speak English not well or not at all:
| Newlands: | 1.1% |
| Boulder: | 1.0% |
Percentage of people born in this state:
Percentage of people born in another U.S. state:
Percentage of native residents but born outside the U.S.:
Percentage of foreign born residents:
| Here: | 29.0% |
| Boulder: | 28.3% |
Percentage of people born in another U.S. state:
| Newlands: | 60.1% |
| Boulder: | 60.5% |
Percentage of native residents but born outside the U.S.:
| Here: | 2.0% |
| city: | 2.1% |
Percentage of foreign born residents:
| Here: | 8.9% |
| Boulder: | 9.1% |
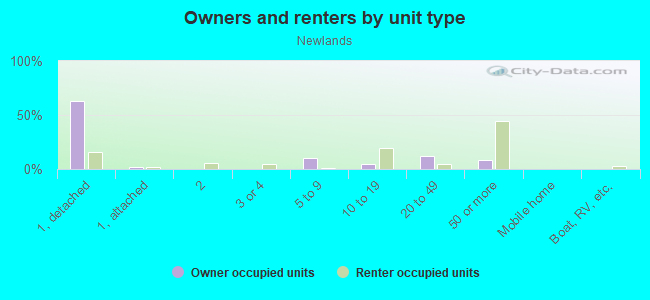
Owner-occupied
Renter-occupied

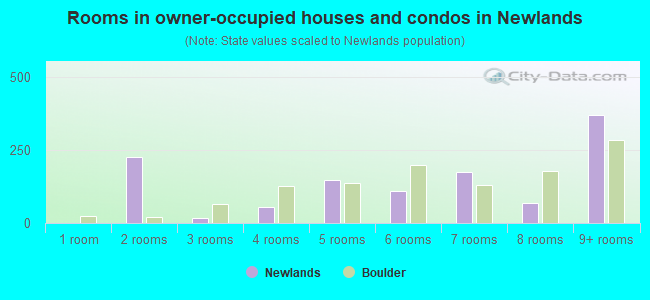
- Rooms in owner-occupied houses and condos in Newlands
- 01 room
- 2272 rooms
- 163 rooms
- 554 rooms
- 1475 rooms
- 1096 rooms
- 1757 rooms
- 698 rooms
- 3699+ rooms
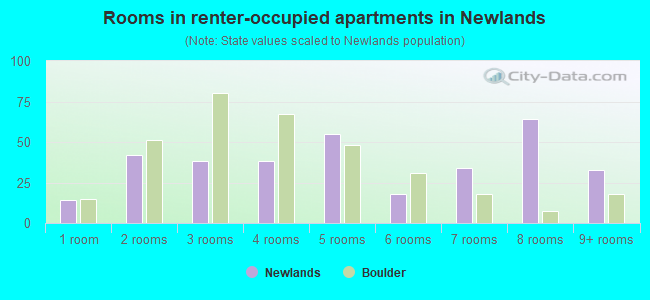
- Rooms in renter-occupied apartments in Newlands
- 141 room
- 422 rooms
- 383 rooms
- 384 rooms
- 555 rooms
- 186 rooms
- 347 rooms
- 648 rooms
- 339+ rooms
Owner-occupied
Renter-occupied
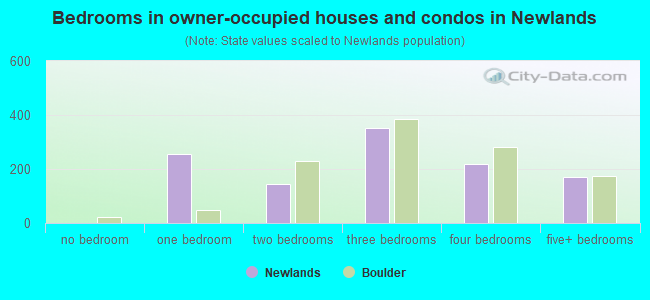
- Bedrooms in owner-occupied houses and condos in Newlands
- 0no bedroom
- 2551 bedroom
- 1452 bedrooms
- 3513 bedrooms
- 2174 bedrooms
- 1725+ bedrooms
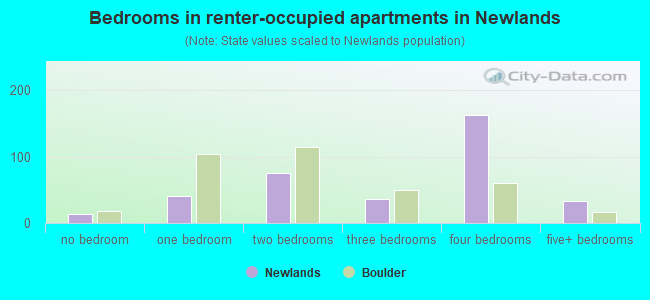
- Bedrooms in renter-occupied apartments in Newlands
- 14no bedroom
- 411 bedroom
- 762 bedrooms
- 363 bedrooms
- 1634 bedrooms
- 335+ bedrooms
Average number of cars or other vehicles available in houses/condos:
Average number of cars or other vehicles available in apartments:
| This neighborhood: | 1.7 |
| Boulder: | 1.8 |
Average number of cars or other vehicles available in apartments:
| Here: | 1.8 |
| city: | 1.6 |
Percentage of units with a mortgage:
| Newlands: | 45.0% |
| Boulder: | 60.5% |
Average estimated value of detached houses in 2022 (88.9% of all units):
| Newlands: | $2,005,971 |
| Boulder: | $1,567,950 |
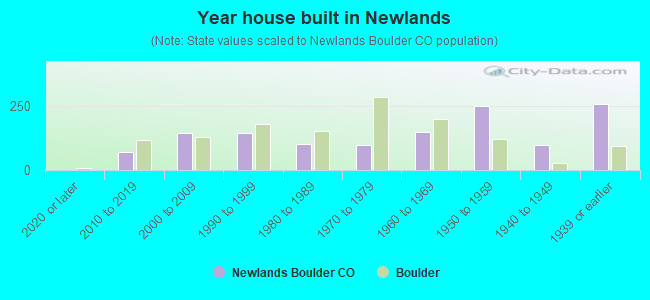
- Year house built in Newlands
- 02020 or later
- 722010 to 2019
- 1432000 to 2009
- 1461990 to 1999
- 1031980 to 1989
- 981970 to 1979
- 1471960 to 1969
- 2491950 to 1959
- 971940 to 1949
- 2571939 or earlier
City-data.com crime index for city in 2020 (higher means more crime):
| City: | 275.1 |
| U.S. average: | 219.5 |
Travel time to work (commute)
![Travel time to work (commute)]()
- 35Less than 5 minutes
- 2545 to 9 minutes
- 18310 to 14 minutes
- 7715 to 19 minutes
- 10120 to 24 minutes
- 4225 to 29 minutes
- 4330 to 34 minutes
- 6035 to 39 minutes
- 1040 to 44 minutes
- 4845 to 59 minutes
- 4760 to 89 minutes
- 1290 or more minutes

Means of transportation to work
![Means of transportation to work]()
- 44.5%606Drove a car alone
- 5.2%71Carpooled
- 5.4%73Bus
- 3.2%43Motorcycle
- 8.9%121Bicycle
- 6.5%88Walked
- 0.5%7Other means
- 31.0%422Worked at home

Time leaving home to go to work
![Time leaving home to go to work]()
- 1512:00 a.m. to 4:59 a.m.
- 205:00 a.m. to 5:29 a.m.
- 295:30 a.m. to 5:59 a.m.
- 506:00 a.m. to 6:29 a.m.
- 126:30 a.m. to 6:59 a.m.
- 427:00 a.m. to 7:29 a.m.
- 1547:30 a.m. to 7:59 a.m.
- 1098:00 a.m. to 8:29 a.m.
- 1088:30 a.m. to 8:59 a.m.
- 2179:00 a.m. to 9:59 a.m.
- 2510:00 a.m. to 10:59 a.m.
- 4611:00 a.m. to 11:59 a.m.
- 2712:00 p.m. to 3:59 p.m.
- 574:00 p.m. to 11:59 p.m.

Occupations of males:
- Percentage of males in management occupations (except farmers):
Here: 34.0% city: 12.9%
- Percentage of males in business and financial operations occupations:
Here: 13.6% city: 7.6%
- Percentage of males in computer and mathematical occupations:
Here: 2.5% city: 10.0%
- Percentage of males in architecture and engineering occupations:
Here: 7.9% city: 6.1%
- Percentage of males in life, physical, and social science occupations:
Here: 3.8% city: 6.1%
- Percentage of males in legal occupations:
Here: 5.4% city: 2.1%
- Percentage of males in education, training, and library occupations:
Here: 4.7% city: 8.1%
- Percentage of males in arts, design, entertainment, sports, and media occupations:
Here: 1.6% city: 3.3%
- Percentage of males in healthcare practitioners and technical occupations:
Here: 1.8% city: 1.9%
- Percentage of males in service occupations:
Here: 2.3% city: 14.4%
- Percentage of males in sales and office occupations:
Here: 12.2% city: 14.5%
- Percentage of males in production occupations:
Here: 3.2% city: 2.3%
- Percentage of males in transportation occupations:
Here: 1.4% city: 2.5%
- Percentage of males in material moving occupations:
Here: 2.9% city: 2.4%
Occupations of females:
- Percentage of females in management occupations (except farmers):
Here: 8.2% city: 8.8%
- Percentage of females in business and financial operations occupations:
Here: 15.3% city: 6.4%
- Percentage of females in computer and mathematical occupations:
Here: 3.9% city: 4.6%
- Percentage of females in architecture and engineering occupations:
Here: 1.2% city: 1.9%
- Percentage of females in life, physical, and social science occupations:
Here: 1.5% city: 4.7%
- Percentage of females in community and social services occupations:
Here: 1.8% city: 2.1%
- Percentage of females in legal occupations:
Here: 2.0% city: 1.4%
- Percentage of females in education, training, and library occupations:
Here: 9.8% city: 13.1%
- Percentage of females in arts, design, entertainment, sports, and media occupations:
Here: 7.1% city: 5.5%
- Percentage of females in healthcare practitioners and technical occupations:
Here: 1.9% city: 7.2%
- Percentage of females in service occupations:
Here: 13.5% city: 20.9%
- Percentage of females in sales and office occupations:
Here: 33.8% city: 19.4%
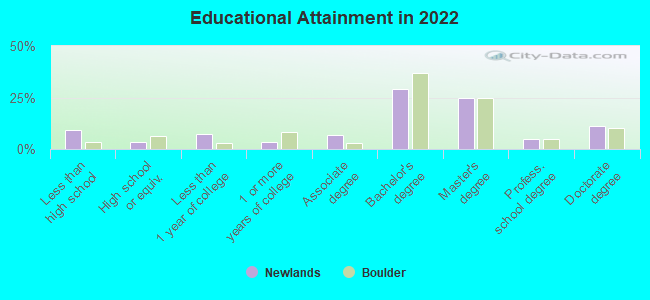
Education in this neighborhood (subdivision or community):
- Percentage of people 3 years and older in K-12 schools:
Newlands: 19.3% Boulder: 8.8%
- Percentage of people 3 years and older in undergraduate colleges:
Newlands: 30.3% Boulder: 28.2%
- Percentage of people 3 years and older in grad. or professional schools:
Newlands: 6.2% Boulder: 6.1%
- Percentage of students K-12 enrolled in private schools:
Newlands: 32.6% Boulder: 8.5%
Percentage of population below poverty level:
| Newlands: | 4.9% |
| Boulder: | 24.1% |
Median year owner moved in (as recorded in 2022):
| Newlands: | 2006 |
| Boulder: | 2012 |
Percentage of married-couple families with both working:
| Newlands: | 156.8% |
| Boulder: | 76.2% |
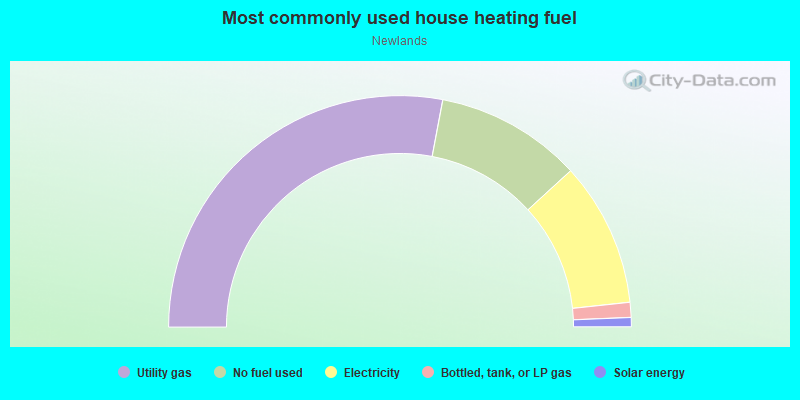
- 56.0%Utility gas
- 20.5%No fuel used
- 20.2%Electricity
- 2.1%Bottled, tank, or LP gas
- 1.3%Solar energy
Roads and streets:
Evergreen Ave
Length: 0.79 miles
Directions: E-W, SE-NW
Address range: 200 to 1199
Directions: E-W, SE-NW
Address range: 200 to 1199
7th St
Length: 0.74 miles
Directions: N-S, SE-NW
Address range: 2733 to 3241
Directions: N-S, SE-NW
Address range: 2733 to 3241
Forest Ave
Length: 0.73 miles
Direction: E-W
Address range: 301 to 1199
Direction: E-W
Address range: 301 to 1199
9th St
Length: 0.72 miles
Direction: N-S
Address range: 2800 to 3399
Direction: N-S
Address range: 2800 to 3399
Dellwood Ave
Length: 0.70 miles
Direction: E-W
Address range: 250 to 1099
Direction: E-W
Address range: 250 to 1099
6th St
Length: 0.66 miles
Directions: N-S, SE-NW
Address range: 2700 to 3299
Directions: N-S, SE-NW
Address range: 2700 to 3299
5th St
Length: 0.59 miles
Directions: N-S, SE-NW
Address range: 2700 to 3269
Directions: N-S, SE-NW
Address range: 2700 to 3269
4th St
Length: 0.59 miles
Direction: N-S
Address range: 2700 to 3425
Direction: N-S
Address range: 2700 to 3425
Cedar Ave
Length: 0.58 miles
Direction: E-W
Address range: 226 to 1099
Direction: E-W
Address range: 226 to 1099
3rd St
Length: 0.55 miles
Directions: N-S, SE-NW
Address range: 2712 to 3265
Directions: N-S, SE-NW
Address range: 2712 to 3265
Grape Ave
Length: 0.53 miles
Directions: E-W, SE-NW
Address range: 400 to 1199
Directions: E-W, SE-NW
Address range: 400 to 1199
Alpine Dr
Length: 0.52 miles
Directions: E-W, SE-NW
Address range: 300 to 899
Directions: E-W, SE-NW
Address range: 300 to 899
11th St
Length: 0.51 miles
Direction: N-S
Address range: 2800 to 3299
Direction: N-S
Address range: 2800 to 3299
Hawthorn Ave
Length: 0.51 miles
Direction: E-W
Address range: 300 to 999
Direction: E-W
Address range: 300 to 999
10th St
Length: 0.47 miles
Direction: N-S
Address range: 2800 to 3299
Direction: N-S
Address range: 2800 to 3299
Iris Ave
Length: 0.44 miles
Direction: E-W
Address range: 400 to 949
Direction: E-W
Address range: 400 to 949
Balsam Ave
Length: 0.38 miles
Directions: E-W, SE-NW
Address range: 227 to 799
Directions: E-W, SE-NW
Address range: 227 to 799
8th St
Length: 0.33 miles
Direction: N-S
Address range: 2700 to 3299
Direction: N-S
Address range: 2700 to 3299
Mountain Park Rd (Morningside Park Rd)
Length: 0.04 miles
Direction: E-W
Address range: 201 to 205
Direction: E-W
Address range: 201 to 205
Morningside Park Rd
Length: 0.03 miles
Directions: E-W, N-S
Directions: E-W, N-S
Other features:
Farmers Ditch
Length: 0.44 miles
Directions: E-W, N-S, SW-NE
Directions: E-W, N-S, SW-NE
Silver Lake Ditch
Length: 0.41 miles
Directions: N-S, SE-NW, SW-NE
Directions: N-S, SE-NW, SW-NE