New Horizons neighborhood in Chandler, Arizona (AZ), 85225 detailed profile
Settings
X

Business Search - 14 Million verified businesses
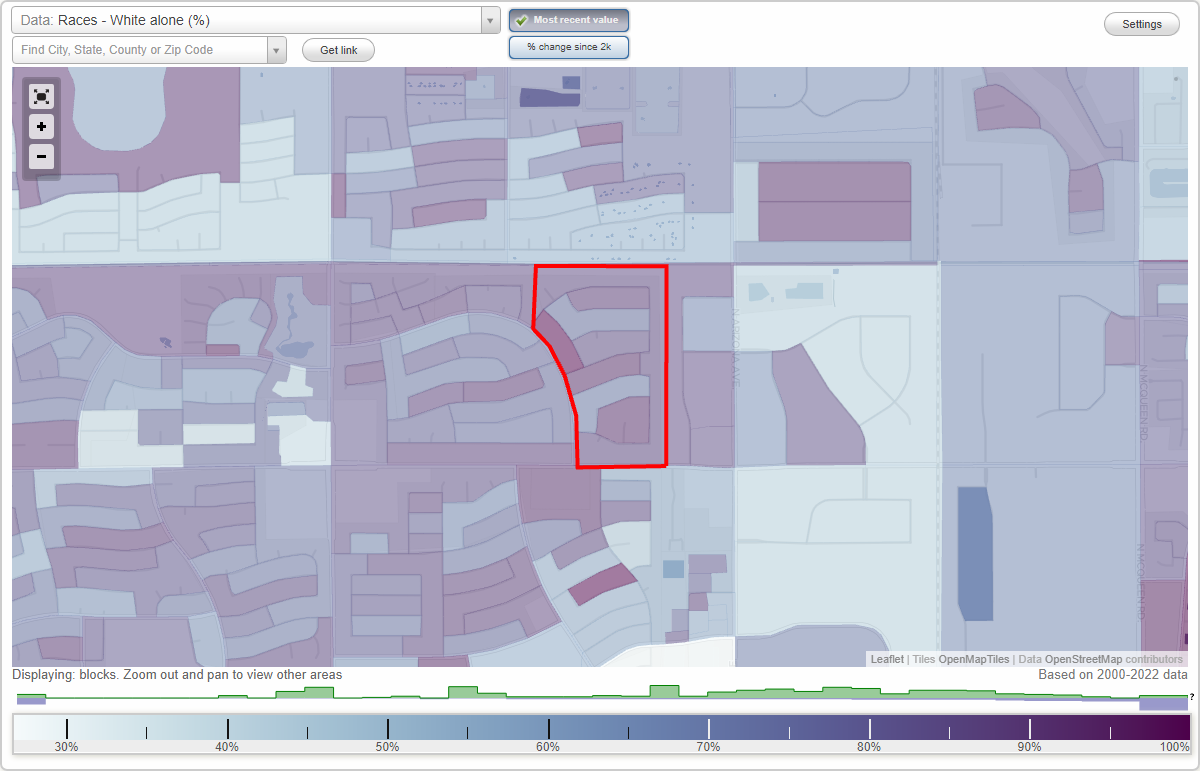
Area: 0.135 square miles
Population: 449
Population density:
| New Horizons: | 3,319 people per square mile |
| Chandler: | 4,849 people per square mile |

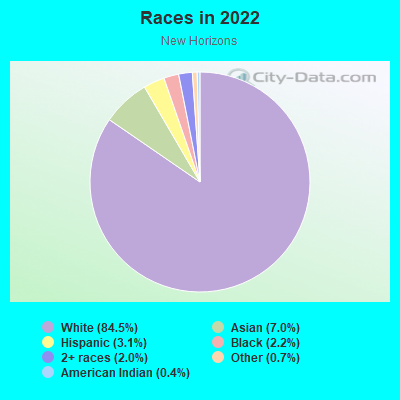
- 37784.5%White
- 317.0%Asian
- 143.1%Hispanic or Latino
- 102.2%Black
- 92.0%Two or more races
- 30.7%Some other race
- 20.4%American Indian
Median household income in 2022:
| New Horizons: | $74,068 |
| Chandler: | $98,664 |
Distribution of median household income
![Distribution of median household income]()
- 4Less than $10,000
- 22$10,000 to $19,999
- 69$20,000 to $29,999
- 14$30,000 to $39,999
- 15$40,000 to $49,999
- 11$50,000 to $59,999
- 2$60,000 to $74,999
- 49$75,000 to $99,999
- 31$100,000 to $124,999
- 14$125,000 to $149,999
- 44$150,000 to $199,999
- 30$200,000 or more

Distribution of owner-occupied house/condo value
![Distribution of owner-occupied house/condo value]()
- 21$100,000 to $149,999
- 16$150,000 to $199,999
- 13$200,000 to $249,999
- 15$250,000 to $299,999
- 36$300,000 to $399,999
- 54$400,000 to $499,999
- 49$500,000 to $749,999
- 8$750,000 to $999,999
- 5$1,000,000 or more

Distribution of rent paid by renters
![Distribution of rent paid by renters]()
- 16$800 to $899
- 2$900 to $999
- 6$1,000 to $1,249
- 10$1,250 to $1,499
- 65$1,500 to $1,999
- 2$2,000 or more

Median rent in 2022:
| New Horizons: | $1,282 |
| Chandler: | $1,692 |
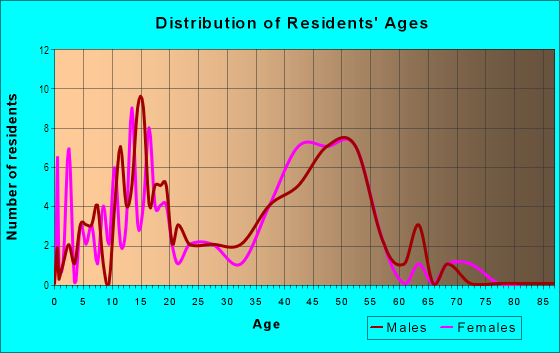
| Males: | 235 |
| Females: | 214 |
Males:
| This neighborhood: | 31.9 years |
| Whole city: | 35.8 years |
| This neighborhood: | 50.3 years |
| Whole city: | 38.3 years |
Average household size:
| New Horizons: | 2.5 people |
| Chandler: | 2.6 people |
Percentage of family households:
| New Horizons: | 52.0% |
| Chandler: | 53.2% |
| Here: | 54.7% |
| Chandler: | 50.7% |
Percentage of married-couple families with children (among all households):
| New Horizons: | 39.2% |
| Chandler: | 26.2% |
Percentage of single-mother households (among all households):
| New Horizons: | 4.5% |
| Chandler: | 7.3% |
Percentage of never married males 15 years old and over:
Percentage of never married females 15 years old and over:
| New Horizons: | 13.0% |
| Chandler: | 20.3% |
Percentage of never married females 15 years old and over:
| New Horizons: | 10.4% |
| city: | 14.9% |
Percentage of people that speak English not well or not at all:
| New Horizons: | 0.9% |
| Chandler: | 3.1% |
Percentage of people born in this state:
Percentage of people born in another U.S. state:
Percentage of native residents but born outside the U.S.:
Percentage of foreign born residents:
| Here: | 33.2% |
| Chandler: | 35.8% |
Percentage of people born in another U.S. state:
| New Horizons: | 55.1% |
| Chandler: | 44.6% |
Percentage of native residents but born outside the U.S.:
| Here: | 0.7% |
| city: | 1.5% |
Percentage of foreign born residents:
| Here: | 11.0% |
| Chandler: | 18.0% |
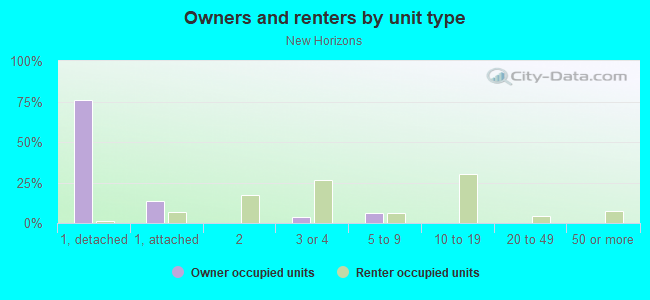
Owner-occupied
Renter-occupied

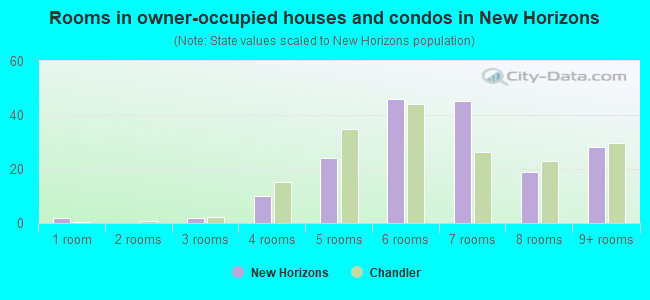
- Rooms in owner-occupied houses and condos in New Horizons
- 21 room
- 02 rooms
- 23 rooms
- 104 rooms
- 245 rooms
- 466 rooms
- 457 rooms
- 198 rooms
- 289+ rooms
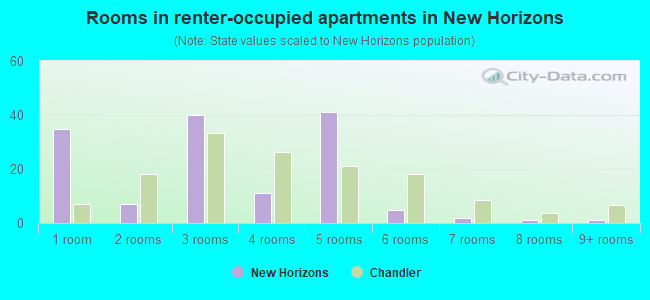
- Rooms in renter-occupied apartments in New Horizons
- 351 room
- 72 rooms
- 403 rooms
- 114 rooms
- 415 rooms
- 56 rooms
- 27 rooms
- 18 rooms
- 19+ rooms
Owner-occupied
Renter-occupied
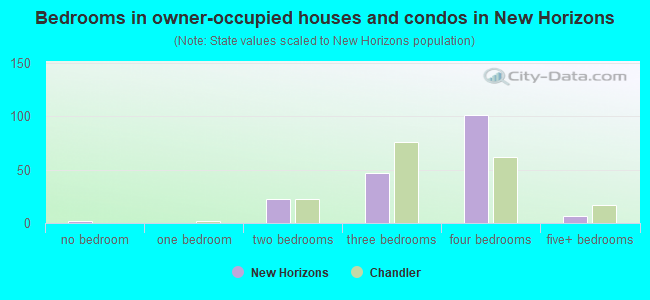
- Bedrooms in owner-occupied houses and condos in New Horizons
- 2no bedroom
- 01 bedroom
- 222 bedrooms
- 473 bedrooms
- 1014 bedrooms
- 75+ bedrooms
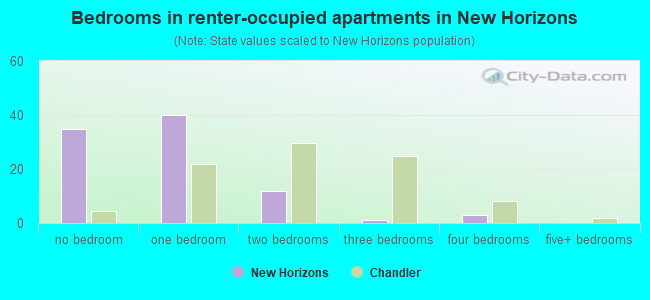
- Bedrooms in renter-occupied apartments in New Horizons
- 35no bedroom
- 401 bedroom
- 122 bedrooms
- 13 bedrooms
- 34 bedrooms
- 05+ bedrooms
Average number of cars or other vehicles available in houses/condos:
Average number of cars or other vehicles available in apartments:
| This neighborhood: | 2.1 |
| Chandler: | 2.1 |
Average number of cars or other vehicles available in apartments:
| Here: | 1.8 |
| city: | 1.5 |
Percentage of units with a mortgage:
| New Horizons: | 65.5% |
| Chandler: | 73.1% |
Housing prices:
- Average estimated value of detached houses in 2022 (78.6% of all units):
New Horizons: $480,561 Chandler: $480,818
- Average estimated value of townhouses or other attached units in 2022 (20.9% of all units):
This neighborhood: $317,531 city: $322,028
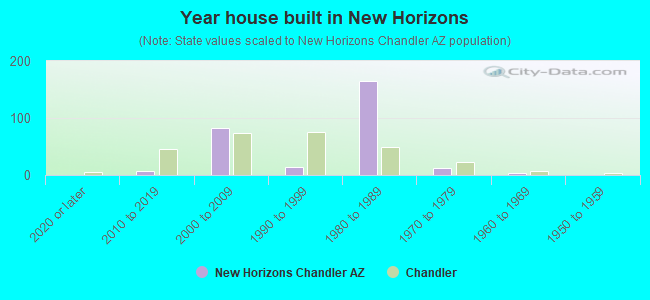
- Year house built in New Horizons
- 02020 or later
- 72010 to 2019
- 822000 to 2009
- 141990 to 1999
- 1651980 to 1989
- 121970 to 1979
- 41960 to 1969
- 01950 to 1959
- 11940 to 1949
- 01939 or earlier
City-data.com crime index for city in 2020 (higher means more crime):
| City: | 165.7 |
| U.S. average: | 219.5 |
Travel time to work (commute)
![Travel time to work (commute)]()
- 2Less than 5 minutes
- 315 to 9 minutes
- 2610 to 14 minutes
- 1915 to 19 minutes
- 2420 to 24 minutes
- 2025 to 29 minutes
- 1030 to 34 minutes
- 735 to 39 minutes
- 540 to 44 minutes
- 545 to 59 minutes
- 460 to 89 minutes
- 390 or more minutes

Means of transportation to work
![Means of transportation to work]()
- 71.2%157Drove a car alone
- 5.4%12Carpooled
- 15.9%35Bus
- 0.9%2Motorcycle
- 3.6%8Bicycle
- 0.5%1Walked
- 6.8%15Other means
- 22.7%50Worked at home

Time leaving home to go to work
![Time leaving home to go to work]()
- 412:00 a.m. to 4:59 a.m.
- 55:00 a.m. to 5:29 a.m.
- 25:30 a.m. to 5:59 a.m.
- 206:00 a.m. to 6:29 a.m.
- 136:30 a.m. to 6:59 a.m.
- 347:00 a.m. to 7:29 a.m.
- 287:30 a.m. to 7:59 a.m.
- 118:00 a.m. to 8:29 a.m.
- 128:30 a.m. to 8:59 a.m.
- 69:00 a.m. to 9:59 a.m.
- 210:00 a.m. to 10:59 a.m.
- 111:00 a.m. to 11:59 a.m.
- 2012:00 p.m. to 3:59 p.m.
- 24:00 p.m. to 11:59 p.m.

Occupations of males:
- Percentage of males in management occupations (except farmers):
Here: 10.2% city: 13.0%
- Percentage of males in computer and mathematical occupations:
Here: 11.7% city: 8.4%
- Percentage of males in architecture and engineering occupations:
Here: 4.1% city: 9.9%
- Percentage of males in community and social services occupations:
Here: 1.9% city: 0.9%
- Percentage of males in service occupations:
Here: 7.0% city: 11.0%
- Percentage of males in sales and office occupations:
Here: 23.4% city: 17.8%
- Percentage of males in construction, extraction, and maintenance occupations:
Here: 8.3% city: 5.9%
- Percentage of males in production occupations:
Here: 11.0% city: 4.4%
- Percentage of males in transportation occupations:
Here: 16.9% city: 3.6%
- Percentage of males in material moving occupations:
Here: 1.9% city: 3.9%
Occupations of females:
- Percentage of females in management occupations (except farmers):
Here: 34.9% city: 11.0%
- Percentage of females in business and financial operations occupations:
Here: 3.9% city: 9.3%
- Percentage of females in computer and mathematical occupations:
Here: 6.8% city: 3.8%
- Percentage of females in life, physical, and social science occupations:
Here: 2.1% city: 0.9%
- Percentage of females in community and social services occupations:
Here: 1.8% city: 2.1%
- Percentage of females in legal occupations:
Here: 7.2% city: 1.3%
- Percentage of females in education, training, and library occupations:
Here: 7.5% city: 8.7%
- Percentage of females in arts, design, entertainment, sports, and media occupations:
Here: 4.7% city: 2.1%
- Percentage of females in healthcare practitioners and technical occupations:
Here: 2.8% city: 9.8%
- Percentage of females in service occupations:
Here: 5.7% city: 15.2%
- Percentage of females in sales and office occupations:
Here: 22.9% city: 28.7%
- Percentage of females in production occupations:
Here: 4.3% city: 2.0%
Percentage of people 16-64 in Armed Forces:
| New Horizons: | 0.7% |
| Chandler: | 0.1% |
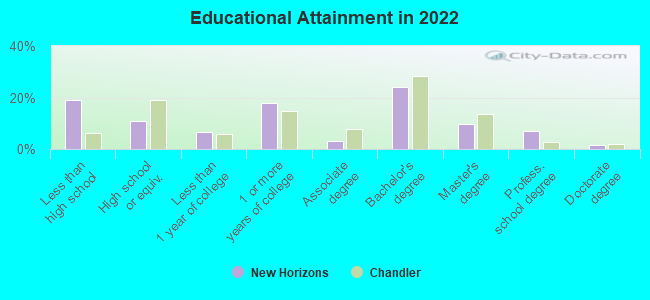
Education in this neighborhood (subdivision or community):
- Percentage of people 3 years and older in K-12 schools:
New Horizons: 22.2% Chandler: 19.1%
- Percentage of people 3 years and older in undergraduate colleges:
New Horizons: 1.4% Chandler: 4.5%
- Percentage of people 3 years and older in grad. or professional schools:
New Horizons: 1.4% Chandler: 1.8%
- Percentage of students K-12 enrolled in private schools:
New Horizons: 56.7% Chandler: 14.2%
Percentage of population below poverty level:
| New Horizons: | 3.3% |
| Chandler: | 7.6% |
Median year owner moved in (as recorded in 2022):
Median year renter moved in (as recorded in 2022):
| New Horizons: | 2004 |
| Chandler: | 2013 |
Median year renter moved in (as recorded in 2022):
| New Horizons: | 2018 |
| Chandler: | 2020 |
Percentage of married-couple families with both working:
| New Horizons: | 86.5% |
| Chandler: | 68.1% |
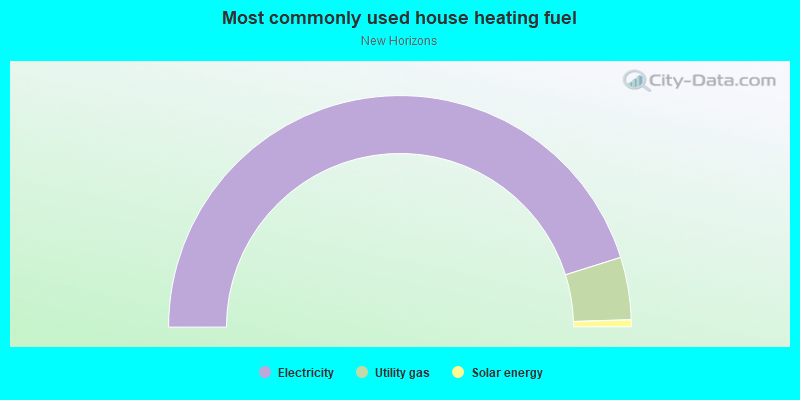
- 90.3%Electricity
- 8.7%Utility gas
- 1.0%Solar energy
Roads and streets:
North Dakota St
Length: 0.38 miles
Directions: N-S, SE-NW, SW-NE
Address range: 3000 to 3499
Directions: N-S, SE-NW, SW-NE
Address range: 3000 to 3499
W Boxelder Pl
Length: 0.32 miles
Directions: E-W, SE-NW, SW-NE
Address range: 300 to 515
Directions: E-W, SE-NW, SW-NE
Address range: 300 to 515
W Straford Dr
Length: 0.27 miles
Directions: E-W, SE-NW
Address range: 300 to 499
Directions: E-W, SE-NW
Address range: 300 to 499
N Nebraska St
Length: 0.25 miles
Directions: N-S, SE-NW, SW-NE
Address range: 3000 to 3499
Directions: N-S, SE-NW, SW-NE
Address range: 3000 to 3499
W Curry St
Length: 0.24 miles
Directions: E-W, SW-NE
Address range: 300 to 499
Directions: E-W, SW-NE
Address range: 300 to 499
W Chilton St
Length: 0.20 miles
Directions: E-W, SW-NE
Address range: 300 to 499
Directions: E-W, SW-NE
Address range: 300 to 499
W Elliot Rd
Length: 0.17 miles
Direction: E-W
Address range: 244 to 399
Direction: E-W
Address range: 244 to 399
W Bentrup St
Length: 0.16 miles
Directions: E-W, SE-NW, SW-NE
Address range: 300 to 415
Directions: E-W, SE-NW, SW-NE
Address range: 300 to 415
W Crofton St
Length: 0.16 miles
Directions: E-W, SW-NE
Address range: 300 to 499
Directions: E-W, SW-NE
Address range: 300 to 499
N Nebraska Ct
Length: 0.09 miles
Directions: N-S, SE-NW, SW-NE
Address range: 3000 to 3499
Directions: N-S, SE-NW, SW-NE
Address range: 3000 to 3499
W McNair St
Length: 0.03 miles
Directions: E-W, SE-NW
Address range: 300 to 306
Directions: E-W, SE-NW
Address range: 300 to 306
N Curry St
Length: 0.01 miles
Direction: N-S
Address range: 3306 to 3311
Direction: N-S
Address range: 3306 to 3311