Neighborhood R (R) neighborhood in Rohnert Park, California (CA), 94928 detailed profile
Settings
X


Business Search - 14 Million verified businesses
Area: 0.090 square miles
Population: 156
Population density:
| Neighborhood R (R): | 1,738 people per square mile |
| Rohnert Park: | 6,910 people per square mile |

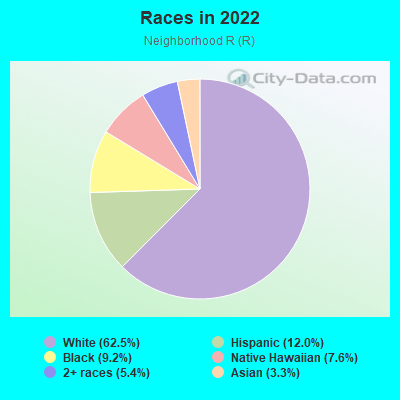
- 11562.5%White
- 2212.0%Hispanic or Latino
- 179.2%Black
- 147.6%Native Hawaiian and Other
Pacific Islander - 105.4%Two or more races
- 63.3%Asian
Median household income in 2022:
| Neighborhood R (R): | $113,148 |
| Rohnert Park: | $93,322 |
Distribution of median household income
![Distribution of median household income]()
- 3Less than $10,000
- 28$10,000 to $19,999
- 25$20,000 to $29,999
- 33$30,000 to $39,999
- 3$40,000 to $49,999
- 21$50,000 to $59,999
- 2$60,000 to $74,999
- 8$75,000 to $99,999
- 7$100,000 to $124,999
- 4$125,000 to $149,999
- 6$150,000 to $199,999
- 15$200,000 or more

Distribution of owner-occupied house/condo value
![Distribution of owner-occupied house/condo value]()
- 7$50,000 to $99,999
- 17$250,000 to $299,999
- 10$300,000 to $399,999
- 83$400,000 to $499,999
- 13$500,000 to $749,999
- 17$750,000 to $999,999
- 10$1,000,000 or more

Distribution of rent paid by renters
![Distribution of rent paid by renters]()
- 7$600 to $699
- 21$1,000 to $1,249
- 12$1,250 to $1,499
- 26$1,500 to $1,999
- 19$2,000 or more

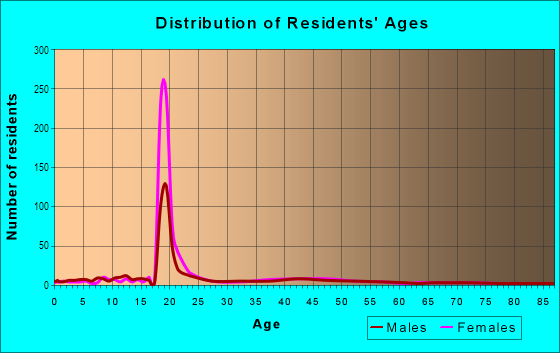
| Males: | 84 |
| Females: | 72 |
Males:
| This neighborhood: | 33.5 years |
| Whole city: | 35.9 years |
| This neighborhood: | 33.3 years |
| Whole city: | 34.5 years |
Average household size:
| Neighborhood R (R): | 2.6 people |
| Rohnert Park: | 2.6 people |
Percentage of family households:
| Neighborhood R (R): | 58.1% |
| Rohnert Park: | 43.9% |
| Here: | 62.4% |
| Rohnert Park: | 43.1% |
Percentage of married-couple families with children (among all households):
| Neighborhood R (R): | 20.4% |
| Rohnert Park: | 24.7% |
Percentage of single-mother households (among all households):
| Neighborhood R (R): | 3.7% |
| Rohnert Park: | 10.3% |
Percentage of never married males 15 years old and over:
Percentage of never married females 15 years old and over:
| Neighborhood R (R): | 29.3% |
| Rohnert Park: | 20.3% |
Percentage of never married females 15 years old and over:
| Neighborhood R (R): | 12.9% |
| city: | 21.1% |
Percentage of people that speak English not well or not at all:
| Neighborhood R (R): | 1.3% |
| Rohnert Park: | 3.7% |
Percentage of people born in this state:
Percentage of people born in another U.S. state:
Percentage of native residents but born outside the U.S.:
Percentage of foreign born residents:
| Here: | 68.2% |
| Rohnert Park: | 65.7% |
Percentage of people born in another U.S. state:
| Neighborhood R (R): | 18.1% |
| Rohnert Park: | 18.6% |
Percentage of native residents but born outside the U.S.:
| Here: | 0.3% |
| city: | 1.1% |
Percentage of foreign born residents:
| Here: | 13.3% |
| Rohnert Park: | 14.5% |
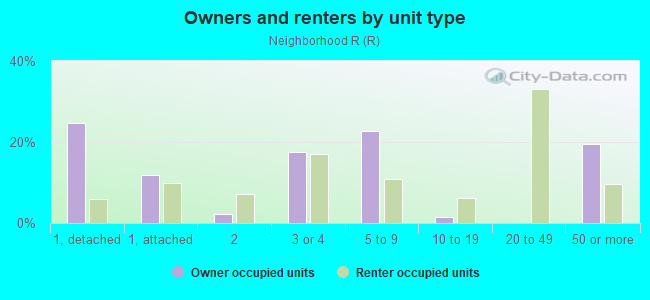
Owner-occupied
Renter-occupied

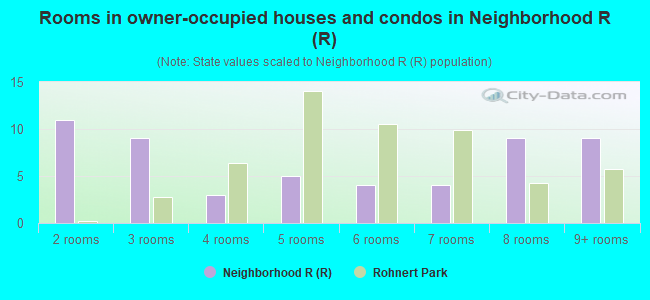
- Rooms in owner-occupied houses and condos in Neighborhood R <
> - 01 room
- 112 rooms
- 93 rooms
- 34 rooms
- 55 rooms
- 46 rooms
- 47 rooms
- 98 rooms
- 99+ rooms
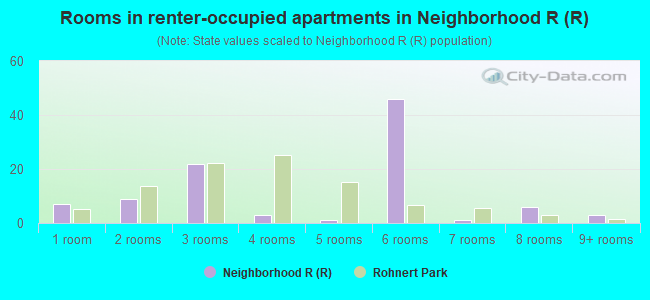
- Rooms in renter-occupied apartments in Neighborhood R <
> - 71 room
- 92 rooms
- 223 rooms
- 34 rooms
- 15 rooms
- 466 rooms
- 17 rooms
- 68 rooms
- 39+ rooms
Owner-occupied
Renter-occupied
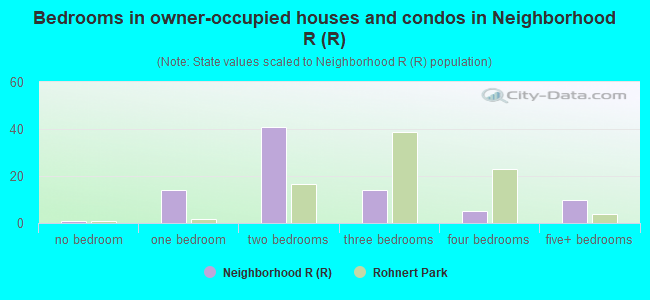
- Bedrooms in owner-occupied houses and condos in Neighborhood R <
> - 1no bedroom
- 141 bedroom
- 412 bedrooms
- 143 bedrooms
- 54 bedrooms
- 105+ bedrooms
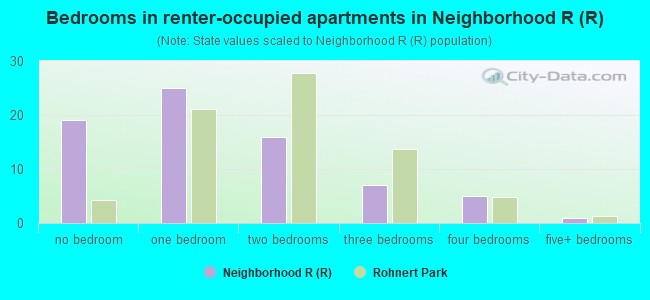
- Bedrooms in renter-occupied apartments in Neighborhood R <
> - 19no bedroom
- 251 bedroom
- 162 bedrooms
- 73 bedrooms
- 54 bedrooms
- 15+ bedrooms
Average number of cars or other vehicles available in houses/condos:
Average number of cars or other vehicles available in apartments:
| This neighborhood: | 2.4 |
| Rohnert Park: | 2.3 |
Average number of cars or other vehicles available in apartments:
| Here: | 2.6 |
| city: | 1.9 |
Percentage of units with a mortgage:
| Neighborhood R (R): | 61.6% |
| Rohnert Park: | 69.0% |
Housing prices:
- Average estimated value of detached houses in 2022 (53.2% of all units):
Neighborhood R (R): $826,787 Rohnert Park: $718,881
- Average estimated value of townhouses or other attached units in 2022 (34.0% of all units):
This neighborhood: $501,032 city: $452,176
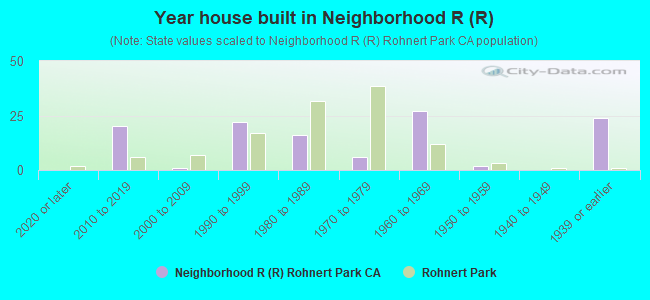
- Year house built in Neighborhood R <
> - 02020 or later
- 202010 to 2019
- 12000 to 2009
- 221990 to 1999
- 161980 to 1989
- 61970 to 1979
- 271960 to 1969
- 21950 to 1959
- 01940 to 1949
- 241939 or earlier
City-data.com crime index for city in 2020 (higher means more crime):
| City: | 266.5 |
| U.S. average: | 219.5 |
Travel time to work (commute)
![Travel time to work (commute)]()
- 4Less than 5 minutes
- 245 to 9 minutes
- 2110 to 14 minutes
- 2815 to 19 minutes
- 3120 to 24 minutes
- 725 to 29 minutes
- 1430 to 34 minutes
- 635 to 39 minutes
- 340 to 44 minutes
- 645 to 59 minutes
- 660 to 89 minutes
- 290 or more minutes

Means of transportation to work
![Means of transportation to work]()
- 75.8%78Drove a car alone
- 5.8%6Carpooled
- 1.9%2Bus
- 1.0%1Subway or elevated rail
- 3.9%4Long-distance train or commuter rail
- 18.5%19Taxi
- 5.8%6Bicycle
- 3.9%4Walked
- 1.0%1Other means
- 6.8%7Worked at home

Time leaving home to go to work
![Time leaving home to go to work]()
- 412:00 a.m. to 4:59 a.m.
- 35:00 a.m. to 5:29 a.m.
- 95:30 a.m. to 5:59 a.m.
- 76:00 a.m. to 6:29 a.m.
- 166:30 a.m. to 6:59 a.m.
- 147:00 a.m. to 7:29 a.m.
- 227:30 a.m. to 7:59 a.m.
- 208:00 a.m. to 8:29 a.m.
- 68:30 a.m. to 8:59 a.m.
- 139:00 a.m. to 9:59 a.m.
- 610:00 a.m. to 10:59 a.m.
- 611:00 a.m. to 11:59 a.m.
- 1912:00 p.m. to 3:59 p.m.
- 114:00 p.m. to 11:59 p.m.

Occupations of males:
- Percentage of males in management occupations (except farmers):
Here: 11.5% city: 10.9%
- Percentage of males in business and financial operations occupations:
Here: 6.0% city: 3.0%
- Percentage of males in computer and mathematical occupations:
Here: 2.7% city: 4.9%
- Percentage of males in architecture and engineering occupations:
Here: 8.5% city: 2.7%
- Percentage of males in arts, design, entertainment, sports, and media occupations:
Here: 4.4% city: 1.7%
- Percentage of males in service occupations:
Here: 39.1% city: 20.6%
- Percentage of males in sales and office occupations:
Here: 7.1% city: 16.7%
- Percentage of males in construction, extraction, and maintenance occupations:
Here: 3.9% city: 15.5%
- Percentage of males in production occupations:
Here: 8.6% city: 3.8%
- Percentage of males in material moving occupations:
Here: 4.8% city: 4.2%
Occupations of females:
- Percentage of females in management occupations (except farmers):
Here: 13.8% city: 7.5%
- Percentage of females in business and financial operations occupations:
Here: 4.6% city: 5.5%
- Percentage of females in community and social services occupations:
Here: 2.1% city: 3.6%
- Percentage of females in education, training, and library occupations:
Here: 7.8% city: 9.5%
- Percentage of females in healthcare practitioners and technical occupations:
Here: 11.6% city: 8.1%
- Percentage of females in service occupations:
Here: 22.5% city: 24.0%
- Percentage of females in sales and office occupations:
Here: 33.4% city: 30.9%
- Percentage of females in material moving occupations:
Here: 1.8% city: 1.2%
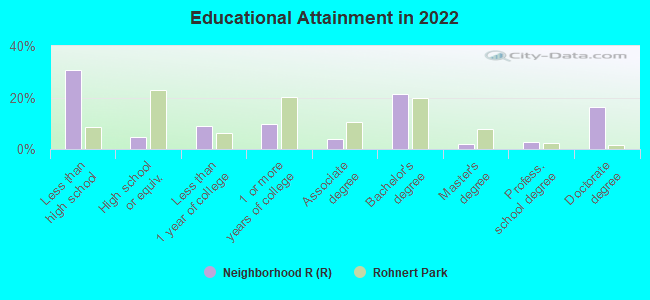
Education in this neighborhood (subdivision or community):
- Percentage of people 3 years and older in K-12 schools:
Neighborhood R (R): 25.8% Rohnert Park: 15.1%
- Percentage of people 3 years and older in undergraduate colleges:
Neighborhood R (R): 18.5% Rohnert Park: 10.5%
- Percentage of people 3 years and older in grad. or professional schools:
Neighborhood R (R): 3.3% Rohnert Park: 0.9%
- Percentage of students K-12 enrolled in private schools:
Neighborhood R (R): 5.1% Rohnert Park: 4.1%
Percentage of population below poverty level:
| Neighborhood R (R): | 13.2% |
| Rohnert Park: | 9.7% |
Median year owner moved in (as recorded in 2022):
| Neighborhood R (R): | 2001 |
| Rohnert Park: | 2008 |
Percentage of married-couple families with both working:
| Neighborhood R (R): | 85.8% |
| Rohnert Park: | 74.9% |
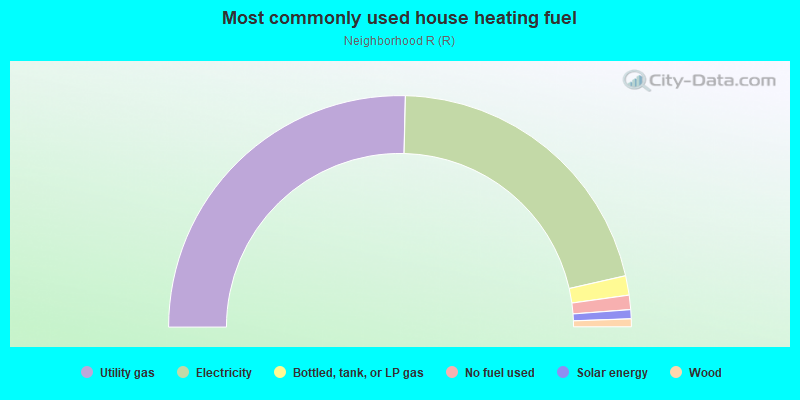
- 50.8%Utility gas
- 42.2%Electricity
- 2.7%Bottled, tank, or LP gas
- 2.0%No fuel used
- 1.3%Solar energy
- 1.1%Wood
Roads and streets:
E Cotati Ave
Length: 0.72 miles
Direction: E-W
Address range: 1600 to 1699
Direction: E-W
Address range: 1600 to 1699
Snyder Ln
Length: 0.51 miles
Directions: N-S, SE-NW
Address range: 7200 to 7299
Directions: N-S, SE-NW
Address range: 7200 to 7299
Roman Dr
Length: 0.42 miles
Directions: E-W, N-S, SE-NW, SW-NE
Address range: 1400 to 1499
Directions: E-W, N-S, SE-NW, SW-NE
Address range: 1400 to 1499
Rosana Way
Length: 0.40 miles
Directions: E-W, SW-NE
Address range: 1300 to 1399
Directions: E-W, SW-NE
Address range: 1300 to 1399
Regents Cir
Length: 0.36 miles
Directions: E-W, N-S
Address range: 1 to 99
Directions: E-W, N-S
Address range: 1 to 99
Roxanne Ln
Length: 0.29 miles
Directions: E-W, N-S, SE-NW, SW-NE
Address range: 7200 to 7399
Directions: E-W, N-S, SE-NW, SW-NE
Address range: 7200 to 7399
Rasmussen Way
Length: 0.19 miles
Directions: N-S, SE-NW
Address range: 7300 to 7399
Directions: N-S, SE-NW
Address range: 7300 to 7399
Rebecca Way
Length: 0.08 miles
Directions: N-S, SE-NW, SW-NE
Address range: 1300 to 1399
Directions: N-S, SE-NW, SW-NE
Address range: 1300 to 1399
Ruby Ct
Length: 0.08 miles
Direction: N-S
Address range: 7200 to 7299
Direction: N-S
Address range: 7200 to 7299
Rosie Ct
Length: 0.05 miles
Direction: E-W
Address range: 1300 to 1399
Direction: E-W
Address range: 1300 to 1399
Reba Way
Length: 0.04 miles
Direction: N-S
Address range: 7300 to 7399
Direction: N-S
Address range: 7300 to 7399