Neighborhood B (B) neighborhood in Rohnert Park, California (CA), 94928, 94931 detailed profile
Settings
X


Business Search - 14 Million verified businesses
Area: 0.547 square miles
Population: 5,251
Population density:
| Neighborhood B (B): | 9,592 people per square mile |
| Rohnert Park: | 6,910 people per square mile |

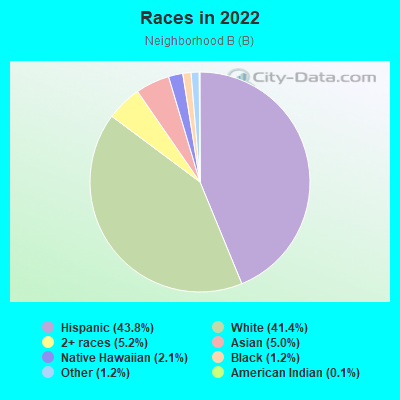
- 2,41943.8%Hispanic or Latino
- 2,28841.4%White
- 2875.2%Two or more races
- 2755.0%Asian
- 1142.1%Native Hawaiian and Other
Pacific Islander - 681.2%Black
- 651.2%Some other race
- 80.1%American Indian
Median household income in 2022:
| Neighborhood B (B): | $84,782 |
| Rohnert Park: | $93,322 |
Distribution of median household income
![Distribution of median household income]()
- 104Less than $10,000
- 187$10,000 to $19,999
- 132$20,000 to $29,999
- 177$30,000 to $39,999
- 213$40,000 to $49,999
- 195$50,000 to $59,999
- 181$60,000 to $74,999
- 334$75,000 to $99,999
- 164$100,000 to $124,999
- 181$125,000 to $149,999
- 133$150,000 to $199,999
- 132$200,000 or more

Distribution of owner-occupied house/condo value
![Distribution of owner-occupied house/condo value]()
- 82Less than $50,000
- 309$50,000 to $99,999
- 47$100,000 to $149,999
- 108$150,000 to $199,999
- 155$200,000 to $249,999
- 62$250,000 to $299,999
- 107$300,000 to $399,999
- 209$400,000 to $499,999
- 590$500,000 to $749,999
- 90$750,000 to $999,999
- 131$1,000,000 or more

Distribution of rent paid by renters
![Distribution of rent paid by renters]()
- 33$100 to $199
- 120$200 to $299
- 195$300 to $399
- 12$400 to $499
- 207$500 to $599
- 25$600 to $699
- 55$700 to $799
- 19$800 to $899
- 127$900 to $999
- 111$1,000 to $1,249
- 190$1,250 to $1,499
- 338$1,500 to $1,999
- 365$2,000 or more

Median rent in 2022:
| Neighborhood B (B): | $1,708 |
| Rohnert Park: | $1,984 |
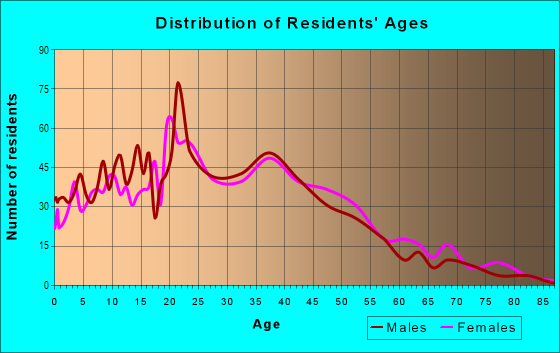
| Males: | 2,603 |
| Females: | 2,648 |
Males:
| This neighborhood: | 34.2 years |
| Whole city: | 35.9 years |
| This neighborhood: | 32.7 years |
| Whole city: | 34.5 years |
Average household size:
| Neighborhood B (B): | 2.6 people |
| Rohnert Park: | 2.6 people |
Percentage of family households:
| Neighborhood B (B): | 52.2% |
| Rohnert Park: | 43.9% |
| Here: | 45.8% |
| Rohnert Park: | 43.1% |
Percentage of married-couple families with children (among all households):
| Neighborhood B (B): | 20.6% |
| Rohnert Park: | 24.7% |
Percentage of single-mother households (among all households):
| Neighborhood B (B): | 12.7% |
| Rohnert Park: | 10.3% |
Percentage of never married males 15 years old and over:
Percentage of never married females 15 years old and over:
| Neighborhood B (B): | 24.3% |
| Rohnert Park: | 20.3% |
Percentage of never married females 15 years old and over:
| Neighborhood B (B): | 18.9% |
| city: | 21.1% |
Percentage of people that speak English not well or not at all:
| Neighborhood B (B): | 7.7% |
| Rohnert Park: | 3.7% |
Percentage of people born in this state:
Percentage of people born in another U.S. state:
Percentage of native residents but born outside the U.S.:
Percentage of foreign born residents:
| Here: | 67.5% |
| Rohnert Park: | 65.7% |
Percentage of people born in another U.S. state:
| Neighborhood B (B): | 10.9% |
| Rohnert Park: | 18.6% |
Percentage of native residents but born outside the U.S.:
| Here: | 0.3% |
| city: | 1.1% |
Percentage of foreign born residents:
| Here: | 21.3% |
| Rohnert Park: | 14.5% |
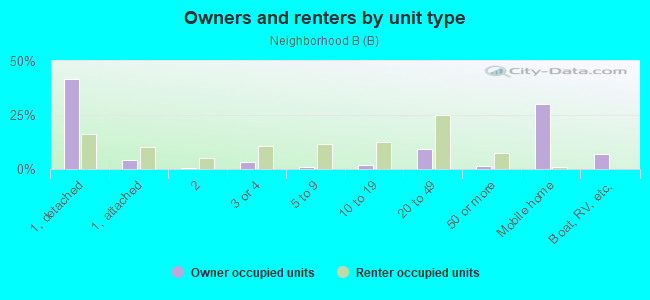
Owner-occupied
Renter-occupied

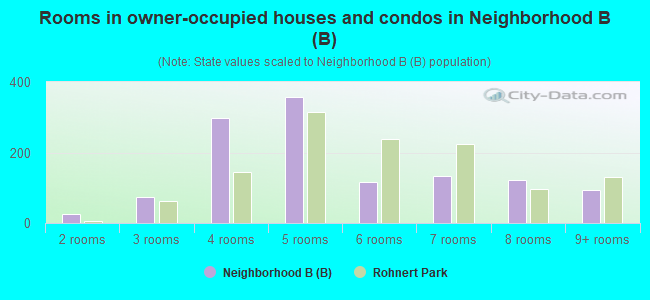
- Rooms in owner-occupied houses and condos in Neighborhood B <>
- 01 room
- 252 rooms
- 743 rooms
- 2984 rooms
- 3585 rooms
- 1166 rooms
- 1337 rooms
- 1228 rooms
- 939+ rooms
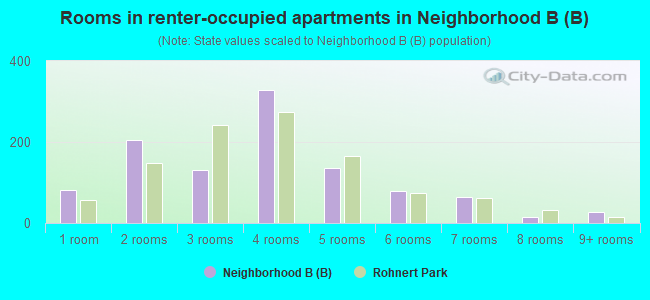
- Rooms in renter-occupied apartments in Neighborhood B <>
- 811 room
- 2062 rooms
- 1323 rooms
- 3284 rooms
- 1375 rooms
- 796 rooms
- 657 rooms
- 148 rooms
- 279+ rooms
Owner-occupied
Renter-occupied
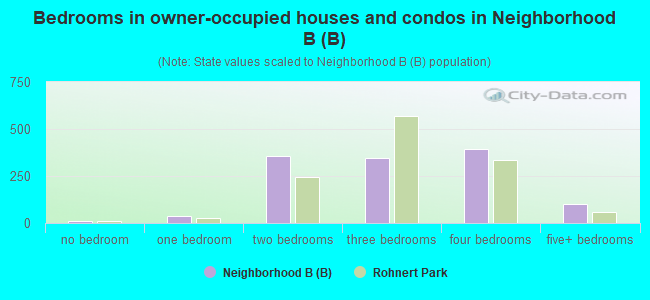
- Bedrooms in owner-occupied houses and condos in Neighborhood B <>
- 13no bedroom
- 371 bedroom
- 3562 bedrooms
- 3473 bedrooms
- 3924 bedrooms
- 1005+ bedrooms
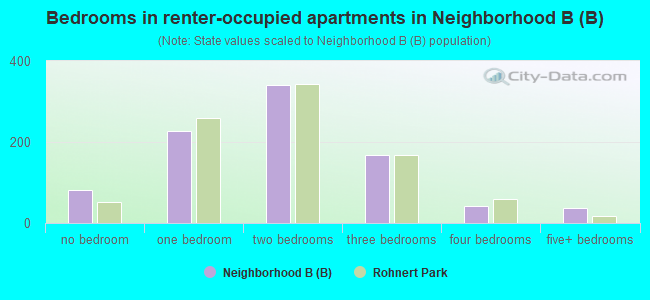
- Bedrooms in renter-occupied apartments in Neighborhood B <>
- 81no bedroom
- 2281 bedroom
- 3412 bedrooms
- 1683 bedrooms
- 434 bedrooms
- 385+ bedrooms
Average number of cars or other vehicles available in houses/condos:
Average number of cars or other vehicles available in apartments:
| This neighborhood: | 2.3 |
| Rohnert Park: | 2.3 |
Average number of cars or other vehicles available in apartments:
| Here: | 1.8 |
| city: | 1.9 |
Percentage of units with a mortgage:
| Neighborhood B (B): | 67.6% |
| Rohnert Park: | 69.0% |
Average estimated value of detached houses in 2022 (50.7% of all units):
| Neighborhood B (B): | $783,370 |
| Rohnert Park: | $718,881 |
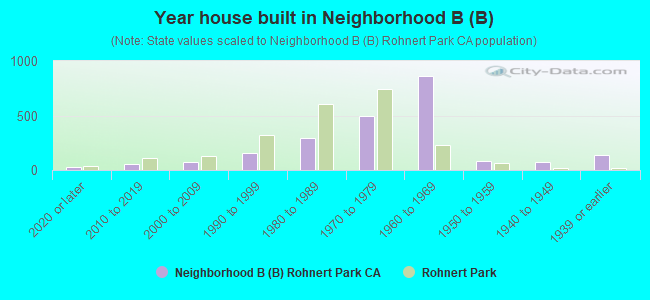
- Year house built in Neighborhood B <>
- 242020 or later
- 552010 to 2019
- 752000 to 2009
- 1561990 to 1999
- 2891980 to 1989
- 4971970 to 1979
- 8661960 to 1969
- 821950 to 1959
- 771940 to 1949
- 1421939 or earlier
City-data.com crime index for city in 2020 (higher means more crime):
| City: | 266.5 |
| U.S. average: | 219.5 |
Travel time to work (commute)
![Travel time to work (commute)]()
- 74Less than 5 minutes
- 1425 to 9 minutes
- 25710 to 14 minutes
- 45515 to 19 minutes
- 29920 to 24 minutes
- 12425 to 29 minutes
- 29530 to 34 minutes
- 4335 to 39 minutes
- 6040 to 44 minutes
- 13745 to 59 minutes
- 17160 to 89 minutes
- 4190 or more minutes

Means of transportation to work
![Means of transportation to work]()
- 78.0%1,881Drove a car alone
- 10.6%255Carpooled
- 0.9%22Bus
- 1.2%28Subway or elevated rail
- 4.1%98Long-distance train or commuter rail
- 4.8%116Taxi
- 1.7%40Motorcycle
- 1.9%45Bicycle
- 1.6%38Walked
- 5.5%132Other means
- 6.6%159Worked at home

Time leaving home to go to work
![Time leaving home to go to work]()
- 16112:00 a.m. to 4:59 a.m.
- 365:00 a.m. to 5:29 a.m.
- 1165:30 a.m. to 5:59 a.m.
- 2036:00 a.m. to 6:29 a.m.
- 1206:30 a.m. to 6:59 a.m.
- 3187:00 a.m. to 7:29 a.m.
- 3717:30 a.m. to 7:59 a.m.
- 2158:00 a.m. to 8:29 a.m.
- 1378:30 a.m. to 8:59 a.m.
- 1589:00 a.m. to 9:59 a.m.
- 2210:00 a.m. to 10:59 a.m.
- 2911:00 a.m. to 11:59 a.m.
- 9212:00 p.m. to 3:59 p.m.
- 1114:00 p.m. to 11:59 p.m.

Occupations of males:
- Percentage of males in management occupations (except farmers):
Here: 16.2% city: 10.9%
- Percentage of males in business and financial operations occupations:
Here: 3.0% city: 3.0%
- Percentage of males in computer and mathematical occupations:
Here: 1.4% city: 4.9%
- Percentage of males in architecture and engineering occupations:
Here: 1.7% city: 2.7%
- Percentage of males in education, training, and library occupations:
Here: 2.5% city: 1.7%
- Percentage of males in arts, design, entertainment, sports, and media occupations:
Here: 1.4% city: 1.7%
- Percentage of males in healthcare practitioners and technical occupations:
Here: 2.5% city: 3.6%
- Percentage of males in service occupations:
Here: 20.5% city: 20.6%
- Percentage of males in sales and office occupations:
Here: 13.1% city: 16.7%
- Percentage of males in farming, fishing, and forestry occupations:
Here: 1.5% city: 0.5%
- Percentage of males in construction, extraction, and maintenance occupations:
Here: 18.3% city: 15.5%
- Percentage of males in production occupations:
Here: 4.5% city: 3.8%
- Percentage of males in transportation occupations:
Here: 6.7% city: 4.0%
- Percentage of males in material moving occupations:
Here: 4.6% city: 4.2%
Occupations of females:
- Percentage of females in management occupations (except farmers):
Here: 7.1% city: 7.5%
- Percentage of females in business and financial operations occupations:
Here: 9.7% city: 5.5%
- Percentage of females in community and social services occupations:
Here: 1.9% city: 3.6%
- Percentage of females in education, training, and library occupations:
Here: 6.2% city: 9.5%
- Percentage of females in arts, design, entertainment, sports, and media occupations:
Here: 3.6% city: 2.4%
- Percentage of females in healthcare practitioners and technical occupations:
Here: 5.1% city: 8.1%
- Percentage of females in service occupations:
Here: 30.9% city: 24.0%
- Percentage of females in sales and office occupations:
Here: 27.2% city: 30.9%
- Percentage of females in production occupations:
Here: 3.7% city: 2.3%
- Percentage of females in transportation occupations:
Here: 2.0% city: 1.0%
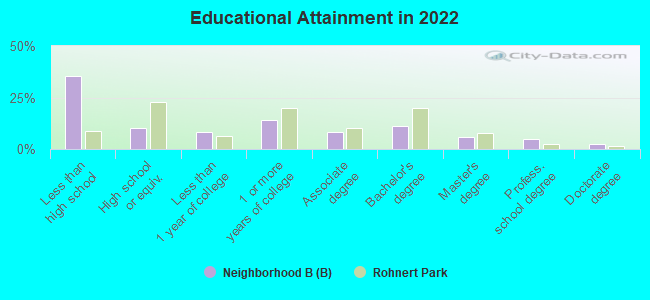
Education in this neighborhood (subdivision or community):
- Percentage of people 3 years and older in K-12 schools:
Neighborhood B (B): 27.6% Rohnert Park: 15.1%
- Percentage of people 3 years and older in undergraduate colleges:
Neighborhood B (B): 7.4% Rohnert Park: 10.5%
- Percentage of people 3 years and older in grad. or professional schools:
Neighborhood B (B): 1.2% Rohnert Park: 0.9%
- Percentage of students K-12 enrolled in private schools:
Neighborhood B (B): 11.7% Rohnert Park: 4.1%
Percentage of population below poverty level:
| Neighborhood B (B): | 13.1% |
| Rohnert Park: | 9.7% |
Median year owner moved in (as recorded in 2022):
Median year renter moved in (as recorded in 2022):
| Neighborhood B (B): | 2006 |
| Rohnert Park: | 2008 |
Median year renter moved in (as recorded in 2022):
| Neighborhood B (B): | 2016 |
| Rohnert Park: | 2017 |
Percentage of married-couple families with both working:
| Neighborhood B (B): | 135.4% |
| Rohnert Park: | 74.9% |
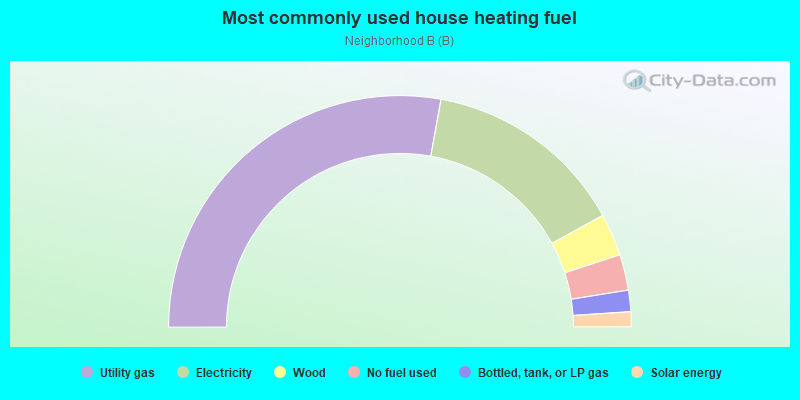
- 55.7%Utility gas
- 28.3%Electricity
- 5.9%Wood
- 5.0%No fuel used
- 3.0%Bottled, tank, or LP gas
- 2.1%Solar energy
Roads and streets:
Southwest Blvd
Length: 1.48 miles
Directions: E-W, SW-NE
Address range: 142 to 599
Directions: E-W, SW-NE
Address range: 142 to 599
Burton Ave
Length: 1.16 miles
Directions: E-W, N-S, SE-NW, SW-NE
Address range: 279 to 7917
Directions: E-W, N-S, SE-NW, SW-NE
Address range: 279 to 7917
E Cotati Ave
Length: 0.95 miles
Directions: E-W, SE-NW, SW-NE
Address range: 174 to 999
Directions: E-W, SE-NW, SW-NE
Address range: 174 to 999
Santa Barbara Dr
Length: 0.88 miles
Directions: E-W, N-S, SE-NW, SW-NE
Address range: 426 to 8155
Directions: E-W, N-S, SE-NW, SW-NE
Address range: 426 to 8155
Bonnie Ave
Length: 0.86 miles
Directions: E-W, N-S, SW-NE
Address range: 301 to 759
Directions: E-W, N-S, SW-NE
Address range: 301 to 759
Adrian Dr
Length: 0.79 miles
Directions: E-W, N-S, SE-NW
Address range: 7300 to 8058
Directions: E-W, N-S, SE-NW
Address range: 7300 to 8058
Beverly Dr
Length: 0.52 miles
Directions: N-S, SE-NW
Address range: 7450 to 8054
Directions: N-S, SE-NW
Address range: 7450 to 8054
Bernice Ave
Length: 0.42 miles
Directions: E-W, N-S, SE-NW, SW-NE
Address range: 667 to 7695
Directions: E-W, N-S, SE-NW, SW-NE
Address range: 667 to 7695
Blair Ave
Length: 0.37 miles
Directions: E-W, N-S, SE-NW, SW-NE
Address range: 7500 to 7899
Directions: E-W, N-S, SE-NW, SW-NE
Address range: 7500 to 7899
Bridgit Dr
Length: 0.32 miles
Directions: E-W, N-S, SE-NW
Address range: 7400 to 7598
Directions: E-W, N-S, SE-NW
Address range: 7400 to 7598
Gravenstein Way
Length: 0.30 miles
Directions: E-W, N-S, SE-NW, SW-NE
Directions: E-W, N-S, SE-NW, SW-NE
College View Dr
Length: 0.29 miles
Directions: E-W, N-S, SE-NW, SW-NE
Directions: E-W, N-S, SE-NW, SW-NE
Boris Ct
Length: 0.28 miles
Directions: E-W, SE-NW, SW-NE
Address range: 7300 to 7555
Directions: E-W, SE-NW, SW-NE
Address range: 7300 to 7555
Miller Cir
Length: 0.26 miles
Directions: E-W, N-S, SE-NW, SW-NE
Directions: E-W, N-S, SE-NW, SW-NE
Belita Ave
Length: 0.26 miles
Directions: E-W, N-S, SE-NW
Address range: 7100 to 7426
Directions: E-W, N-S, SE-NW
Address range: 7100 to 7426
Las Casitas Dr
Length: 0.25 miles
Directions: E-W, N-S, SE-NW, SW-NE
Address range: 1 to 52
Directions: E-W, N-S, SE-NW, SW-NE
Address range: 1 to 52
Bobbie Way
Length: 0.25 miles
Directions: E-W, N-S, SE-NW, SW-NE
Address range: 7445 to 7699
Directions: E-W, N-S, SE-NW, SW-NE
Address range: 7445 to 7699
Ryan Ln
Length: 0.25 miles
Directions: E-W, N-S, SE-NW, SW-NE
Address range: 1 to 99
Directions: E-W, N-S, SE-NW, SW-NE
Address range: 1 to 99
Bruce Ave
Length: 0.24 miles
Directions: N-S, SW-NE
Address range: 272 to 454
Directions: N-S, SW-NE
Address range: 272 to 454
Brett Ave
Length: 0.23 miles
Directions: E-W, N-S, SE-NW, SW-NE
Address range: 700 to 799
Directions: E-W, N-S, SE-NW, SW-NE
Address range: 700 to 799
Barbi Ln
Length: 0.21 miles
Directions: E-W, SE-NW
Address range: 7121 to 7457
Directions: E-W, SE-NW
Address range: 7121 to 7457
Sonoma Ln
Length: 0.21 miles
Directions: E-W, N-S, SE-NW, SW-NE
Address range: 400 to 545
Directions: E-W, N-S, SE-NW, SW-NE
Address range: 400 to 545
Brenda Way
Length: 0.21 miles
Direction: SE-NW
Address range: 7114 to 7419
Direction: SE-NW
Address range: 7114 to 7419
Fiesta Ln
Length: 0.21 miles
Directions: E-W, N-S, SE-NW, SW-NE
Address range: 100 to 154
Directions: E-W, N-S, SE-NW, SW-NE
Address range: 100 to 154
Rio Vista Ln
Length: 0.21 miles
Directions: E-W, N-S, SE-NW, SW-NE
Address range: 299 to 340
Directions: E-W, N-S, SE-NW, SW-NE
Address range: 299 to 340
Beth Ct
Length: 0.20 miles
Directions: E-W, N-S, SE-NW, SW-NE
Address range: 7557 to 7714
Directions: E-W, N-S, SE-NW, SW-NE
Address range: 7557 to 7714
Bernice Ct
Length: 0.19 miles
Directions: E-W, N-S, SE-NW, SW-NE
Address range: 7701 to 7899
Directions: E-W, N-S, SE-NW, SW-NE
Address range: 7701 to 7899
Baron Dr
Length: 0.19 miles
Directions: E-W, SW-NE
Address range: 500 to 566
Directions: E-W, SW-NE
Address range: 500 to 566
Bonita Ave
Length: 0.19 miles
Direction: SE-NW
Address range: 7548 to 7778
Direction: SE-NW
Address range: 7548 to 7778
Loma Verde Ln
Length: 0.13 miles
Directions: N-S, SE-NW
Address range: 500 to 538
Directions: N-S, SE-NW
Address range: 500 to 538
Bernadette Ave
Length: 0.11 miles
Direction: E-W
Address range: 727 to 855
Direction: E-W
Address range: 727 to 855
Greenleaf Ln
Length: 0.11 miles
Directions: E-W, SE-NW, SW-NE
Address range: 1 to 99
Directions: E-W, SE-NW, SW-NE
Address range: 1 to 99
Bay Tree Ct
Length: 0.10 miles
Directions: E-W, N-S, SE-NW, SW-NE
Address range: 1 to 29
Directions: E-W, N-S, SE-NW, SW-NE
Address range: 1 to 29
Barry Ct
Length: 0.09 miles
Direction: SW-NE
Address range: 700 to 754
Direction: SW-NE
Address range: 700 to 754
Baytree Ct
Length: 0.09 miles
Directions: E-W, N-S, SE-NW, SW-NE
Directions: E-W, N-S, SE-NW, SW-NE
Dyquiato Way
Length: 0.09 miles
Directions: N-S, SE-NW
Directions: N-S, SE-NW
Santa Barbara Ct
Length: 0.06 miles
Directions: E-W, SW-NE
Address range: 400 to 499
Directions: E-W, SW-NE
Address range: 400 to 499
Village Ct
Length: 0.06 miles
Directions: E-W, N-S, SE-NW, SW-NE
Address range: 8800 to 8898
Directions: E-W, N-S, SE-NW, SW-NE
Address range: 8800 to 8898
Adobe Ln
Length: 0.05 miles
Directions: E-W, SE-NW
Address range: 200 to 299
Directions: E-W, SE-NW
Address range: 200 to 299
Becky Ct
Length: 0.05 miles
Direction: SE-NW
Address range: 7900 to 7999
Direction: SE-NW
Address range: 7900 to 7999
Burton Ct
Length: 0.04 miles
Directions: N-S, SW-NE
Address range: 200 to 399
Directions: N-S, SW-NE
Address range: 200 to 399
Bonnie Ct
Length: 0.03 miles
Direction: SE-NW
Address range: 356 to 381
Direction: SE-NW
Address range: 356 to 381
Railroad features:
Northwestern Pacific RR
Length: 0.75 miles
Direction: SE-NW
Direction: SE-NW
Other features:
Laguna de Santa Rosa
Length: 0.52 miles
Directions: E-W, N-S, SE-NW
Directions: E-W, N-S, SE-NW