Naglee Park neighborhood in San Jose, California (CA), 95112 detailed profile
Settings
X

Business Search - 14 Million verified businesses
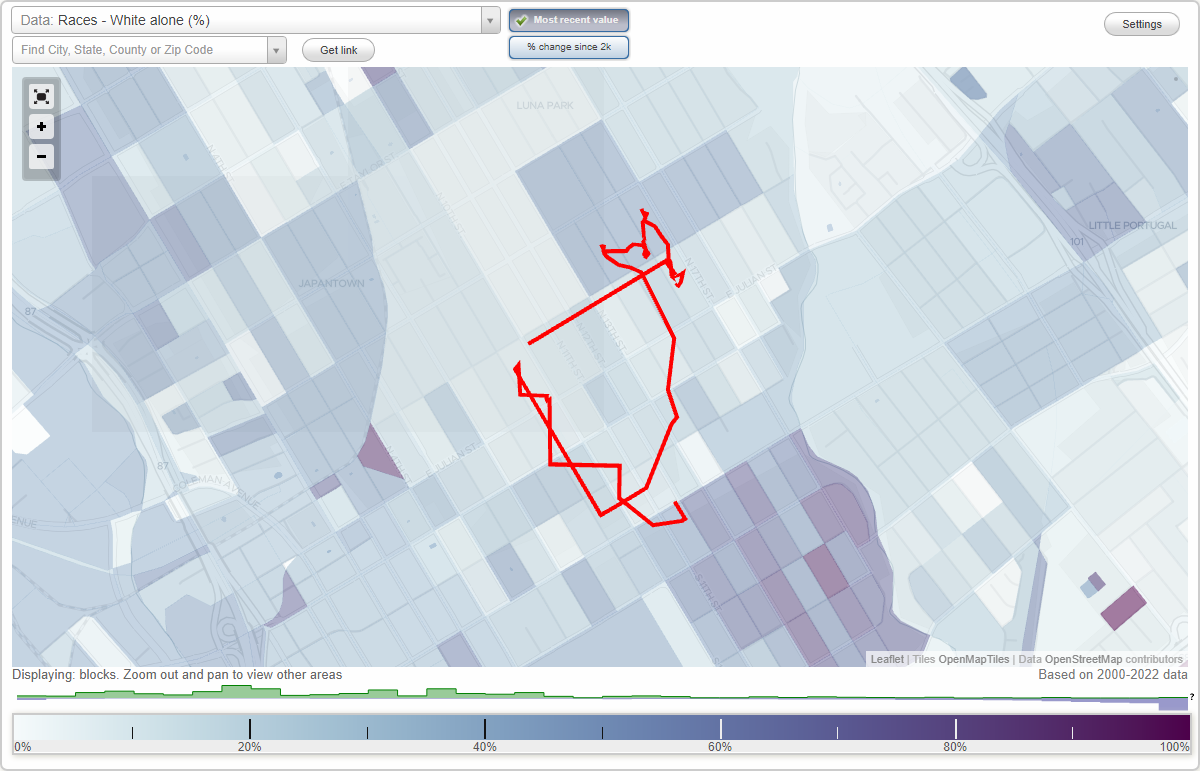
Area: 0.352 square miles
Population: 6,698
Population density:
| Naglee Park: | 19,033 people per square mile |
| San Jose: | 5,554 people per square mile |

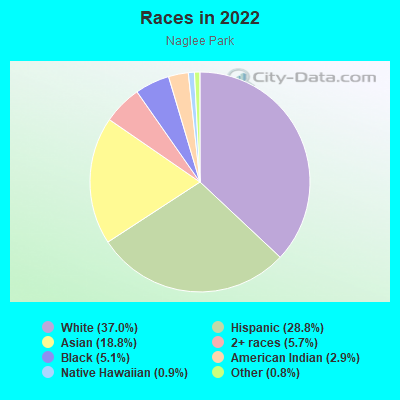
- 2,56237.0%White
- 1,99528.8%Hispanic or Latino
- 1,29818.8%Asian
- 3935.7%Two or more races
- 3525.1%Black
- 2032.9%American Indian
- 590.9%Native Hawaiian and Other
Pacific Islander - 560.8%Some other race
Distribution of median household income
![Distribution of median household income]()
- 96Less than $10,000
- 164$10,000 to $19,999
- 445$20,000 to $29,999
- 246$30,000 to $39,999
- 290$40,000 to $49,999
- 54$50,000 to $59,999
- 77$60,000 to $74,999
- 207$75,000 to $99,999
- 76$100,000 to $124,999
- 132$125,000 to $149,999
- 261$150,000 to $199,999
- 430$200,000 or more

Distribution of owner-occupied house/condo value
![Distribution of owner-occupied house/condo value]()
- 53Less than $50,000
- 44$50,000 to $99,999
- 17$150,000 to $199,999
- 20$200,000 to $249,999
- 77$400,000 to $499,999
- 51$500,000 to $749,999
- 133$750,000 to $999,999
- 662$1,000,000 or more

Distribution of rent paid by renters
![Distribution of rent paid by renters]()
- 15$300 to $399
- 142$500 to $599
- 44$600 to $699
- 27$800 to $899
- 132$900 to $999
- 175$1,000 to $1,249
- 46$1,250 to $1,499
- 327$1,500 to $1,999
- 777$2,000 or more

Median rent in 2022:
| Naglee Park: | $2,424 |
| San Jose: | $2,001 |
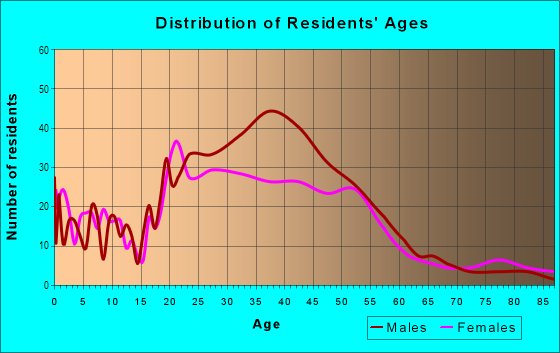
| Males: | 3,323 |
| Females: | 3,374 |
Males:
| This neighborhood: | 41.1 years |
| Whole city: | 37.6 years |
| This neighborhood: | 33.3 years |
| Whole city: | 39.1 years |
Average household size:
| Naglee Park: | 3.1 people |
| San Jose: | 2.9 people |
Percentage of family households:
| Naglee Park: | 48.9% |
| San Jose: | 49.9% |
| Here: | 36.4% |
| San Jose: | 53.0% |
Percentage of married-couple families with children (among all households):
| Naglee Park: | 19.4% |
| San Jose: | 25.8% |
Percentage of single-mother households (among all households):
| Naglee Park: | 10.6% |
| San Jose: | 5.2% |
Percentage of never married males 15 years old and over:
Percentage of never married females 15 years old and over:
| Naglee Park: | 31.3% |
| San Jose: | 20.9% |
Percentage of never married females 15 years old and over:
| Naglee Park: | 32.0% |
| city: | 16.7% |
Percentage of people that speak English not well or not at all:
| Naglee Park: | 3.1% |
| San Jose: | 11.4% |
Percentage of people born in this state:
Percentage of people born in another U.S. state:
Percentage of native residents but born outside the U.S.:
Percentage of foreign born residents:
| Here: | 53.0% |
| San Jose: | 46.1% |
Percentage of people born in another U.S. state:
| Naglee Park: | 22.3% |
| San Jose: | 10.4% |
Percentage of native residents but born outside the U.S.:
| Here: | 5.7% |
| city: | 1.7% |
Percentage of foreign born residents:
| Here: | 19.0% |
| San Jose: | 41.8% |
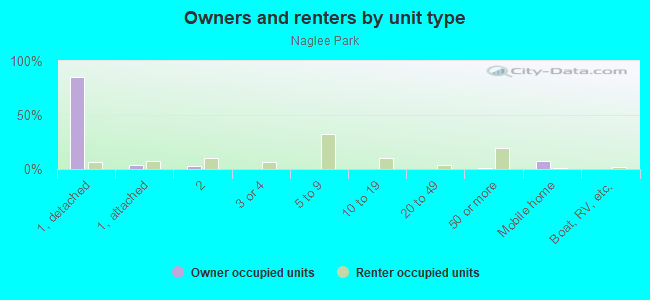
Owner-occupied
Renter-occupied

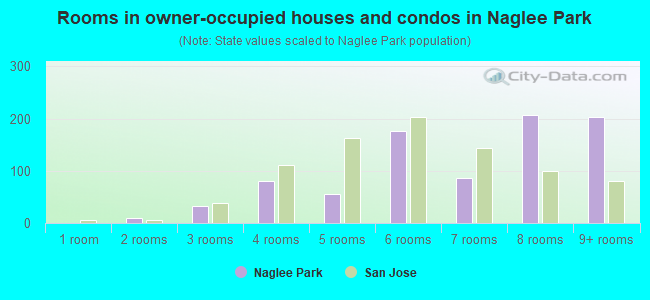
- Rooms in owner-occupied houses and condos in Naglee Park
- 01 room
- 102 rooms
- 323 rooms
- 814 rooms
- 555 rooms
- 1766 rooms
- 877 rooms
- 2078 rooms
- 2039+ rooms
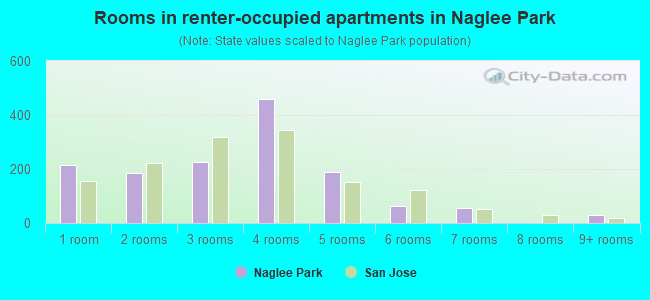
- Rooms in renter-occupied apartments in Naglee Park
- 2141 room
- 1872 rooms
- 2273 rooms
- 4594 rooms
- 1885 rooms
- 626 rooms
- 547 rooms
- 08 rooms
- 289+ rooms
Owner-occupied
Renter-occupied
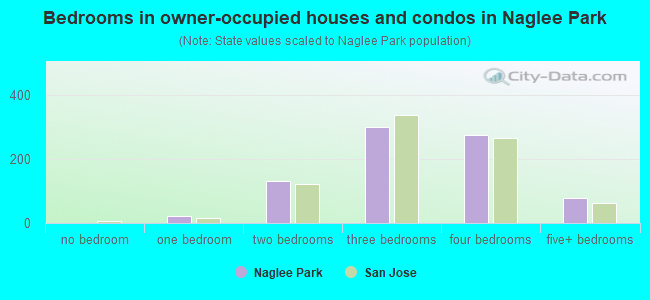
- Bedrooms in owner-occupied houses and condos in Naglee Park
- 0no bedroom
- 231 bedroom
- 1332 bedrooms
- 3023 bedrooms
- 2744 bedrooms
- 775+ bedrooms
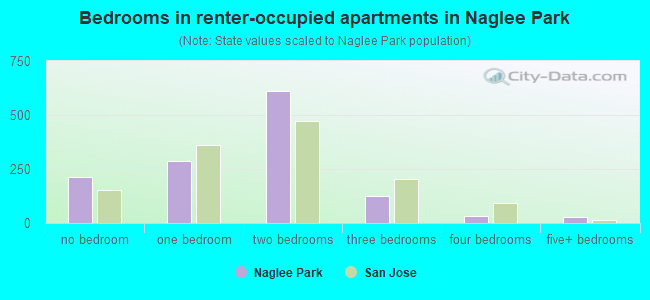
- Bedrooms in renter-occupied apartments in Naglee Park
- 214no bedroom
- 2881 bedroom
- 6112 bedrooms
- 1233 bedrooms
- 324 bedrooms
- 275+ bedrooms
Average number of cars or other vehicles available in houses/condos:
Average number of cars or other vehicles available in apartments:
| This neighborhood: | 2.1 |
| San Jose: | 2.3 |
Average number of cars or other vehicles available in apartments:
| Here: | 1.3 |
| city: | 1.6 |
Percentage of units with a mortgage:
| Naglee Park: | 82.1% |
| San Jose: | 66.9% |
Average estimated value of detached houses in 2022 (46.3% of all units):
| Naglee Park: | $1,524,982 |
| San Jose: | $1,532,815 |
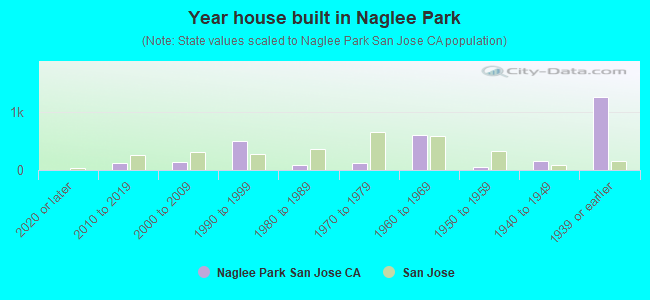
- Year house built in Naglee Park
- 82020 or later
- 1252010 to 2019
- 1362000 to 2009
- 4961990 to 1999
- 821980 to 1989
- 1261970 to 1979
- 6021960 to 1969
- 571950 to 1959
- 1531940 to 1949
- 1,2571939 or earlier
City-data.com crime index for city in 2020 (higher means more crime):
| City: | 268.4 |
| U.S. average: | 219.5 |
Travel time to work (commute)
![Travel time to work (commute)]()
- 24Less than 5 minutes
- 1805 to 9 minutes
- 37010 to 14 minutes
- 29315 to 19 minutes
- 23120 to 24 minutes
- 16725 to 29 minutes
- 19030 to 34 minutes
- 9535 to 39 minutes
- 4040 to 44 minutes
- 12945 to 59 minutes
- 11660 to 89 minutes
- 1290 or more minutes

Means of transportation to work
![Means of transportation to work]()
- 38.2%1,316Drove a car alone
- 7.0%240Carpooled
- 7.6%261Bus
- 1.0%36Subway or elevated rail
- 3.6%123Long-distance train or commuter rail
- 4.6%159Light rail, streetcar or trolley
- 0.8%27Taxi
- 0.2%7Motorcycle
- 5.0%174Bicycle
- 14.9%515Walked
- 6.3%216Other means
- 23.2%801Worked at home

Time leaving home to go to work
![Time leaving home to go to work]()
- 812:00 a.m. to 4:59 a.m.
- 385:00 a.m. to 5:29 a.m.
- 1015:30 a.m. to 5:59 a.m.
- 206:00 a.m. to 6:29 a.m.
- 1146:30 a.m. to 6:59 a.m.
- 1897:00 a.m. to 7:29 a.m.
- 3387:30 a.m. to 7:59 a.m.
- 2808:00 a.m. to 8:29 a.m.
- 2228:30 a.m. to 8:59 a.m.
- 1929:00 a.m. to 9:59 a.m.
- 10610:00 a.m. to 10:59 a.m.
- 3411:00 a.m. to 11:59 a.m.
- 14712:00 p.m. to 3:59 p.m.
- 184:00 p.m. to 11:59 p.m.

Occupations of males:
- Percentage of males in management occupations (except farmers):
Here: 13.5% city: 13.0%
- Percentage of males in business and financial operations occupations:
Here: 4.2% city: 4.6%
- Percentage of males in computer and mathematical occupations:
Here: 13.3% city: 13.6%
- Percentage of males in architecture and engineering occupations:
Here: 7.9% city: 10.2%
- Percentage of males in life, physical, and social science occupations:
Here: 2.1% city: 1.1%
- Percentage of males in education, training, and library occupations:
Here: 9.0% city: 2.8%
- Percentage of males in arts, design, entertainment, sports, and media occupations:
Here: 5.2% city: 1.8%
- Percentage of males in service occupations:
Here: 11.1% city: 12.7%
- Percentage of males in sales and office occupations:
Here: 17.4% city: 12.8%
- Percentage of males in construction, extraction, and maintenance occupations:
Here: 7.4% city: 7.8%
- Percentage of males in production occupations:
Here: 2.1% city: 5.5%
- Percentage of males in transportation occupations:
Here: 4.0% city: 3.6%
Occupations of females:
- Percentage of females in management occupations (except farmers):
Here: 8.1% city: 11.0%
- Percentage of females in business and financial operations occupations:
Here: 7.7% city: 8.6%
- Percentage of females in computer and mathematical occupations:
Here: 2.7% city: 5.4%
- Percentage of females in architecture and engineering occupations:
Here: 1.3% city: 2.8%
- Percentage of females in life, physical, and social science occupations:
Here: 4.2% city: 1.7%
- Percentage of females in legal occupations:
Here: 1.7% city: 1.3%
- Percentage of females in education, training, and library occupations:
Here: 7.4% city: 8.1%
- Percentage of females in arts, design, entertainment, sports, and media occupations:
Here: 2.9% city: 2.0%
- Percentage of females in healthcare practitioners and technical occupations:
Here: 4.8% city: 6.8%
- Percentage of females in service occupations:
Here: 30.2% city: 21.7%
- Percentage of females in sales and office occupations:
Here: 23.0% city: 22.0%
- Percentage of females in production occupations:
Here: 4.0% city: 4.0%
- Percentage of females in material moving occupations:
Here: 1.0% city: 1.5%
Percentage of people 16-64 in Armed Forces:
| Naglee Park: | 0.0% |
| San Jose: | 0.0% |
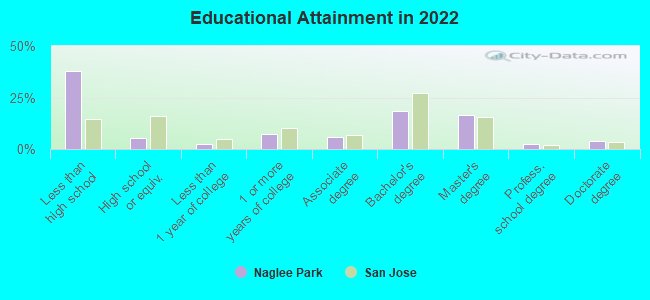
Education in this neighborhood (subdivision or community):
- Percentage of people 3 years and older in K-12 schools:
Naglee Park: 18.5% San Jose: 16.1%
- Percentage of people 3 years and older in undergraduate colleges:
Naglee Park: 30.5% San Jose: 6.5%
- Percentage of people 3 years and older in grad. or professional schools:
Naglee Park: 6.7% San Jose: 2.0%
- Percentage of students K-12 enrolled in private schools:
Naglee Park: 53.7% San Jose: 14.9%
Percentage of population below poverty level:
| Naglee Park: | 20.5% |
| San Jose: | 9.0% |
Median year owner moved in (as recorded in 2022):
| Naglee Park: | 1997 |
| San Jose: | 2008 |
Percentage of married-couple families with both working:
| Naglee Park: | 108.0% |
| San Jose: | 72.5% |
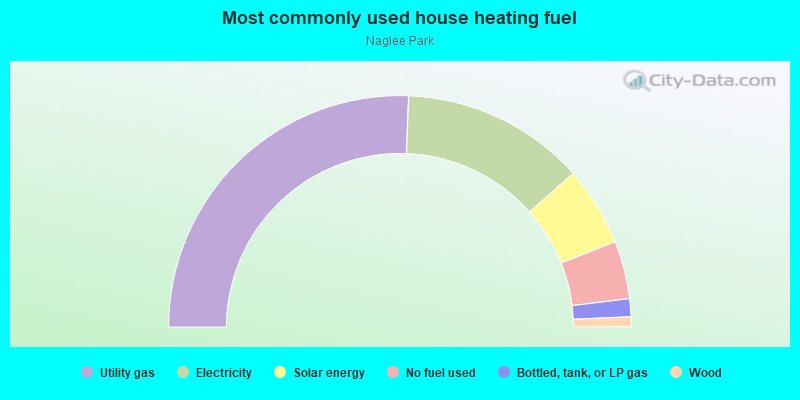
- 51.2%Utility gas
- 25.7%Electricity
- 11.1%Solar energy
- 8.1%No fuel used
- 2.5%Bottled, tank, or LP gas
- 1.4%Wood
Roads and streets:
S 15th St
Length: 0.91 miles
Direction: SE-NW
Address range: 1 to 699
Direction: SE-NW
Address range: 1 to 699
S 16th St
Length: 0.91 miles
Directions: N-S, SE-NW
Address range: 1 to 699
Directions: N-S, SE-NW
Address range: 1 to 699
S 12th St
Length: 0.89 miles
Direction: SE-NW
Address range: 100 to 899
Direction: SE-NW
Address range: 100 to 899
S 13th St
Length: 0.75 miles
Direction: SE-NW
Address range: 100 to 699
Direction: SE-NW
Address range: 100 to 699
S 14th St
Length: 0.75 miles
Direction: SE-NW
Address range: 100 to 699
Direction: SE-NW
Address range: 100 to 699
S 17th St
Length: 0.53 miles
Directions: N-S, SE-NW
Address range: 1 to 399
Directions: N-S, SE-NW
Address range: 1 to 399
E San Antonio St
Length: 0.43 miles
Directions: E-W, SW-NE
Address range: 550 to 839
Directions: E-W, SW-NE
Address range: 550 to 839
E William St
Length: 0.41 miles
Direction: SW-NE
Address range: 550 to 799
Direction: SW-NE
Address range: 550 to 799
E San Fernando St
Length: 0.36 miles
Directions: E-W, SW-NE
Address range: 550 to 799
Directions: E-W, SW-NE
Address range: 550 to 799
E San Carlos St
Length: 0.36 miles
Direction: SW-NE
Address range: 550 to 799
Direction: SW-NE
Address range: 550 to 799
E San Salvador St
Length: 0.32 miles
Directions: N-S, SW-NE
Address range: 550 to 799
Directions: N-S, SW-NE
Address range: 550 to 799
Margaret St
Length: 0.27 miles
Directions: E-W, N-S, SW-NE
Address range: 550 to 799
Directions: E-W, N-S, SW-NE
Address range: 550 to 799
Arroyo Way
Length: 0.23 miles
Directions: E-W, N-S, SE-NW
Address range: 100 to 299
Directions: E-W, N-S, SE-NW
Address range: 100 to 299
E Santa Clara St
Length: 0.18 miles
Direction: SW-NE
Address range: 701 to 849
Direction: SW-NE
Address range: 701 to 849
Orvis Ave
Length: 0.15 miles
Direction: SW-NE
Address range: 500 to 699
Direction: SW-NE
Address range: 500 to 699
E Reed St
Length: 0.14 miles
Direction: SW-NE
Address range: 550 to 699
Direction: SW-NE
Address range: 550 to 699
Other features:
Coyote Crk
Length: 0.68 miles
Directions: E-W, N-S, SE-NW
Directions: E-W, N-S, SE-NW