Munger Place Historic District neighborhood in Dallas, Texas (TX), 75214, 75226, 75246 detailed profile
Settings
X


Business Search - 14 Million verified businesses
Area: 0.541 square miles
Population: 7,313
Population density:
| Munger Place Historic District: | 13,507 people per square mile |
| Dallas: | 3,794 people per square mile |

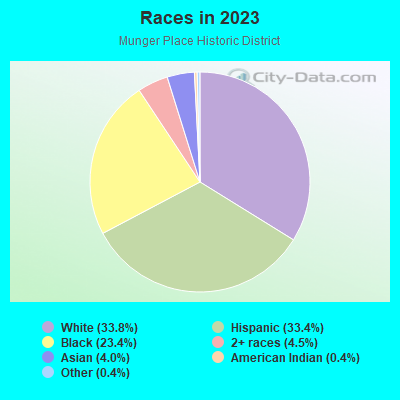
- 2,94336.7%White
- 2,78134.7%Hispanic or Latino
- 1,72121.5%Black
- 2953.7%Two or more races
- 1962.4%Asian
- 490.6%Some other race
- 300.4%American Indian
Median household income in 2022:
| Munger Place Historic District: | $61,158 |
| Dallas: | $65,400 |
Distribution of median household income
![Distribution of median household income]()
- 423Less than $10,000
- 410$10,000 to $19,999
- 483$20,000 to $29,999
- 343$30,000 to $39,999
- 466$40,000 to $49,999
- 431$50,000 to $59,999
- 451$60,000 to $74,999
- 595$75,000 to $99,999
- 260$100,000 to $124,999
- 128$125,000 to $149,999
- 283$150,000 to $199,999
- 398$200,000 or more

Distribution of owner-occupied house/condo value
![Distribution of owner-occupied house/condo value]()
- 50Less than $50,000
- 235$50,000 to $99,999
- 166$100,000 to $149,999
- 265$150,000 to $199,999
- 162$200,000 to $249,999
- 214$250,000 to $299,999
- 197$300,000 to $399,999
- 232$400,000 to $499,999
- 296$500,000 to $749,999
- 344$750,000 to $999,999
- 361$1,000,000 or more

Distribution of rent paid by renters
![Distribution of rent paid by renters]()
- 239$200 to $299
- 43$300 to $399
- 158$400 to $499
- 330$500 to $599
- 342$600 to $699
- 492$700 to $799
- 303$800 to $899
- 305$900 to $999
- 741$1,000 to $1,249
- 568$1,250 to $1,499
- 290$1,500 to $1,999
- 221$2,000 or more

Median rent in 2022:
| Munger Place Historic District: | $1,119 |
| Dallas: | $1,208 |
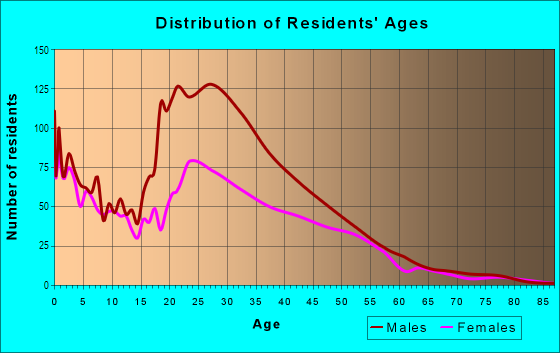
| Males: | 3,695 |
| Females: | 3,617 |
Males:
| This neighborhood: | 39.0 years |
| Whole city: | 32.8 years |
| This neighborhood: | 37.2 years |
| Whole city: | 33.4 years |
Average household size:
| Munger Place Historic District: | 2.2 people |
| Dallas: | 2.4 people |
Percentage of family households:
| Munger Place Historic District: | 33.1% |
| Dallas: | 42.6% |
| Here: | 23.8% |
| Dallas: | 33.8% |
Percentage of married-couple families with children (among all households):
| Munger Place Historic District: | 14.6% |
| Dallas: | 24.8% |
Percentage of single-mother households (among all households):
| Munger Place Historic District: | 34.3% |
| Dallas: | 13.3% |
Percentage of never married males 15 years old and over:
Percentage of never married females 15 years old and over:
| Munger Place Historic District: | 23.0% |
| Dallas: | 22.1% |
Percentage of never married females 15 years old and over:
| Munger Place Historic District: | 25.7% |
| city: | 21.8% |
Percentage of people that speak English not well or not at all:
| Munger Place Historic District: | 14.8% |
| Dallas: | 10.7% |
Percentage of people born in this state:
Percentage of people born in another U.S. state:
Percentage of native residents but born outside the U.S.:
Percentage of foreign born residents:
| Here: | 56.6% |
| Dallas: | 52.8% |
Percentage of people born in another U.S. state:
| Munger Place Historic District: | 23.1% |
| Dallas: | 22.0% |
Percentage of native residents but born outside the U.S.:
| Here: | 2.1% |
| city: | 1.3% |
Percentage of foreign born residents:
| Here: | 18.4% |
| Dallas: | 23.9% |
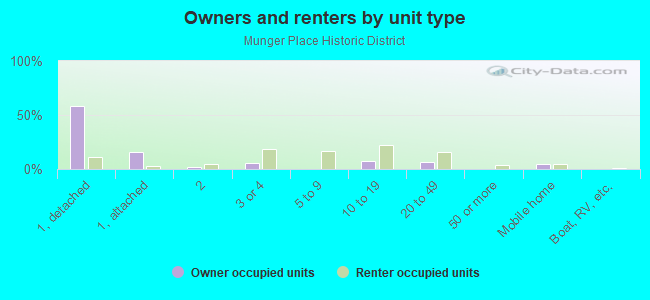
Owner-occupied
Renter-occupied

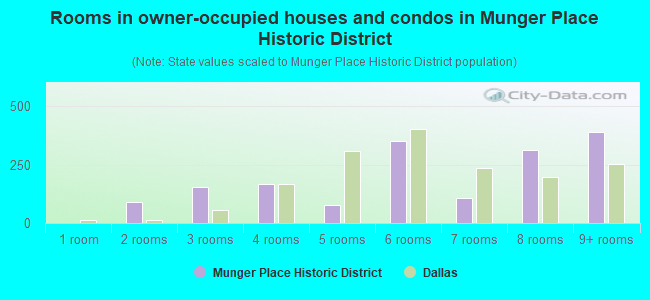
- Rooms in owner-occupied houses and condos in Munger Place Historic District
- 01 room
- 912 rooms
- 1533 rooms
- 1684 rooms
- 755 rooms
- 3496 rooms
- 1057 rooms
- 3128 rooms
- 3909+ rooms
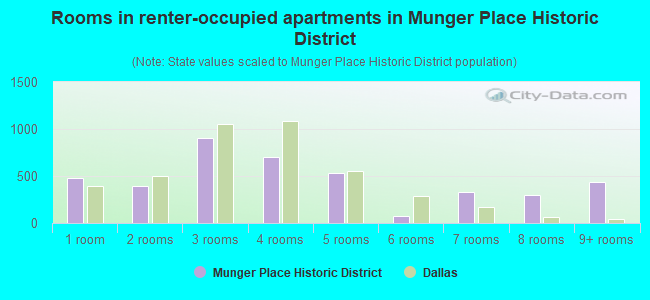
- Rooms in renter-occupied apartments in Munger Place Historic District
- 4741 room
- 3912 rooms
- 9063 rooms
- 7004 rooms
- 5355 rooms
- 796 rooms
- 3277 rooms
- 2958 rooms
- 4369+ rooms
Owner-occupied
Renter-occupied
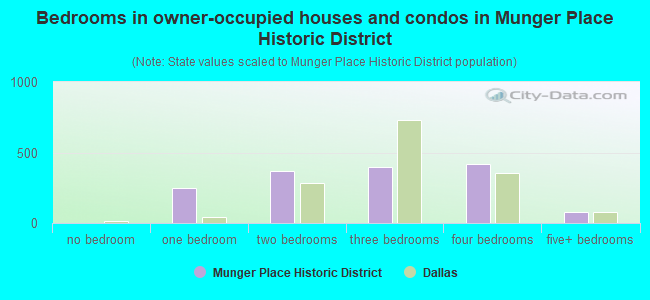
- Bedrooms in owner-occupied houses and condos in Munger Place Historic District
- 0no bedroom
- 2451 bedroom
- 3682 bedrooms
- 4003 bedrooms
- 4174 bedrooms
- 775+ bedrooms
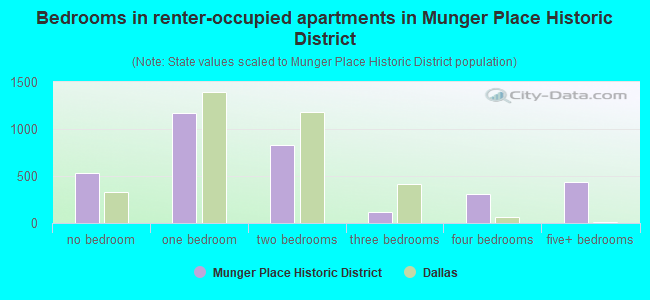
- Bedrooms in renter-occupied apartments in Munger Place Historic District
- 533no bedroom
- 1,1741 bedroom
- 8292 bedrooms
- 1143 bedrooms
- 3064 bedrooms
- 4365+ bedrooms
Average number of cars or other vehicles available in houses/condos:
Average number of cars or other vehicles available in apartments:
| This neighborhood: | 2.3 |
| Dallas: | 2.1 |
Average number of cars or other vehicles available in apartments:
| Here: | 1.1 |
| city: | 1.3 |
Percentage of units with a mortgage:
| Munger Place Historic District: | 42.2% |
| Dallas: | 53.9% |
Average estimated value of detached houses in 2022 (29.4% of all units):
| Munger Place Historic District: | $608,459 |
| Dallas: | $423,859 |
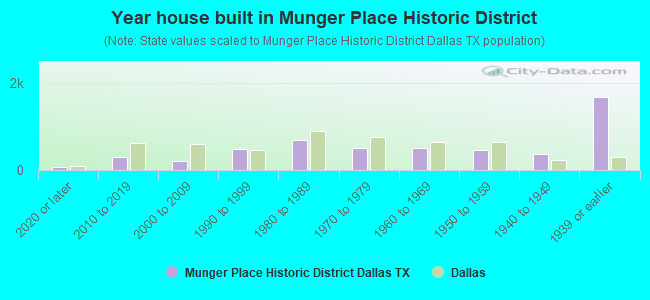
- Year house built in Munger Place Historic District
- 772020 or later
- 2972010 to 2019
- 1992000 to 2009
- 4871990 to 1999
- 6951980 to 1989
- 4951970 to 1979
- 5081960 to 1969
- 4711950 to 1959
- 3721940 to 1949
- 1,6711939 or earlier
City-data.com crime index for city in 2020 (higher means more crime):
| City: | 439.5 |
| U.S. average: | 219.5 |
Travel time to work (commute)
![Travel time to work (commute)]()
- 139Less than 5 minutes
- 1345 to 9 minutes
- 23810 to 14 minutes
- 77515 to 19 minutes
- 45420 to 24 minutes
- 20725 to 29 minutes
- 27230 to 34 minutes
- 13635 to 39 minutes
- 10240 to 44 minutes
- 72845 to 59 minutes
- 18960 to 89 minutes
- 8190 or more minutes

Means of transportation to work
![Means of transportation to work]()
- 57.9%2,447Drove a car alone
- 11.8%497Carpooled
- 7.3%307Bus
- 25.2%1,064Long-distance train or commuter rail
- 1.6%67Light rail, streetcar or trolley
- 7.3%308Taxi
- 3.6%151Motorcycle
- 6.5%276Bicycle
- 7.2%306Walked
- 1.6%67Other means
- 13.0%548Worked at home

Time leaving home to go to work
![Time leaving home to go to work]()
- 15412:00 a.m. to 4:59 a.m.
- 935:00 a.m. to 5:29 a.m.
- 1255:30 a.m. to 5:59 a.m.
- 2806:00 a.m. to 6:29 a.m.
- 2666:30 a.m. to 6:59 a.m.
- 4327:00 a.m. to 7:29 a.m.
- 2657:30 a.m. to 7:59 a.m.
- 2778:00 a.m. to 8:29 a.m.
- 3578:30 a.m. to 8:59 a.m.
- 2169:00 a.m. to 9:59 a.m.
- 10810:00 a.m. to 10:59 a.m.
- 6111:00 a.m. to 11:59 a.m.
- 19112:00 p.m. to 3:59 p.m.
- 2174:00 p.m. to 11:59 p.m.

Occupations of males:
- Percentage of males in management occupations (except farmers):
Here: 7.4% city: 10.9%
- Percentage of males in business and financial operations occupations:
Here: 5.6% city: 7.3%
- Percentage of males in computer and mathematical occupations:
Here: 10.1% city: 4.7%
- Percentage of males in architecture and engineering occupations:
Here: 3.1% city: 2.8%
- Percentage of males in life, physical, and social science occupations:
Here: 2.3% city: 0.7%
- Percentage of males in legal occupations:
Here: 1.0% city: 1.8%
- Percentage of males in education, training, and library occupations:
Here: 2.0% city: 2.3%
- Percentage of males in arts, design, entertainment, sports, and media occupations:
Here: 4.5% city: 2.2%
- Percentage of males in healthcare practitioners and technical occupations:
Here: 2.6% city: 2.7%
- Percentage of males in service occupations:
Here: 13.5% city: 12.3%
- Percentage of males in sales and office occupations:
Here: 12.3% city: 14.9%
- Percentage of males in construction, extraction, and maintenance occupations:
Here: 16.7% city: 15.2%
- Percentage of males in production occupations:
Here: 4.6% city: 5.0%
- Percentage of males in transportation occupations:
Here: 2.9% city: 5.9%
- Percentage of males in material moving occupations:
Here: 8.0% city: 6.2%
Occupations of females:
- Percentage of females in management occupations (except farmers):
Here: 15.3% city: 9.6%
- Percentage of females in business and financial operations occupations:
Here: 7.3% city: 8.4%
- Percentage of females in community and social services occupations:
Here: 1.3% city: 1.8%
- Percentage of females in education, training, and library occupations:
Here: 8.4% city: 7.1%
- Percentage of females in arts, design, entertainment, sports, and media occupations:
Here: 14.1% city: 2.9%
- Percentage of females in healthcare practitioners and technical occupations:
Here: 7.1% city: 7.7%
- Percentage of females in service occupations:
Here: 19.3% city: 20.5%
- Percentage of females in sales and office occupations:
Here: 21.5% city: 27.7%
- Percentage of females in construction, extraction, and maintenance occupations:
Here: 1.2% city: 0.6%
- Percentage of females in material moving occupations:
Here: 3.5% city: 3.2%
Percentage of people 16-64 in Armed Forces:
| Munger Place Historic District: | 0.1% |
| Dallas: | 0.2% |
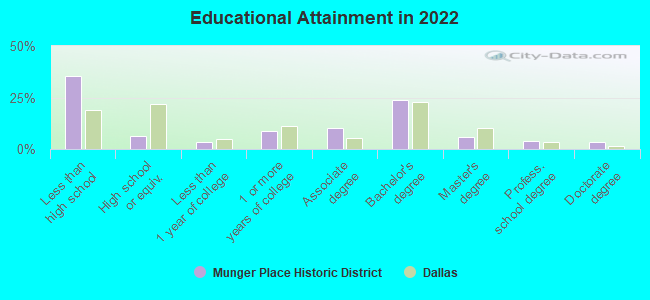
Education in this neighborhood (subdivision or community):
- Percentage of people 3 years and older in K-12 schools:
Munger Place Historic District: 26.8% Dallas: 17.3%
- Percentage of people 3 years and older in undergraduate colleges:
Munger Place Historic District: 6.0% Dallas: 4.1%
- Percentage of people 3 years and older in grad. or professional schools:
Munger Place Historic District: 4.1% Dallas: 1.7%
- Percentage of students K-12 enrolled in private schools:
Munger Place Historic District: 21.5% Dallas: 10.8%
Percentage of population below poverty level:
| Munger Place Historic District: | 19.4% |
| Dallas: | 17.8% |
Percentage of married-couple families with both working:
| Munger Place Historic District: | 137.2% |
| Dallas: | 58.3% |
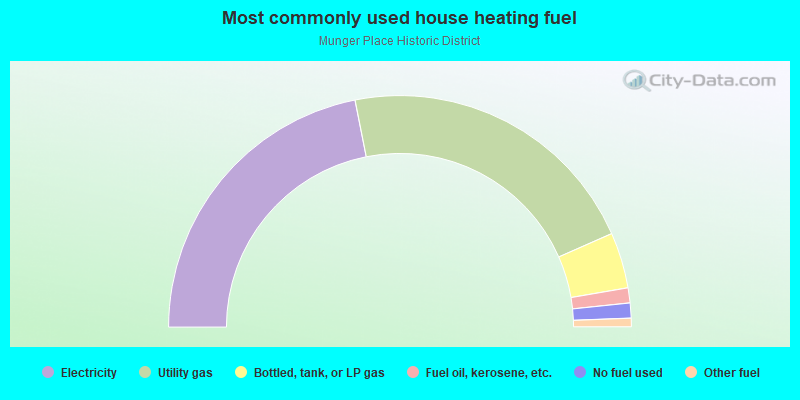
- 43.8%Electricity
- 43.0%Utility gas
- 7.8%Bottled, tank, or LP gas
- 2.1%Fuel oil, kerosene, etc.
- 2.1%No fuel used
- 1.2%Other fuel
Roads and streets:
N Munger Blvd
Length: 1.34 miles
Directions: N-S, SE-NW
Address range: 100 to 1109
Directions: N-S, SE-NW
Address range: 100 to 1109
Columbia Ave
Length: 1.26 miles
Direction: SW-NE
Address range: 4700 to 5399
Direction: SW-NE
Address range: 4700 to 5399
Swiss Ave
Length: 0.99 miles
Directions: N-S, SW-NE
Address range: 4800 to 5399
Directions: N-S, SW-NE
Address range: 4800 to 5399
N Collett Ave
Length: 0.65 miles
Direction: SE-NW
Address range: 100 to 1099
Direction: SE-NW
Address range: 100 to 1099
N Fitzhugh Ave
Length: 0.64 miles
Direction: SE-NW
Address range: 100 to 1099
Direction: SE-NW
Address range: 100 to 1099
E Side Ave
Length: 0.64 miles
Directions: E-W, N-S, SW-NE
Address range: 4632 to 5399
Directions: E-W, N-S, SW-NE
Address range: 4632 to 5399
Reiger Ave
Length: 0.64 miles
Direction: SW-NE
Address range: 4700 to 5399
Direction: SW-NE
Address range: 4700 to 5399
Junius St
Length: 0.62 miles
Direction: SW-NE
Address range: 4701 to 5327
Direction: SW-NE
Address range: 4701 to 5327
Santa Fe Ave
Length: 0.60 miles
Direction: SW-NE
Address range: 4751 to 5399
Direction: SW-NE
Address range: 4751 to 5399
Tremont St
Length: 0.57 miles
Direction: SW-NE
Address range: 4700 to 5299
Direction: SW-NE
Address range: 4700 to 5299
Gaston Ave
Length: 0.57 miles
Direction: SW-NE
Address range: 4726 to 5399
Direction: SW-NE
Address range: 4726 to 5399
Victor St
Length: 0.48 miles
Direction: SW-NE
Address range: 4750 to 5299
Direction: SW-NE
Address range: 4750 to 5299
Worth St
Length: 0.48 miles
Direction: SW-NE
Address range: 4800 to 5299
Direction: SW-NE
Address range: 4800 to 5299
S Munger Blvd
Length: 0.43 miles
Directions: N-S, SE-NW
Address range: 100 to 413
Directions: N-S, SE-NW
Address range: 100 to 413
N Henderson Ave
Length: 0.43 miles
Direction: SE-NW
Address range: 100 to 699
Direction: SE-NW
Address range: 100 to 699
N Prairie Ave
Length: 0.42 miles
Direction: SE-NW
Address range: 100 to 699
Direction: SE-NW
Address range: 100 to 699
Elm St
Length: 0.33 miles
Direction: SW-NE
Address range: 4700 to 4999
Direction: SW-NE
Address range: 4700 to 4999
Dumas St
Length: 0.25 miles
Direction: SE-NW
Address range: 700 to 1099
Direction: SE-NW
Address range: 700 to 1099
Alton Ave
Length: 0.25 miles
Direction: SW-NE
Address range: 4900 to 5399
Direction: SW-NE
Address range: 4900 to 5399
S Henderson Ave
Length: 0.21 miles
Direction: SE-NW
Address range: 100 to 399
Direction: SE-NW
Address range: 100 to 399
S Fitzhugh Ave
Length: 0.21 miles
Direction: SE-NW
Address range: 100 to 399
Direction: SE-NW
Address range: 100 to 399
S St Mary Ave
Length: 0.21 miles
Directions: N-S, SE-NW
Address range: 100 to 399
Directions: N-S, SE-NW
Address range: 100 to 399
S Garrett Ave
Length: 0.19 miles
Direction: SE-NW
Address range: 100 to 399
Direction: SE-NW
Address range: 100 to 399
S Orient St
Length: 0.18 miles
Direction: SE-NW
Address range: 100 to 399
Direction: SE-NW
Address range: 100 to 399
Dart Ave
Length: 0.17 miles
Direction: SW-NE
Address range: 5100 to 5199
Direction: SW-NE
Address range: 5100 to 5199
S Collett Ave
Length: 0.16 miles
Direction: SE-NW
Address range: 100 to 299
Direction: SE-NW
Address range: 100 to 299
Grigsby Ave
Length: 0.12 miles
Direction: SE-NW
Address range: 900 to 1099
Direction: SE-NW
Address range: 900 to 1099
Barry Ave
Length: 0.12 miles
Direction: SE-NW
Address range: 100 to 299
Direction: SE-NW
Address range: 100 to 299
S Prairie Ave
Length: 0.11 miles
Direction: SE-NW
Address range: 100 to 199
Direction: SE-NW
Address range: 100 to 199
S Cisco St
Length: 0.11 miles
Direction: SE-NW
Address range: 100 to 199
Direction: SE-NW
Address range: 100 to 199
N Cisco St
Length: 0.11 miles
Direction: SE-NW
Address range: 100 to 299
Direction: SE-NW
Address range: 100 to 299
N Orient St
Length: 0.10 miles
Direction: SE-NW
Address range: 100 to 299
Direction: SE-NW
Address range: 100 to 299
Main Pl
Length: 0.09 miles
Direction: SW-NE
Address range: 4700 to 4799
Direction: SW-NE
Address range: 4700 to 4799
Millers Ct (Collett Pl)
Length: 0.08 miles
Direction: SW-NE
Address range: 5000 to 5199
Direction: SW-NE
Address range: 5000 to 5199
Winslet Dr
Length: 0.07 miles
Directions: E-W, SE-NW
Address range: 200 to 399
Directions: E-W, SE-NW
Address range: 200 to 399
N St Mary Ave
Length: 0.05 miles
Directions: E-W, SE-NW
Address range: 100 to 199
Directions: E-W, SE-NW
Address range: 100 to 199
N Garrett Ave
Length: 0.05 miles
Direction: SE-NW
Address range: 100 to 199
Direction: SE-NW
Address range: 100 to 199
Railroad features:
at and Sf Rlwy
Length: 0.50 miles
Direction: SW-NE
Direction: SW-NE