Munger Place neighborhood in Dallas, Texas (TX), 75206, 75214 detailed profile
Settings
X


Business Search - 14 Million verified businesses
Area: 0.231 square miles
Population: 6,100
Population density:
| Munger Place: | 26,383 people per square mile |
| Dallas: | 3,794 people per square mile |

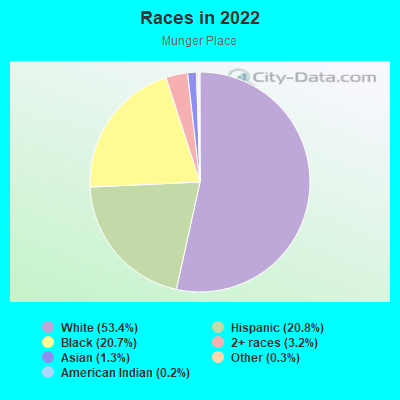
- 3,28353.4%White
- 1,28120.8%Hispanic or Latino
- 1,27520.7%Black
- 1983.2%Two or more races
- 831.3%Asian
- 200.3%Some other race
- 130.2%American Indian
Median household income in 2022:
| Munger Place: | $69,821 |
| Dallas: | $65,400 |
Distribution of median household income
![Distribution of median household income]()
- 282Less than $10,000
- 403$10,000 to $19,999
- 438$20,000 to $29,999
- 69$30,000 to $39,999
- 328$40,000 to $49,999
- 307$50,000 to $59,999
- 339$60,000 to $74,999
- 272$75,000 to $99,999
- 164$100,000 to $124,999
- 100$125,000 to $149,999
- 231$150,000 to $199,999
- 660$200,000 or more

Distribution of owner-occupied house/condo value
![Distribution of owner-occupied house/condo value]()
- 50$100,000 to $149,999
- 233$150,000 to $199,999
- 32$200,000 to $249,999
- 143$300,000 to $399,999
- 168$400,000 to $499,999
- 406$500,000 to $749,999
- 231$750,000 to $999,999
- 162$1,000,000 or more

Distribution of rent paid by renters
![Distribution of rent paid by renters]()
- 293$200 to $299
- 12$300 to $399
- 38$400 to $499
- 51$500 to $599
- 69$600 to $699
- 259$700 to $799
- 300$800 to $899
- 187$900 to $999
- 649$1,000 to $1,249
- 586$1,250 to $1,499
- 178$1,500 to $1,999
- 128$2,000 or more

Median rent in 2022:
| Munger Place: | $1,170 |
| Dallas: | $1,208 |
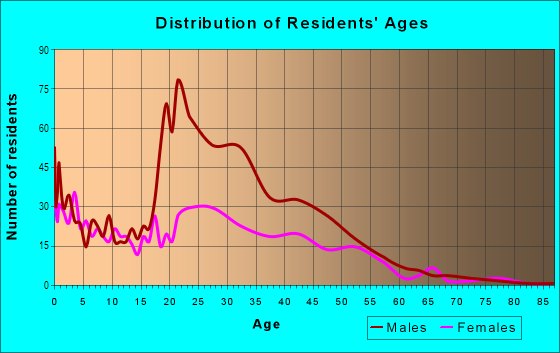
| Males: | 3,062 |
| Females: | 3,037 |
Males:
| This neighborhood: | 34.4 years |
| Whole city: | 32.8 years |
| This neighborhood: | 35.2 years |
| Whole city: | 33.4 years |
Average household size:
| Munger Place: | 2.0 people |
| Dallas: | 2.4 people |
Percentage of family households:
| Munger Place: | 33.4% |
| Dallas: | 42.6% |
| Here: | 26.0% |
| Dallas: | 33.8% |
Percentage of married-couple families with children (among all households):
| Munger Place: | 25.9% |
| Dallas: | 24.8% |
Percentage of single-mother households (among all households):
| Munger Place: | 60.8% |
| Dallas: | 13.3% |
Percentage of never married males 15 years old and over:
Percentage of never married females 15 years old and over:
| Munger Place: | 19.9% |
| Dallas: | 22.1% |
Percentage of never married females 15 years old and over:
| Munger Place: | 29.2% |
| city: | 21.8% |
Percentage of people that speak English not well or not at all:
| Munger Place: | 4.2% |
| Dallas: | 10.7% |
Percentage of people born in this state:
Percentage of people born in another U.S. state:
Percentage of native residents but born outside the U.S.:
Percentage of foreign born residents:
| Here: | 61.0% |
| Dallas: | 52.8% |
Percentage of people born in another U.S. state:
| Munger Place: | 28.1% |
| Dallas: | 22.0% |
Percentage of native residents but born outside the U.S.:
| Here: | 1.8% |
| city: | 1.3% |
Percentage of foreign born residents:
| Here: | 9.0% |
| Dallas: | 23.9% |
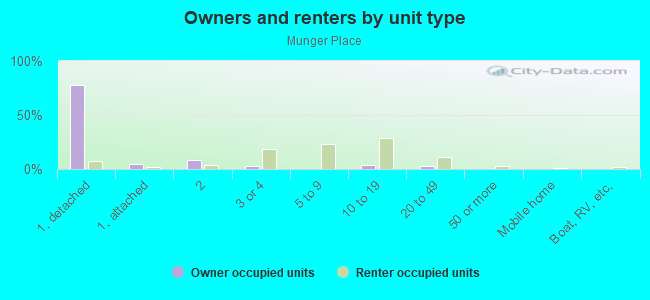
Owner-occupied
Renter-occupied

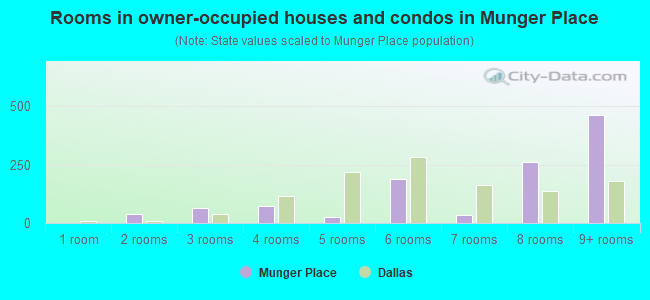
- Rooms in owner-occupied houses and condos in Munger Place
- 01 room
- 392 rooms
- 653 rooms
- 744 rooms
- 275 rooms
- 1876 rooms
- 347 rooms
- 2618 rooms
- 4639+ rooms
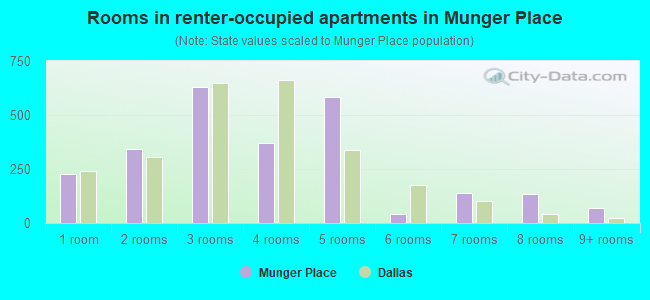
- Rooms in renter-occupied apartments in Munger Place
- 2251 room
- 3412 rooms
- 6303 rooms
- 3724 rooms
- 5835 rooms
- 426 rooms
- 1377 rooms
- 1348 rooms
- 719+ rooms
Owner-occupied
Renter-occupied
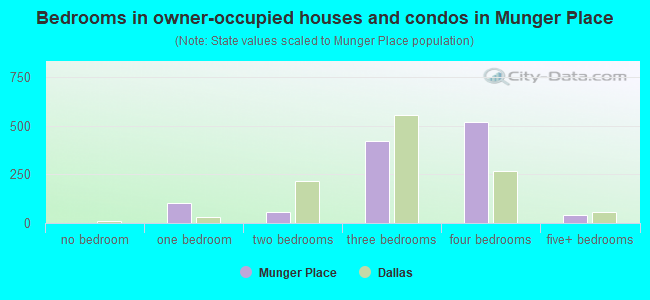
- Bedrooms in owner-occupied houses and condos in Munger Place
- 0no bedroom
- 1021 bedroom
- 582 bedrooms
- 4243 bedrooms
- 5194 bedrooms
- 395+ bedrooms
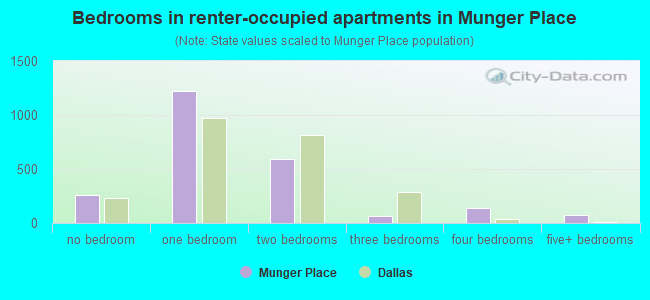
- Bedrooms in renter-occupied apartments in Munger Place
- 262no bedroom
- 1,2241 bedroom
- 5942 bedrooms
- 613 bedrooms
- 1424 bedrooms
- 715+ bedrooms
Average number of cars or other vehicles available in houses/condos:
Average number of cars or other vehicles available in apartments:
| This neighborhood: | 2.1 |
| Dallas: | 2.1 |
Average number of cars or other vehicles available in apartments:
| Here: | 0.9 |
| city: | 1.3 |
Percentage of units with a mortgage:
| Munger Place: | 61.9% |
| Dallas: | 53.9% |
Average estimated value of detached houses in 2022 (33.0% of all units):
| Munger Place: | $627,889 |
| Dallas: | $423,859 |
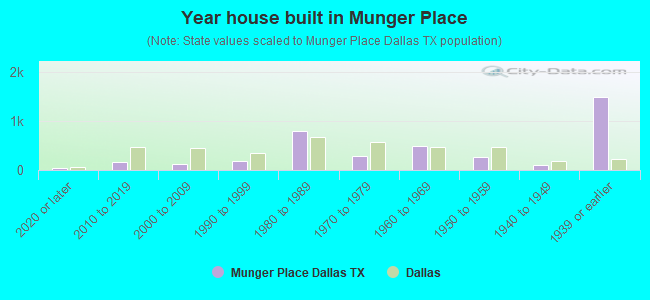
- Year house built in Munger Place
- 322020 or later
- 1542010 to 2019
- 1242000 to 2009
- 1871990 to 1999
- 8061980 to 1989
- 2761970 to 1979
- 4881960 to 1969
- 2641950 to 1959
- 971940 to 1949
- 1,4831939 or earlier
City-data.com crime index for city in 2020 (higher means more crime):
| City: | 439.5 |
| U.S. average: | 219.5 |
Travel time to work (commute)
![Travel time to work (commute)]()
- 43Less than 5 minutes
- 645 to 9 minutes
- 9610 to 14 minutes
- 42415 to 19 minutes
- 15220 to 24 minutes
- 8925 to 29 minutes
- 7430 to 34 minutes
- 4335 to 39 minutes
- 4340 to 44 minutes
- 51645 to 59 minutes
- 7960 to 89 minutes
- 4390 or more minutes

Means of transportation to work
![Means of transportation to work]()
- 54.4%2,130Drove a car alone
- 6.1%239Carpooled
- 9.2%359Bus
- 8.9%348Long-distance train or commuter rail
- 3.3%131Taxi
- 4.4%172Bicycle
- 2.6%103Walked
- 0.9%37Other means
- 17.5%685Worked at home

Time leaving home to go to work
![Time leaving home to go to work]()
- 8212:00 a.m. to 4:59 a.m.
- 265:00 a.m. to 5:29 a.m.
- 645:30 a.m. to 5:59 a.m.
- 1016:00 a.m. to 6:29 a.m.
- 1356:30 a.m. to 6:59 a.m.
- 1447:00 a.m. to 7:29 a.m.
- 877:30 a.m. to 7:59 a.m.
- 1218:00 a.m. to 8:29 a.m.
- 1838:30 a.m. to 8:59 a.m.
- 819:00 a.m. to 9:59 a.m.
- 5510:00 a.m. to 10:59 a.m.
- 1911:00 a.m. to 11:59 a.m.
- 8012:00 p.m. to 3:59 p.m.
- 1234:00 p.m. to 11:59 p.m.

Occupations of males:
- Percentage of males in management occupations (except farmers):
Here: 3.4% city: 10.9%
- Percentage of males in business and financial operations occupations:
Here: 10.4% city: 7.3%
- Percentage of males in computer and mathematical occupations:
Here: 10.5% city: 4.7%
- Percentage of males in architecture and engineering occupations:
Here: 8.3% city: 2.8%
- Percentage of males in life, physical, and social science occupations:
Here: 4.3% city: 0.7%
- Percentage of males in legal occupations:
Here: 1.4% city: 1.8%
- Percentage of males in arts, design, entertainment, sports, and media occupations:
Here: 2.0% city: 2.2%
- Percentage of males in healthcare practitioners and technical occupations:
Here: 2.6% city: 2.7%
- Percentage of males in service occupations:
Here: 10.1% city: 12.3%
- Percentage of males in sales and office occupations:
Here: 19.1% city: 14.9%
- Percentage of males in construction, extraction, and maintenance occupations:
Here: 11.8% city: 15.2%
- Percentage of males in production occupations:
Here: 4.0% city: 5.0%
- Percentage of males in material moving occupations:
Here: 10.3% city: 6.2%
Occupations of females:
- Percentage of females in management occupations (except farmers):
Here: 20.5% city: 9.6%
- Percentage of females in business and financial operations occupations:
Here: 7.0% city: 8.4%
- Percentage of females in education, training, and library occupations:
Here: 6.0% city: 7.1%
- Percentage of females in arts, design, entertainment, sports, and media occupations:
Here: 15.9% city: 2.9%
- Percentage of females in healthcare practitioners and technical occupations:
Here: 5.0% city: 7.7%
- Percentage of females in service occupations:
Here: 23.8% city: 20.5%
- Percentage of females in sales and office occupations:
Here: 21.1% city: 27.7%
- Percentage of females in production occupations:
Here: 1.8% city: 3.6%
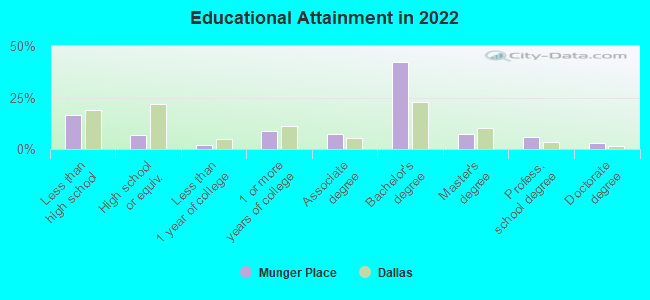
Education in this neighborhood (subdivision or community):
- Percentage of people 3 years and older in K-12 schools:
Munger Place: 19.1% Dallas: 17.3%
- Percentage of people 3 years and older in undergraduate colleges:
Munger Place: 4.2% Dallas: 4.1%
- Percentage of people 3 years and older in grad. or professional schools:
Munger Place: 1.8% Dallas: 1.7%
- Percentage of students K-12 enrolled in private schools:
Munger Place: 15.2% Dallas: 10.8%
Percentage of population below poverty level:
| Munger Place: | 20.0% |
| Dallas: | 17.8% |
Median year owner moved in (as recorded in 2022):
| Munger Place: | 2012 |
| Dallas: | 2010 |
Percentage of married-couple families with both working:
| Munger Place: | 86.4% |
| Dallas: | 58.3% |
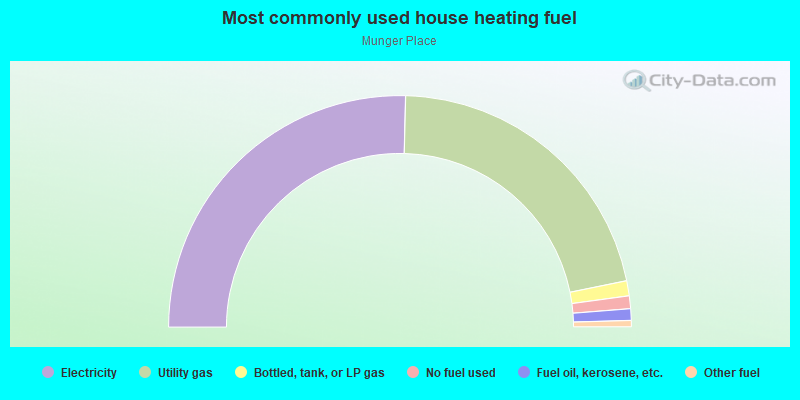
- 50.8%Electricity
- 42.8%Utility gas
- 2.1%Bottled, tank, or LP gas
- 1.8%No fuel used
- 1.6%Fuel oil, kerosene, etc.
- 0.9%Other fuel
Roads and streets:
N Munger Blvd
Length: 1.48 miles
Directions: N-S, SE-NW
Address range: 100 to 1199
Directions: N-S, SE-NW
Address range: 100 to 1199
N Collett Ave
Length: 0.77 miles
Direction: SE-NW
Address range: 100 to 1265
Direction: SE-NW
Address range: 100 to 1265
N Henderson Ave
Length: 0.43 miles
Direction: SE-NW
Address range: 100 to 699
Direction: SE-NW
Address range: 100 to 699
Swiss Ave
Length: 0.32 miles
Direction: SW-NE
Address range: 5001 to 5199
Direction: SW-NE
Address range: 5001 to 5199
Reiger Ave
Length: 0.26 miles
Direction: SW-NE
Address range: 4935 to 5299
Direction: SW-NE
Address range: 4935 to 5299
Columbia Ave
Length: 0.25 miles
Direction: SW-NE
Address range: 4937 to 5299
Direction: SW-NE
Address range: 4937 to 5299
Victor St
Length: 0.21 miles
Direction: SW-NE
Address range: 5000 to 5299
Direction: SW-NE
Address range: 5000 to 5299
Worth St
Length: 0.21 miles
Direction: SW-NE
Address range: 5000 to 5299
Direction: SW-NE
Address range: 5000 to 5299
Tremont St
Length: 0.21 miles
Direction: SW-NE
Address range: 5000 to 5299
Direction: SW-NE
Address range: 5000 to 5299
Junius St
Length: 0.21 miles
Direction: SW-NE
Address range: 5000 to 5298
Direction: SW-NE
Address range: 5000 to 5298
Gaston Ave
Length: 0.16 miles
Direction: SW-NE
Address range: 5000 to 5199
Direction: SW-NE
Address range: 5000 to 5199
Sycamore St
Length: 0.16 miles
Direction: SW-NE
Address range: 5000 to 5201
Direction: SW-NE
Address range: 5000 to 5201
Barry Ave
Length: 0.11 miles
Direction: SE-NW
Address range: 100 to 299
Direction: SE-NW
Address range: 100 to 299
Millers Ct (Collett Pl)
Length: 0.08 miles
Direction: SW-NE
Address range: 5000 to 5199
Direction: SW-NE
Address range: 5000 to 5199
N St Mary Ave
Length: 0.05 miles
Directions: E-W, SE-NW
Address range: 100 to 199
Directions: E-W, SE-NW
Address range: 100 to 199
N Garrett Ave
Length: 0.05 miles
Direction: SE-NW
Address range: 100 to 199
Direction: SE-NW
Address range: 100 to 199
Elm St
Length: 0.04 miles
Direction: SW-NE
Address range: 4952 to 4999
Direction: SW-NE
Address range: 4952 to 4999