Muir neighborhood in San Jose, California (CA), 95118 detailed profile
Settings
X

Business Search - 14 Million verified businesses
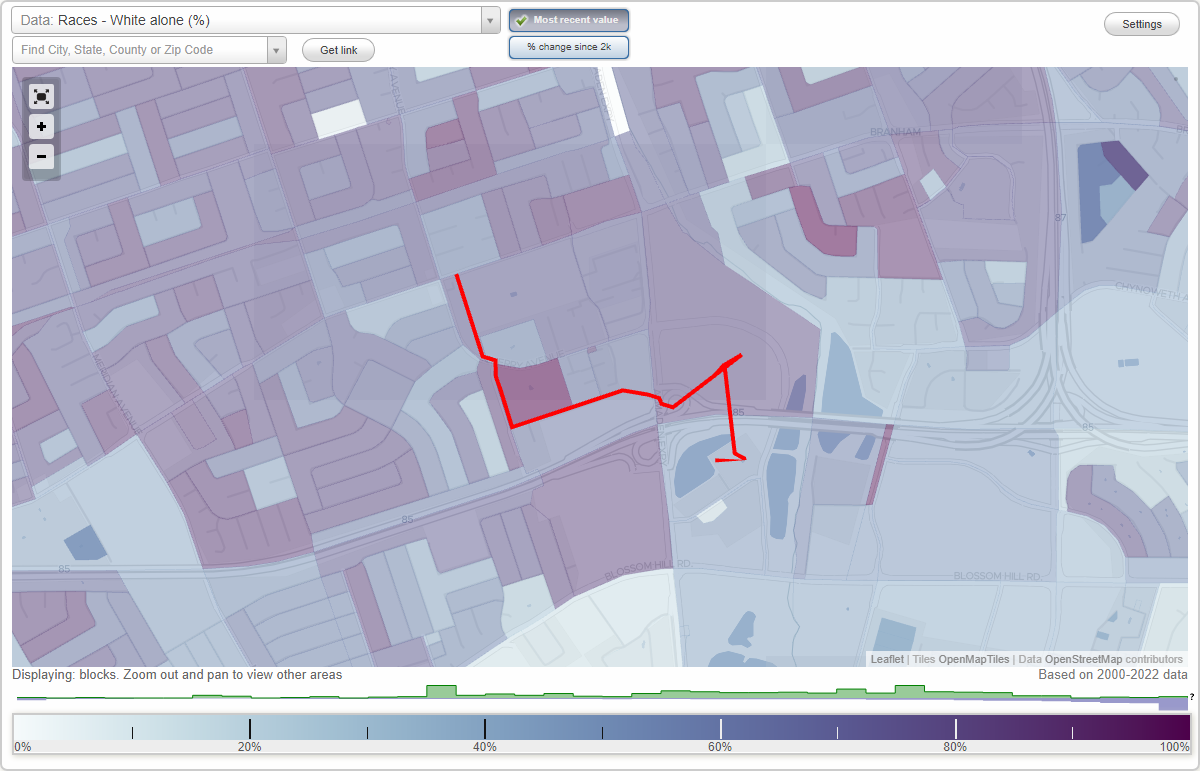
Area: 0.137 square miles
Population: 1,501
Population density:
| Muir: | 10,961 people per square mile |
| San Jose: | 5,554 people per square mile |

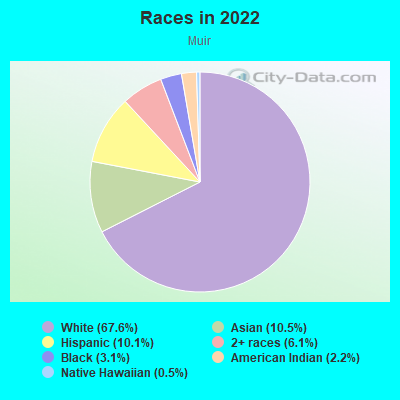
- 54936.0%Hispanic or Latino
- 44729.3%White
- 32521.3%Asian
- 1036.8%Two or more races
- 754.9%Black
- 171.1%Some other race
- 90.6%American Indian
Median household income in 2022:
| Muir: | $138,041 |
| San Jose: | $133,835 |
Distribution of median household income
![Distribution of median household income]()
- 12Less than $10,000
- 45$10,000 to $19,999
- 53$20,000 to $29,999
- 44$30,000 to $39,999
- 70$40,000 to $49,999
- 12$50,000 to $59,999
- 41$60,000 to $74,999
- 117$75,000 to $99,999
- 87$100,000 to $124,999
- 51$125,000 to $149,999
- 53$150,000 to $199,999
- 123$200,000 or more

Distribution of owner-occupied house/condo value
![Distribution of owner-occupied house/condo value]()
- 5Less than $50,000
- 3$50,000 to $99,999
- 8$300,000 to $399,999
- 8$400,000 to $499,999
- 26$500,000 to $749,999
- 69$750,000 to $999,999
- 395$1,000,000 or more

Distribution of rent paid by renters
![Distribution of rent paid by renters]()
- 8$200 to $299
- 15$300 to $399
- 3$400 to $499
- 37$500 to $599
- 45$600 to $699
- 3$700 to $799
- 4$800 to $899
- 36$900 to $999
- 59$1,000 to $1,249
- 13$1,250 to $1,499
- 147$1,500 to $1,999
- 260$2,000 or more

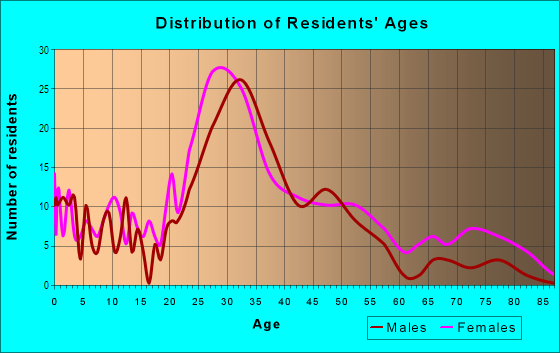
| Males: | 672 |
| Females: | 828 |
Males:
| This neighborhood: | 38.2 years |
| Whole city: | 37.6 years |
| This neighborhood: | 40.6 years |
| Whole city: | 39.1 years |
Average household size:
| Muir: | 2.5 people |
| San Jose: | 2.9 people |
Percentage of family households:
| Muir: | 35.2% |
| San Jose: | 49.9% |
| Here: | 46.9% |
| San Jose: | 53.0% |
Percentage of married-couple families with children (among all households):
| Muir: | 42.9% |
| San Jose: | 25.8% |
Percentage of single-mother households (among all households):
| Muir: | 9.1% |
| San Jose: | 5.2% |
Percentage of never married males 15 years old and over:
Percentage of never married females 15 years old and over:
| Muir: | 15.5% |
| San Jose: | 20.9% |
Percentage of never married females 15 years old and over:
| Muir: | 19.8% |
| city: | 16.7% |
Percentage of people that speak English not well or not at all:
| Muir: | 6.7% |
| San Jose: | 11.4% |
Percentage of people born in this state:
Percentage of people born in another U.S. state:
Percentage of native residents but born outside the U.S.:
Percentage of foreign born residents:
| Here: | 57.8% |
| San Jose: | 46.1% |
Percentage of people born in another U.S. state:
| Muir: | 12.0% |
| San Jose: | 10.4% |
Percentage of native residents but born outside the U.S.:
| Here: | 1.3% |
| city: | 1.7% |
Percentage of foreign born residents:
| Here: | 29.0% |
| San Jose: | 41.8% |
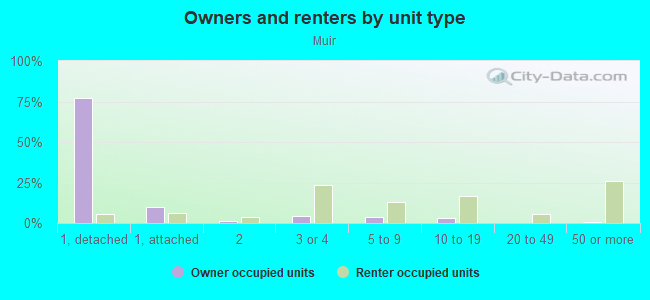
Owner-occupied
Renter-occupied

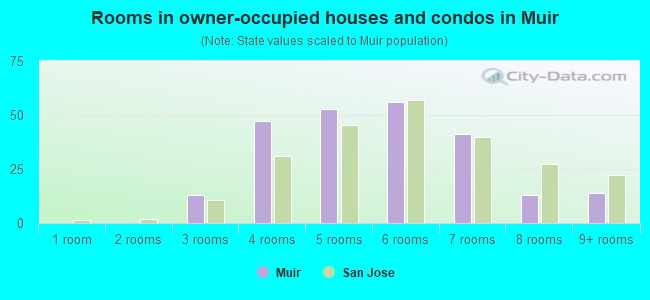
- Rooms in owner-occupied houses and condos in Muir
- 01 room
- 02 rooms
- 133 rooms
- 474 rooms
- 535 rooms
- 566 rooms
- 417 rooms
- 138 rooms
- 149+ rooms
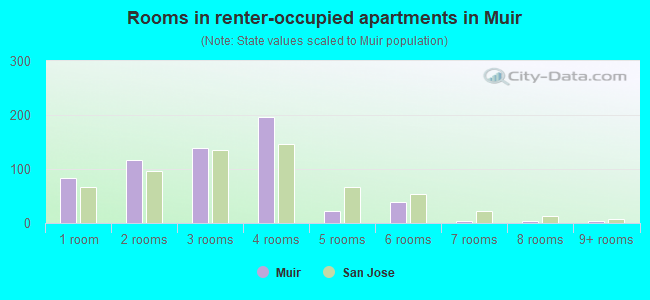
- Rooms in renter-occupied apartments in Muir
- 831 room
- 1172 rooms
- 1393 rooms
- 1974 rooms
- 235 rooms
- 396 rooms
- 37 rooms
- 38 rooms
- 49+ rooms
Owner-occupied
Renter-occupied
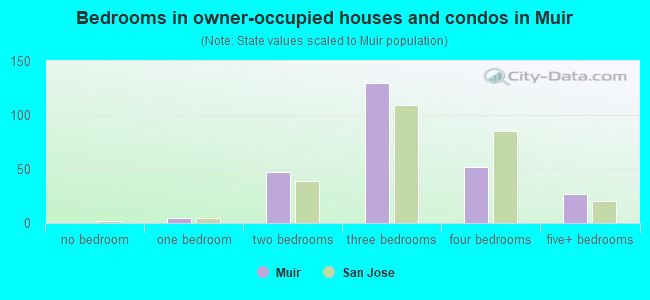
- Bedrooms in owner-occupied houses and condos in Muir
- 0no bedroom
- 51 bedroom
- 472 bedrooms
- 1303 bedrooms
- 524 bedrooms
- 275+ bedrooms
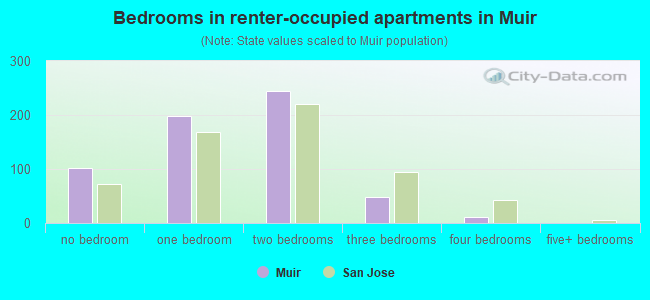
- Bedrooms in renter-occupied apartments in Muir
- 102no bedroom
- 1981 bedroom
- 2452 bedrooms
- 493 bedrooms
- 114 bedrooms
- 05+ bedrooms
Average number of cars or other vehicles available in houses/condos:
Average number of cars or other vehicles available in apartments:
| This neighborhood: | 0.9 |
| San Jose: | 2.3 |
Average number of cars or other vehicles available in apartments:
| Here: | 2.0 |
| city: | 1.6 |
Percentage of units with a mortgage:
| Muir: | 65.6% |
| San Jose: | 66.9% |
Housing prices:
- Average estimated value of detached houses in 2022 (20.8% of all units):
Muir: $1,796,942 San Jose: $1,532,815
- Average estimated value of townhouses or other attached units in 2022 (11.4% of all units):
This neighborhood: $997,100 city: $1,024,857
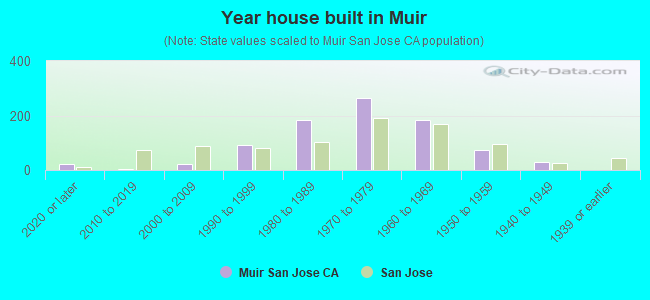
- Year house built in Muir
- 222020 or later
- 42010 to 2019
- 212000 to 2009
- 921990 to 1999
- 1851980 to 1989
- 2661970 to 1979
- 1851960 to 1969
- 731950 to 1959
- 311940 to 1949
- 01939 or earlier
City-data.com crime index for city in 2020 (higher means more crime):
| City: | 268.4 |
| U.S. average: | 219.5 |
Travel time to work (commute)
![Travel time to work (commute)]()
- 19Less than 5 minutes
- 215 to 9 minutes
- 7610 to 14 minutes
- 10615 to 19 minutes
- 13520 to 24 minutes
- 3525 to 29 minutes
- 13130 to 34 minutes
- 2135 to 39 minutes
- 2440 to 44 minutes
- 3845 to 59 minutes
- 4760 to 89 minutes
- 3090 or more minutes

Means of transportation to work
![Means of transportation to work]()
- 81.3%593Drove a car alone
- 5.5%40Carpooled
- 1.0%7Bus
- 1.8%13Long-distance train or commuter rail
- 0.7%5Light rail, streetcar or trolley
- 0.4%3Motorcycle
- 0.7%5Bicycle
- 3.2%23Walked
- 1.2%9Other means
- 12.2%89Worked at home

Time leaving home to go to work
![Time leaving home to go to work]()
- 3412:00 a.m. to 4:59 a.m.
- 125:00 a.m. to 5:29 a.m.
- 395:30 a.m. to 5:59 a.m.
- 496:00 a.m. to 6:29 a.m.
- 496:30 a.m. to 6:59 a.m.
- 1247:00 a.m. to 7:29 a.m.
- 1017:30 a.m. to 7:59 a.m.
- 708:00 a.m. to 8:29 a.m.
- 558:30 a.m. to 8:59 a.m.
- 629:00 a.m. to 9:59 a.m.
- 2210:00 a.m. to 10:59 a.m.
- 611:00 a.m. to 11:59 a.m.
- 3012:00 p.m. to 3:59 p.m.
- 534:00 p.m. to 11:59 p.m.

Occupations of males:
- Percentage of males in management occupations (except farmers):
Here: 25.1% city: 13.0%
- Percentage of males in business and financial operations occupations:
Here: 3.0% city: 4.6%
- Percentage of males in computer and mathematical occupations:
Here: 9.9% city: 13.6%
- Percentage of males in architecture and engineering occupations:
Here: 7.0% city: 10.2%
- Percentage of males in education, training, and library occupations:
Here: 6.0% city: 2.8%
- Percentage of males in healthcare practitioners and technical occupations:
Here: 1.4% city: 2.0%
- Percentage of males in service occupations:
Here: 11.6% city: 12.7%
- Percentage of males in sales and office occupations:
Here: 12.7% city: 12.8%
- Percentage of males in construction, extraction, and maintenance occupations:
Here: 2.4% city: 7.8%
- Percentage of males in production occupations:
Here: 3.0% city: 5.5%
- Percentage of males in material moving occupations:
Here: 12.8% city: 3.1%
Occupations of females:
- Percentage of females in management occupations (except farmers):
Here: 13.1% city: 11.0%
- Percentage of females in business and financial operations occupations:
Here: 7.6% city: 8.6%
- Percentage of females in architecture and engineering occupations:
Here: 5.8% city: 2.8%
- Percentage of females in life, physical, and social science occupations:
Here: 1.2% city: 1.7%
- Percentage of females in education, training, and library occupations:
Here: 19.7% city: 8.1%
- Percentage of females in healthcare practitioners and technical occupations:
Here: 3.4% city: 6.8%
- Percentage of females in service occupations:
Here: 34.1% city: 21.7%
- Percentage of females in sales and office occupations:
Here: 14.9% city: 22.0%
- Percentage of females in construction, extraction, and maintenance occupations:
Here: 4.0% city: 0.2%
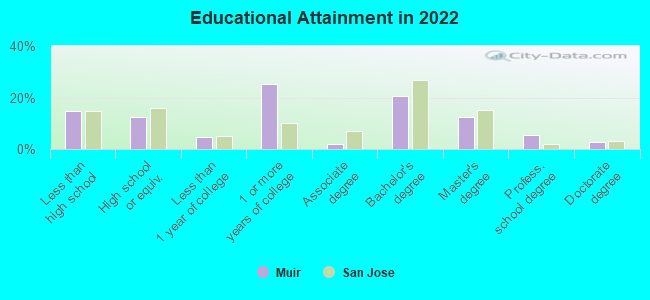
Education in this neighborhood (subdivision or community):
- Percentage of people 3 years and older in K-12 schools:
Muir: 14.8% San Jose: 16.1%
- Percentage of people 3 years and older in undergraduate colleges:
Muir: 4.9% San Jose: 6.5%
- Percentage of people 3 years and older in grad. or professional schools:
Muir: 2.6% San Jose: 2.0%
- Percentage of students K-12 enrolled in private schools:
Muir: 35.5% San Jose: 14.9%
Percentage of population below poverty level:
| Muir: | 3.7% |
| San Jose: | 9.0% |
Median year owner moved in (as recorded in 2022):
| Muir: | 2005 |
| San Jose: | 2008 |
Percentage of married-couple families with both working:
| Muir: | 70.3% |
| San Jose: | 72.5% |
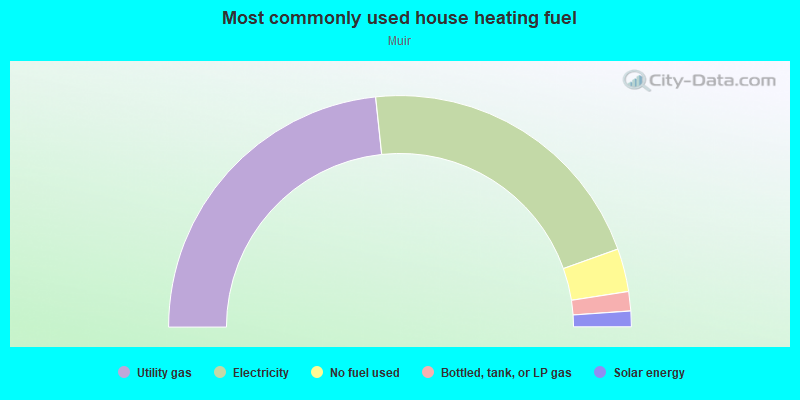
- 46.6%Utility gas
- 42.4%Electricity
- 6.0%No fuel used
- 2.7%Bottled, tank, or LP gas
- 2.2%Solar energy
Roads and streets:
Cherry Ave
Length: 0.39 miles
Direction: E-W
Address range: 4960 to 4999
Direction: E-W
Address range: 4960 to 4999
Norma Jean Way
Length: 0.26 miles
Directions: E-W, N-S, SE-NW, SW-NE
Address range: 1131 to 1543
Directions: E-W, N-S, SE-NW, SW-NE
Address range: 1131 to 1543
Cherryview Ct
Length: 0.26 miles
Directions: E-W, N-S, SE-NW, SW-NE
Directions: E-W, N-S, SE-NW, SW-NE
Speak Ln
Length: 0.25 miles
Directions: E-W, N-S, SE-NW
Address range: 4846 to 4999
Directions: E-W, N-S, SE-NW
Address range: 4846 to 4999
Cedar Gables Dr
Length: 0.23 miles
Directions: E-W, N-S, SE-NW, SW-NE
Directions: E-W, N-S, SE-NW, SW-NE
Luchessi Dr
Length: 0.23 miles
Directions: E-W, N-S, SE-NW, SW-NE
Address range: 1100 to 1199
Directions: E-W, N-S, SE-NW, SW-NE
Address range: 1100 to 1199
Cherryview Ln
Length: 0.18 miles
Direction: E-W
Address range: 1116 to 1199
Direction: E-W
Address range: 1116 to 1199
Quail Run Ct
Length: 0.10 miles
Directions: E-W, N-S, SE-NW, SW-NE
Address range: 1100 to 1199
Directions: E-W, N-S, SE-NW, SW-NE
Address range: 1100 to 1199
Edgar Ct
Length: 0.10 miles
Direction: SE-NW
Address range: 4900 to 4999
Direction: SE-NW
Address range: 4900 to 4999
Robertsville Ct
Length: 0.09 miles
Directions: E-W, SE-NW
Address range: 500 to 599
Directions: E-W, SE-NW
Address range: 500 to 599
Odyssey Ct
Length: 0.09 miles
Directions: E-W, SW-NE
Address range: 1100 to 1112
Directions: E-W, SW-NE
Address range: 1100 to 1112
Dinkel Ct
Length: 0.06 miles
Directions: E-W, SW-NE
Address range: 1109 to 1199
Directions: E-W, SW-NE
Address range: 1109 to 1199
Geomax Ct
Length: 0.06 miles
Direction: N-S
Address range: 4900 to 4970
Direction: N-S
Address range: 4900 to 4970
Yvette Ct
Length: 0.05 miles
Directions: E-W, SW-NE
Address range: 1100 to 1199
Directions: E-W, SW-NE
Address range: 1100 to 1199
Robertsview Ct
Length: 0.05 miles
Directions: E-W, N-S, SE-NW
Directions: E-W, N-S, SE-NW
Illiad Ct
Length: 0.04 miles
Directions: E-W, SW-NE
Address range: 1101 to 1199
Directions: E-W, SW-NE
Address range: 1101 to 1199
Marlene Ct
Length: 0.04 miles
Direction: E-W
Address range: 1501 to 1599
Direction: E-W
Address range: 1501 to 1599
Blake Ln
Length: 0.03 miles
Direction: SE-NW
Direction: SE-NW
Claycomb Ct
Length: 0.02 miles
Direction: E-W
Direction: E-W