Mt. Oliver neighborhood in Pittsburgh, Pennsylvania (PA), 15210 detailed profile
Settings
X


Business Search - 14 Million verified businesses
Area: 0.103 square miles
Population: 1,219
Population density:
| Mt. Oliver: | 11,847 people per square mile |
| Pittsburgh: | 5,449 people per square mile |

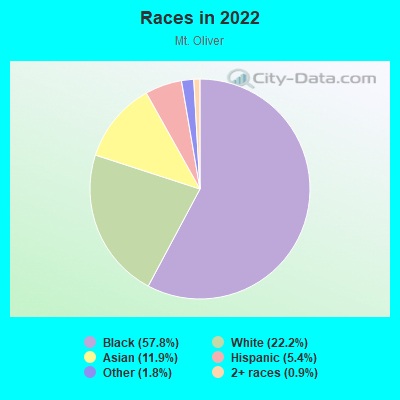
- 76657.8%Black
- 29422.2%White
- 15811.9%Asian
- 715.4%Hispanic or Latino
- 241.8%Some other race
- 120.9%Two or more races
Median household income in 2022:
| Mt. Oliver: | $24,534 |
| Pittsburgh: | $63,380 |
Distribution of median household income
![Distribution of median household income]()
- 58Less than $10,000
- 42$10,000 to $19,999
- 249$20,000 to $29,999
- 27$30,000 to $39,999
- 12$40,000 to $49,999
- 52$50,000 to $59,999
- 11$60,000 to $74,999
- 92$75,000 to $99,999
- 19$100,000 to $124,999
- 15$125,000 to $149,999
- 5$200,000 or more

Distribution of owner-occupied house/condo value
![Distribution of owner-occupied house/condo value]()
- 43Less than $50,000
- 112$50,000 to $99,999
- 98$100,000 to $149,999
- 3$150,000 to $199,999
- 5$400,000 to $499,999

Distribution of rent paid by renters
![Distribution of rent paid by renters]()
- 4$100 to $199
- 7$200 to $299
- 10$300 to $399
- 28$400 to $499
- 22$500 to $599
- 30$600 to $699
- 253$700 to $799
- 89$800 to $899
- 12$900 to $999
- 12$1,000 to $1,249
- 6$1,250 to $1,499
- 52$1,500 to $1,999

Median rent in 2022:
| Mt. Oliver: | $786 |
| Pittsburgh: | $981 |
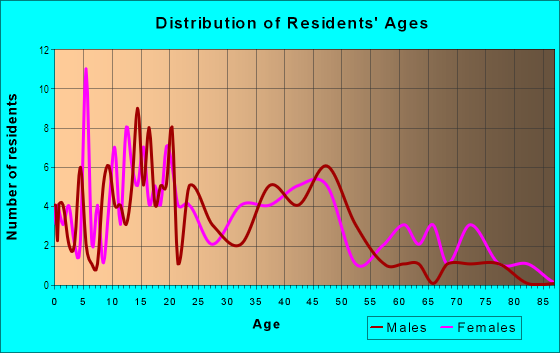
| Males: | 538 |
| Females: | 680 |
Males:
| This neighborhood: | 17.1 years |
| Whole city: | 33.3 years |
| This neighborhood: | 29.7 years |
| Whole city: | 32.9 years |
Average household size:
| Mt. Oliver: | 2.3 people |
| Pittsburgh: | 24.0 people |
Percentage of family households:
| Mt. Oliver: | 32.2% |
| Pittsburgh: | 28.6% |
| Here: | 13.5% |
| Pittsburgh: | 27.2% |
Percentage of married-couple families with children (among all households):
| Mt. Oliver: | 14.2% |
| Pittsburgh: | 24.6% |
Percentage of single-mother households (among all households):
| Mt. Oliver: | 8.0% |
| Pittsburgh: | 14.6% |
Percentage of never married males 15 years old and over:
Percentage of never married females 15 years old and over:
| Mt. Oliver: | 8.8% |
| Pittsburgh: | 28.4% |
Percentage of never married females 15 years old and over:
| Mt. Oliver: | 49.6% |
| city: | 27.6% |
Percentage of people born in this state:
Percentage of people born in another U.S. state:
Percentage of native residents but born outside the U.S.:
Percentage of foreign born residents:
| Here: | 80.6% |
| Pittsburgh: | 65.9% |
Percentage of people born in another U.S. state:
| Mt. Oliver: | 12.3% |
| Pittsburgh: | 24.4% |
Percentage of native residents but born outside the U.S.:
| Here: | 4.1% |
| city: | 1.5% |
Percentage of foreign born residents:
| Here: | 3.0% |
| Pittsburgh: | 8.2% |
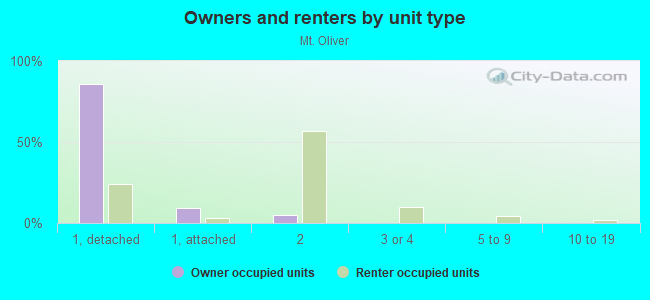
Owner-occupied
Renter-occupied

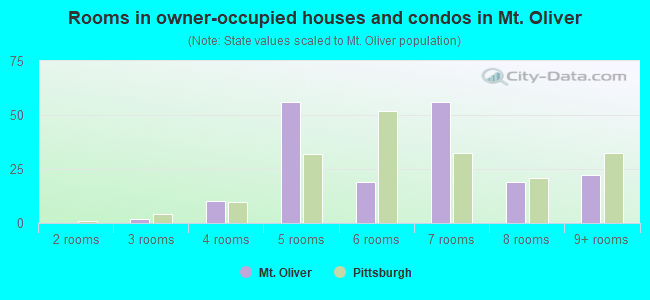
- Rooms in owner-occupied houses and condos in Mt. Oliver
- 01 room
- 02 rooms
- 23 rooms
- 104 rooms
- 565 rooms
- 196 rooms
- 567 rooms
- 198 rooms
- 229+ rooms
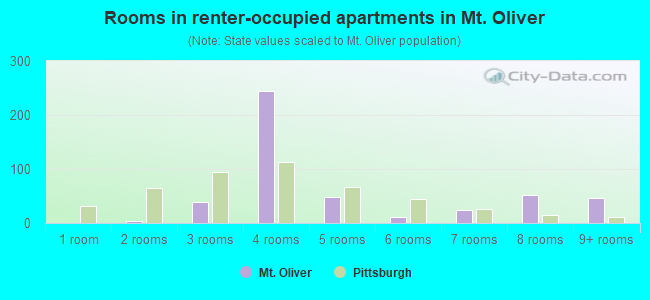
- Rooms in renter-occupied apartments in Mt. Oliver
- 01 room
- 42 rooms
- 383 rooms
- 2444 rooms
- 485 rooms
- 126 rooms
- 247 rooms
- 518 rooms
- 479+ rooms
Owner-occupied
Renter-occupied
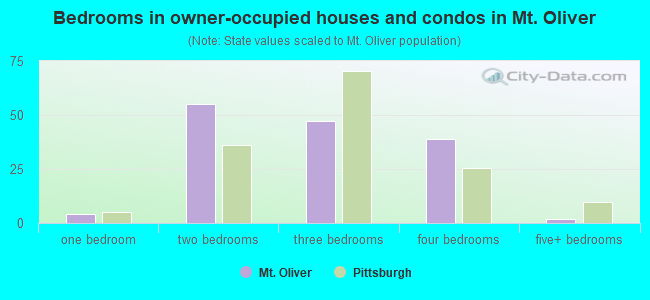
- Bedrooms in owner-occupied houses and condos in Mt. Oliver
- 0no bedroom
- 41 bedroom
- 552 bedrooms
- 473 bedrooms
- 394 bedrooms
- 25+ bedrooms
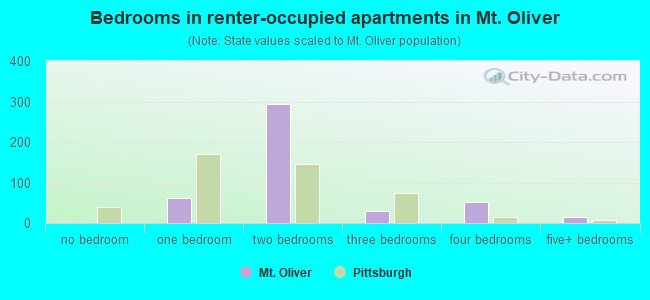
- Bedrooms in renter-occupied apartments in Mt. Oliver
- 0no bedroom
- 621 bedroom
- 2932 bedrooms
- 303 bedrooms
- 514 bedrooms
- 165+ bedrooms
Average number of cars or other vehicles available in houses/condos:
Average number of cars or other vehicles available in apartments:
| This neighborhood: | 1.6 |
| Pittsburgh: | 1.5 |
Average number of cars or other vehicles available in apartments:
| Here: | 0.3 |
| city: | 0.9 |
Percentage of units with a mortgage:
| Mt. Oliver: | 71.2% |
| Pittsburgh: | 56.7% |
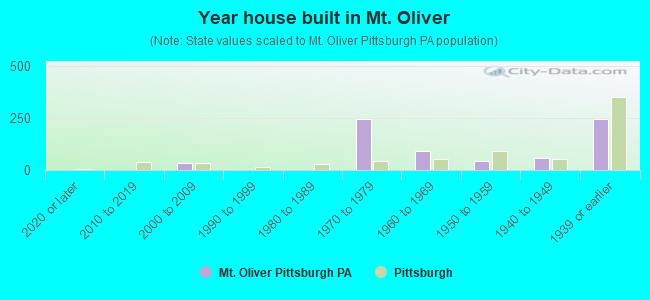
- Year house built in Mt. Oliver
- 02020 or later
- 02010 to 2019
- 342000 to 2009
- 01990 to 1999
- 01980 to 1989
- 2441970 to 1979
- 931960 to 1969
- 431950 to 1959
- 591940 to 1949
- 2451939 or earlier
City-data.com crime index for city in 2019 (higher means more crime):
| City: | 257.1 |
| U.S. average: | 223.9 |
Travel time to work (commute)
![Travel time to work (commute)]()
- 2Less than 5 minutes
- 35 to 9 minutes
- 5210 to 14 minutes
- 3215 to 19 minutes
- 4620 to 24 minutes
- 3625 to 29 minutes
- 3430 to 34 minutes
- 1135 to 39 minutes
- 1940 to 44 minutes
- 5145 to 59 minutes
- 5660 to 89 minutes
- 4090 or more minutes

Means of transportation to work
![Means of transportation to work]()
- 43.9%246Drove a car alone
- 9.1%51Carpooled
- 41.7%234Bus
- 1.4%8Walked
- 5.0%28Worked at home

Time leaving home to go to work
![Time leaving home to go to work]()
- 105:00 a.m. to 5:29 a.m.
- 625:30 a.m. to 5:59 a.m.
- 366:00 a.m. to 6:29 a.m.
- 406:30 a.m. to 6:59 a.m.
- 547:00 a.m. to 7:29 a.m.
- 77:30 a.m. to 7:59 a.m.
- 208:00 a.m. to 8:29 a.m.
- 48:30 a.m. to 8:59 a.m.
- 139:00 a.m. to 9:59 a.m.
- 611:00 a.m. to 11:59 a.m.
- 3612:00 p.m. to 3:59 p.m.
- 774:00 p.m. to 11:59 p.m.

Occupations of males:
- Percentage of males in management occupations (except farmers):
Here: 23.2% city: 11.1%
- Percentage of males in business and financial operations occupations:
Here: 9.3% city: 8.0%
- Percentage of males in computer and mathematical occupations:
Here: 11.3% city: 9.0%
- Percentage of males in architecture and engineering occupations:
Here: 3.6% city: 3.4%
- Percentage of males in community and social services occupations:
Here: 3.6% city: 1.6%
- Percentage of males in education, training, and library occupations:
Here: 8.0% city: 7.0%
- Percentage of males in service occupations:
Here: 33.0% city: 14.7%
- Percentage of males in sales and office occupations:
Here: 13.9% city: 12.2%
- Percentage of males in construction, extraction, and maintenance occupations:
Here: 10.3% city: 5.0%
- Percentage of males in production occupations:
Here: 14.4% city: 3.3%
- Percentage of males in transportation occupations:
Here: 7.7% city: 4.4%
- Percentage of males in material moving occupations:
Here: 41.2% city: 3.8%
Occupations of females:
- Percentage of females in computer and mathematical occupations:
Here: 9.1% city: 2.8%
- Percentage of females in life, physical, and social science occupations:
Here: 8.0% city: 2.1%
- Percentage of females in legal occupations:
Here: 11.8% city: 2.3%
- Percentage of females in education, training, and library occupations:
Here: 3.2% city: 9.9%
- Percentage of females in healthcare practitioners and technical occupations:
Here: 1.1% city: 10.9%
- Percentage of females in service occupations:
Here: 64.9% city: 20.1%
- Percentage of females in sales and office occupations:
Here: 2.9% city: 23.5%
- Percentage of females in transportation occupations:
Here: 5.3% city: 0.8%
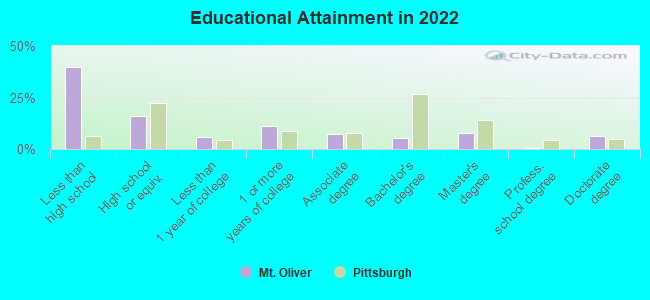
Education in this neighborhood (subdivision or community):
- Percentage of people 3 years and older in K-12 schools:
Mt. Oliver: 32.6% Pittsburgh: 10.4%
- Percentage of people 3 years and older in undergraduate colleges:
Mt. Oliver: 1.5% Pittsburgh: 12.9%
- Percentage of people 3 years and older in grad. or professional schools:
Mt. Oliver: 0.9% Pittsburgh: 4.1%
- Percentage of students K-12 enrolled in private schools:
Mt. Oliver: 0.0% Pittsburgh: 19.6%
Percentage of population below poverty level:
| Mt. Oliver: | 25.2% |
| Pittsburgh: | 19.0% |
Median year owner moved in (as recorded in 2022):
Median year renter moved in (as recorded in 2022):
| Mt. Oliver: | 2005 |
| Pittsburgh: | 2007 |
Median year renter moved in (as recorded in 2022):
| Mt. Oliver: | 2015 |
| Pittsburgh: | 2020 |
Percentage of married-couple families with both working:
| Mt. Oliver: | 25.6% |
| Pittsburgh: | 79.2% |
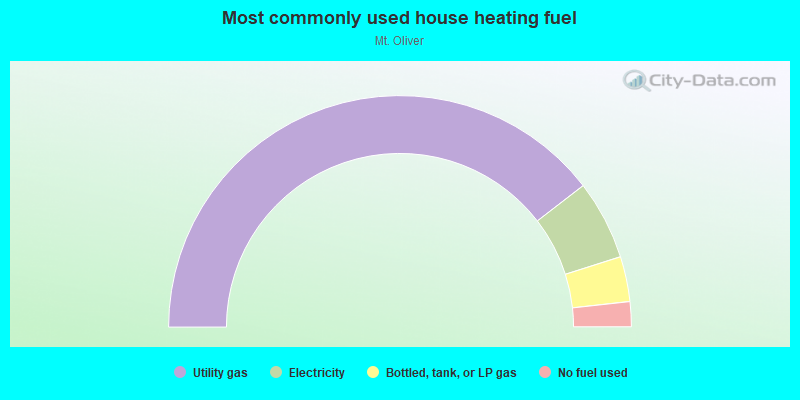
- 79.1%Utility gas
- 11.1%Electricity
- 6.3%Bottled, tank, or LP gas
- 3.5%No fuel used
Roads and streets:
Burr St
Length: 0.27 miles
Directions: N-S, SE-NW
Address range: 100 to 599
Directions: N-S, SE-NW
Address range: 100 to 599
Fisher St
Length: 0.27 miles
Direction: E-W
Address range: 400 to 699
Direction: E-W
Address range: 400 to 699
St Joseph St
Length: 0.27 miles
Directions: E-W, SE-NW
Address range: 444 to 599
Directions: E-W, SE-NW
Address range: 444 to 599
Rectenwald St
Length: 0.24 miles
Directions: N-S, SE-NW, SW-NE
Address range: 400 to 898
Directions: N-S, SE-NW, SW-NE
Address range: 400 to 898
Mountain Ave
Length: 0.20 miles
Direction: N-S
Address range: 400 to 715
Direction: N-S
Address range: 400 to 715
Cathedral Ave
Length: 0.19 miles
Directions: E-W, SE-NW
Address range: 410 to 599
Directions: E-W, SE-NW
Address range: 410 to 599
Wirt Way
Length: 0.18 miles
Direction: E-W
Direction: E-W
Ignatius Way
Length: 0.17 miles
Direction: E-W
Direction: E-W
Walde St
Length: 0.16 miles
Direction: E-W
Address range: 410 to 599
Direction: E-W
Address range: 410 to 599
Mc Manus St
Length: 0.15 miles
Direction: E-W
Address range: 450 to 499
Direction: E-W
Address range: 450 to 499
Ormsby St
Length: 0.14 miles
Direction: E-W
Address range: 480 to 617
Direction: E-W
Address range: 480 to 617
Gorgas St
Length: 0.10 miles
Direction: N-S
Address range: 400 to 549
Direction: N-S
Address range: 400 to 549
Bede Way
Length: 0.08 miles
Direction: N-S
Direction: N-S
Poco Way
Length: 0.07 miles
Directions: E-W, SW-NE
Directions: E-W, SW-NE
Dati Way
Length: 0.05 miles
Directions: E-W, N-S, SE-NW
Directions: E-W, N-S, SE-NW
Farina Way
Length: 0.04 miles
Directions: N-S, SE-NW, SW-NE
Address range: 400 to 549
Directions: N-S, SE-NW, SW-NE
Address range: 400 to 549
Caus Way
Length: 0.04 miles
Direction: E-W
Direction: E-W
Farina St
Length: 0.03 miles
Direction: N-S
Address range: 500 to 599
Direction: N-S
Address range: 500 to 599
Como St
Length: 0.02 miles
Directions: N-S, SE-NW
Directions: N-S, SE-NW
Raton St
Length: 0.02 miles
Directions: N-S, SW-NE
Directions: N-S, SW-NE