Mt Pleasant Park neighborhood in Baltimore, Maryland (MD), 21239 detailed profile
Settings
X


Business Search - 14 Million verified businesses
Area: 0.271 square miles
Population: 1,525
Population density:
| Mt Pleasant Park: | 5,622 people per square mile |
| Baltimore: | 7,053 people per square mile |

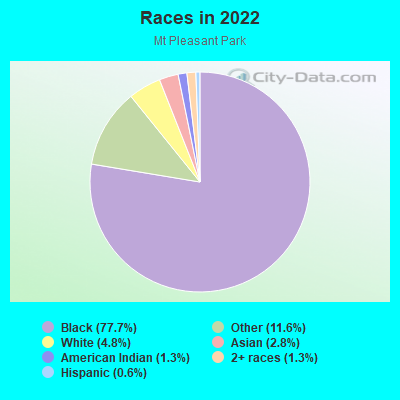
- 1,39577.7%Black
- 20811.6%Some other race
- 864.8%White
- 512.8%Asian
- 231.3%American Indian
- 231.3%Two or more races
- 100.6%Hispanic or Latino
Median household income in 2022:
| Mt Pleasant Park: | $59,518 |
| Baltimore: | $55,198 |
Distribution of median household income
![Distribution of median household income]()
- 32Less than $10,000
- 116$10,000 to $19,999
- 144$20,000 to $29,999
- 71$30,000 to $39,999
- 130$40,000 to $49,999
- 34$50,000 to $59,999
- 78$60,000 to $74,999
- 147$75,000 to $99,999
- 49$100,000 to $124,999
- 24$125,000 to $149,999
- 39$150,000 to $199,999
- 41$200,000 or more

Distribution of owner-occupied house/condo value
![Distribution of owner-occupied house/condo value]()
- 167Less than $50,000
- 22$50,000 to $99,999
- 112$100,000 to $149,999
- 118$150,000 to $199,999
- 89$200,000 to $249,999
- 37$250,000 to $299,999
- 11$300,000 to $399,999
- 3$400,000 to $499,999
- 5$500,000 to $749,999
- 6$1,000,000 or more

Distribution of rent paid by renters
![Distribution of rent paid by renters]()
- 8Less than $100
- 32$200 to $299
- 37$300 to $399
- 253$400 to $499
- 22$500 to $599
- 26$600 to $699
- 496$700 to $799
- 19$800 to $899
- 53$900 to $999
- 120$1,000 to $1,249
- 59$1,250 to $1,499
- 42$1,500 to $1,999
- 19$2,000 or more

Median rent in 2022:
| Mt Pleasant Park: | $1,113 |
| Baltimore: | $1,043 |
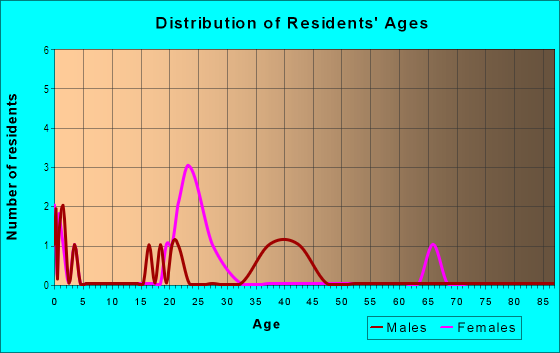
| Males: | 605 |
| Females: | 920 |
Males:
| This neighborhood: | 42.7 years |
| Whole city: | 35.0 years |
| This neighborhood: | 41.0 years |
| Whole city: | 38.2 years |
Average household size:
| Mt Pleasant Park: | 1.9 people |
| Baltimore: | 2.2 people |
Percentage of family households:
| Mt Pleasant Park: | 30.2% |
| Baltimore: | 34.2% |
| Here: | 19.8% |
| Baltimore: | 23.3% |
Percentage of married-couple families with children (among all households):
| Mt Pleasant Park: | 28.1% |
| Baltimore: | 22.4% |
Percentage of single-mother households (among all households):
| Mt Pleasant Park: | 9.4% |
| Baltimore: | 18.7% |
Percentage of never married males 15 years old and over:
Percentage of never married females 15 years old and over:
| Mt Pleasant Park: | 19.8% |
| Baltimore: | 25.1% |
Percentage of never married females 15 years old and over:
| Mt Pleasant Park: | 30.0% |
| city: | 27.5% |
Percentage of people that speak English not well or not at all:
| Mt Pleasant Park: | 0.8% |
| Baltimore: | 2.3% |
Percentage of people born in this state:
Percentage of people born in another U.S. state:
Percentage of native residents but born outside the U.S.:
Percentage of foreign born residents:
| Here: | 73.8% |
| Baltimore: | 64.4% |
Percentage of people born in another U.S. state:
| Mt Pleasant Park: | 18.6% |
| Baltimore: | 25.0% |
Percentage of native residents but born outside the U.S.:
| Here: | 1.9% |
| city: | 0.9% |
Percentage of foreign born residents:
| Here: | 5.8% |
| Baltimore: | 9.7% |
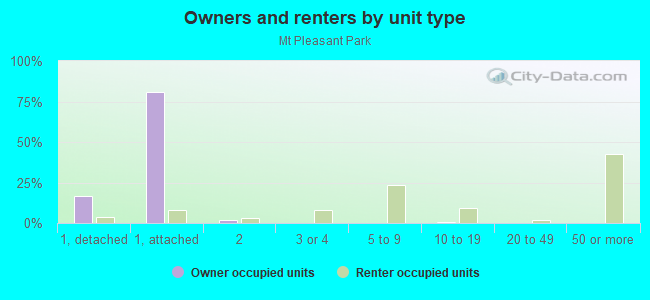
Owner-occupied
Renter-occupied

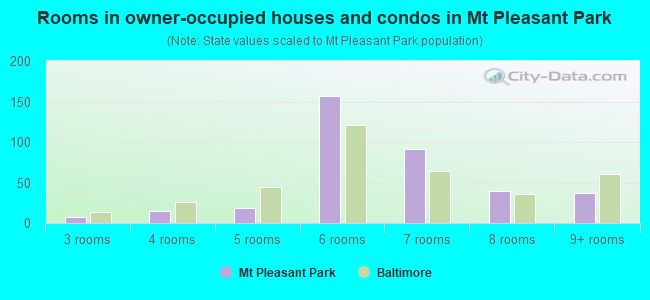
- Rooms in owner-occupied houses and condos in Mt Pleasant Park
- 01 room
- 02 rooms
- 83 rooms
- 154 rooms
- 195 rooms
- 1576 rooms
- 917 rooms
- 408 rooms
- 379+ rooms
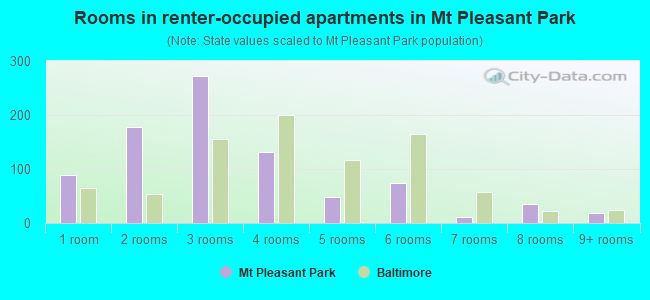
- Rooms in renter-occupied apartments in Mt Pleasant Park
- 881 room
- 1772 rooms
- 2723 rooms
- 1314 rooms
- 485 rooms
- 756 rooms
- 117 rooms
- 358 rooms
- 199+ rooms
Owner-occupied
Renter-occupied
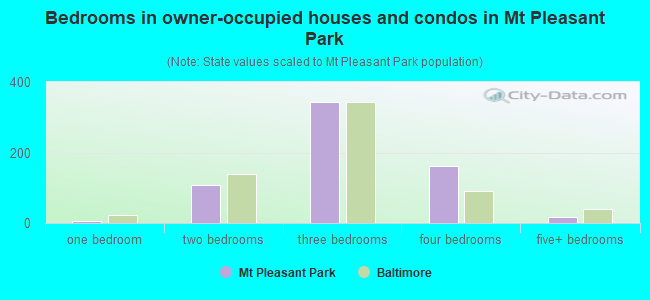
- Bedrooms in owner-occupied houses and condos in Mt Pleasant Park
- 0no bedroom
- 71 bedroom
- 1092 bedrooms
- 3433 bedrooms
- 1624 bedrooms
- 175+ bedrooms
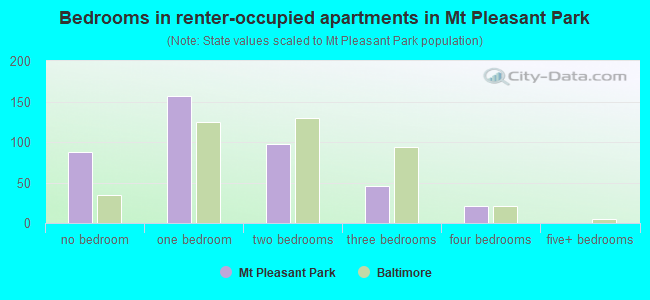
- Bedrooms in renter-occupied apartments in Mt Pleasant Park
- 88no bedroom
- 1571 bedroom
- 982 bedrooms
- 463 bedrooms
- 214 bedrooms
- 05+ bedrooms
Average number of cars or other vehicles available in houses/condos:
Average number of cars or other vehicles available in apartments:
| This neighborhood: | |
| Baltimore: |
Average number of cars or other vehicles available in apartments:
| Here: | 0.7 |
| city: | 0.8 |
Percentage of units with a mortgage:
| Mt Pleasant Park: | 53.8% |
| Baltimore: | 64.3% |
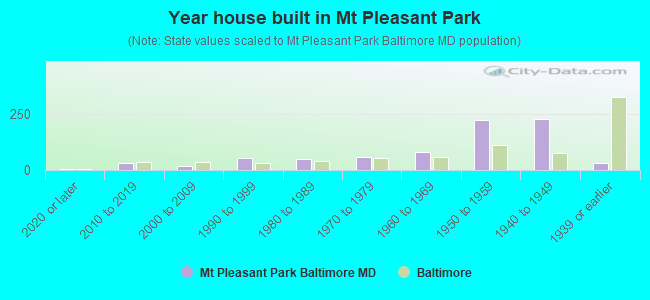
- Year house built in Mt Pleasant Park
- 42020 or later
- 302010 to 2019
- 182000 to 2009
- 521990 to 1999
- 491980 to 1989
- 561970 to 1979
- 811960 to 1969
- 2211950 to 1959
- 2261940 to 1949
- 331939 or earlier
Travel time to work (commute)
![Travel time to work (commute)]()
- 4Less than 5 minutes
- 765 to 9 minutes
- 2810 to 14 minutes
- 11215 to 19 minutes
- 14020 to 24 minutes
- 4725 to 29 minutes
- 9030 to 34 minutes
- 2135 to 39 minutes
- 4640 to 44 minutes
- 5145 to 59 minutes
- 1460 to 89 minutes
- 2290 or more minutes

Means of transportation to work
![Means of transportation to work]()
- 77.0%542Drove a car alone
- 6.7%47Carpooled
- 3.4%24Bus
- 4.4%31Subway or elevated rail
- 5.0%35Ferryboat
- 3.6%25Taxi
- 1.4%10Bicycle
- 4.4%31Walked
- 11.5%81Other means
- 10.4%73Worked at home

Time leaving home to go to work
![Time leaving home to go to work]()
- 1612:00 a.m. to 4:59 a.m.
- 175:00 a.m. to 5:29 a.m.
- 715:30 a.m. to 5:59 a.m.
- 226:00 a.m. to 6:29 a.m.
- 766:30 a.m. to 6:59 a.m.
- 1157:00 a.m. to 7:29 a.m.
- 757:30 a.m. to 7:59 a.m.
- 708:00 a.m. to 8:29 a.m.
- 198:30 a.m. to 8:59 a.m.
- 149:00 a.m. to 9:59 a.m.
- 1210:00 a.m. to 10:59 a.m.
- 4711:00 a.m. to 11:59 a.m.
- 5412:00 p.m. to 3:59 p.m.
- 674:00 p.m. to 11:59 p.m.

Occupations of males:
- Percentage of males in business and financial operations occupations:
Here: 3.8% city: 5.9%
- Percentage of males in computer and mathematical occupations:
Here: 1.6% city: 6.1%
- Percentage of males in community and social services occupations:
Here: 1.6% city: 1.6%
- Percentage of males in education, training, and library occupations:
Here: 1.7% city: 5.4%
- Percentage of males in service occupations:
Here: 25.1% city: 14.7%
- Percentage of males in sales and office occupations:
Here: 20.6% city: 14.2%
- Percentage of males in construction, extraction, and maintenance occupations:
Here: 7.2% city: 5.6%
- Percentage of males in production occupations:
Here: 3.1% city: 4.2%
- Percentage of males in transportation occupations:
Here: 9.6% city: 6.8%
- Percentage of males in material moving occupations:
Here: 4.0% city: 7.0%
Occupations of females:
- Percentage of females in management occupations (except farmers):
Here: 2.1% city: 10.1%
- Percentage of females in business and financial operations occupations:
Here: 3.9% city: 6.6%
- Percentage of females in computer and mathematical occupations:
Here: 3.9% city: 2.4%
- Percentage of females in community and social services occupations:
Here: 4.1% city: 3.6%
- Percentage of females in legal occupations:
Here: 1.8% city: 1.8%
- Percentage of females in education, training, and library occupations:
Here: 4.6% city: 10.7%
- Percentage of females in healthcare practitioners and technical occupations:
Here: 6.2% city: 9.8%
- Percentage of females in service occupations:
Here: 22.7% city: 20.4%
- Percentage of females in sales and office occupations:
Here: 46.7% city: 22.3%
- Percentage of females in production occupations:
Here: 1.5% city: 2.3%
- Percentage of females in material moving occupations:
Here: 2.1% city: 1.9%
Percentage of people 16-64 in Armed Forces:
| Mt Pleasant Park: | 0.2% |
| Baltimore: | 0.4% |
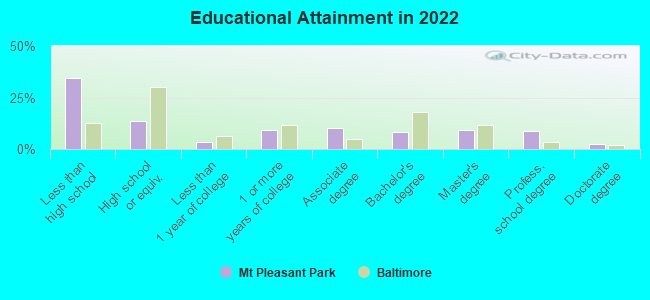
Education in this neighborhood (subdivision or community):
- Percentage of people 3 years and older in K-12 schools:
Mt Pleasant Park: 27.9% Baltimore: 14.7%
- Percentage of people 3 years and older in undergraduate colleges:
Mt Pleasant Park: 11.6% Baltimore: 6.0%
- Percentage of people 3 years and older in grad. or professional schools:
Mt Pleasant Park: 7.8% Baltimore: 2.8%
- Percentage of students K-12 enrolled in private schools:
Mt Pleasant Park: 27.4% Baltimore: 12.7%
Percentage of population below poverty level:
| Mt Pleasant Park: | 10.0% |
| Baltimore: | 18.5% |
Median year renter moved in (as recorded in 2022):
| Mt Pleasant Park: | 2017 |
| Baltimore: | 2019 |
Percentage of married-couple families with both working:
| Mt Pleasant Park: | 165.5% |
| Baltimore: | 79.2% |
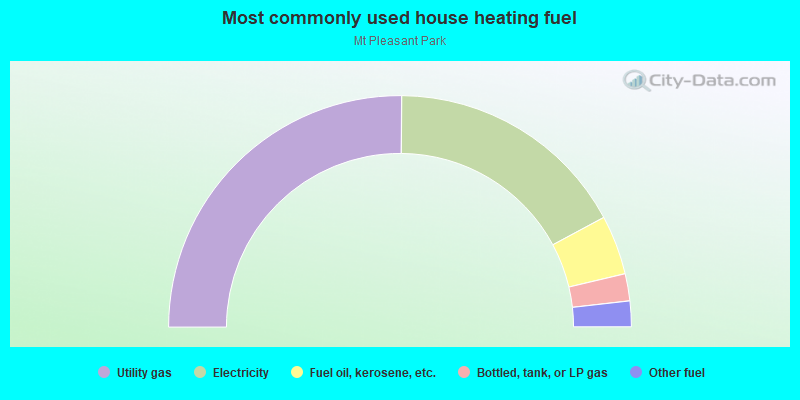
- 50.3%Utility gas
- 34.1%Electricity
- 8.3%Fuel oil, kerosene, etc.
- 3.8%Bottled, tank, or LP gas
- 3.6%Other fuel
Highways in this neighborhood:
State Hwy 41 (Perring Pkwy, Hillen Rd)
Length: 0.36 miles
Directions: N-S, SW-NE
Address range: 6112 to 6197
Directions: N-S, SW-NE
Address range: 6112 to 6197
Roads and streets:
Perring Pkwy
Length: 1.29 miles
Directions: N-S, SW-NE
Address range: 5700 to 6699
Directions: N-S, SW-NE
Address range: 5700 to 6699
E Northern Pkwy
Length: 0.68 miles
Direction: E-W
Direction: E-W
Other features:
Herring Run
Length: 0.79 miles
Directions: N-S, SE-NW, SW-NE
Directions: N-S, SE-NW, SW-NE