Morgan State University neighborhood in Baltimore, Maryland (MD), 21239, 21251 detailed profile
Settings
X

Business Search - 14 Million verified businesses
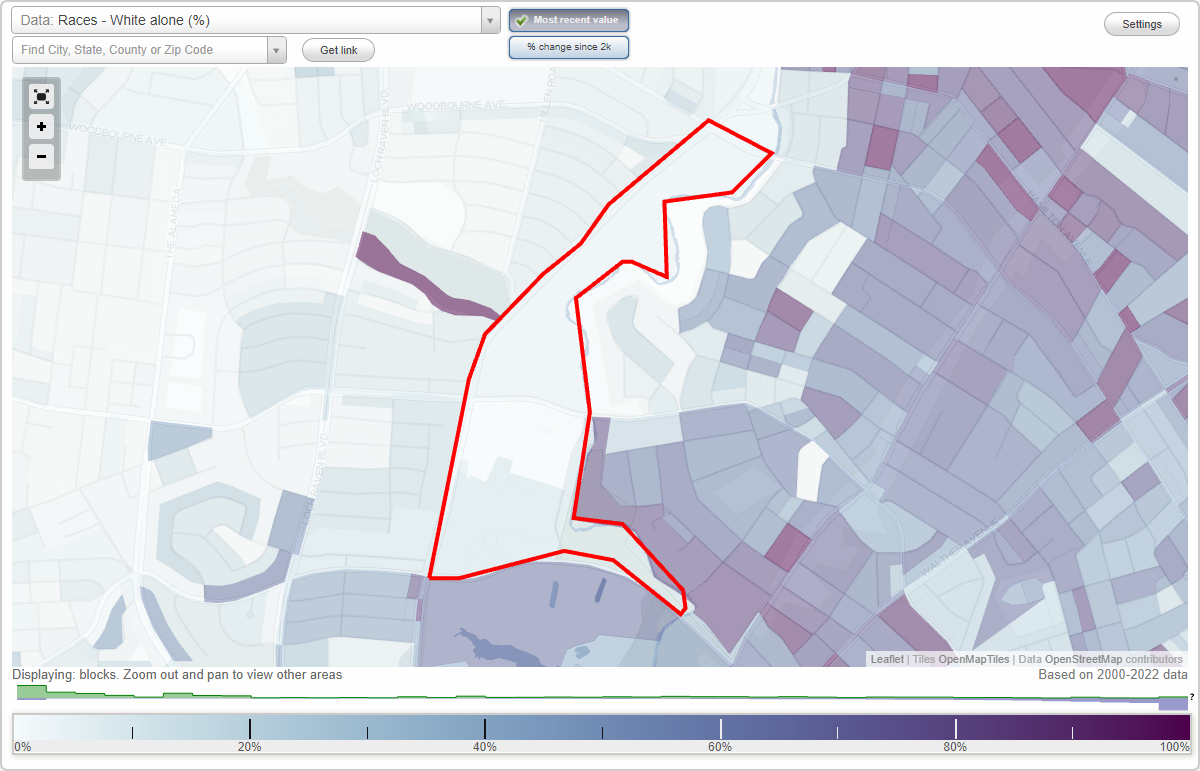
Area: 0.261 square miles
Population: 2,257
Population density:
| Morgan State University: | 8,646 people per square mile |
| Baltimore: | 7,053 people per square mile |

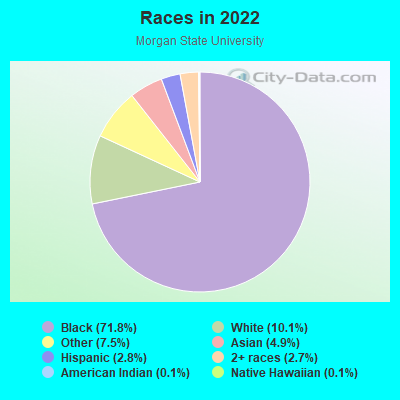
- 1,69471.8%Black
- 23810.1%White
- 1787.5%Some other race
- 1154.9%Asian
- 662.8%Hispanic or Latino
- 632.7%Two or more races
- 30.1%American Indian
- 30.1%Native Hawaiian and Other
Pacific Islander
Median household income in 2022:
| Morgan State University: | $75,377 |
| Baltimore: | $55,198 |
Distribution of median household income
![Distribution of median household income]()
- 25Less than $10,000
- 75$10,000 to $19,999
- 45$20,000 to $29,999
- 44$30,000 to $39,999
- 158$40,000 to $49,999
- 51$50,000 to $59,999
- 98$60,000 to $74,999
- 38$75,000 to $99,999
- 61$100,000 to $124,999
- 79$125,000 to $149,999
- 31$150,000 to $199,999
- 44$200,000 or more

Distribution of owner-occupied house/condo value
![Distribution of owner-occupied house/condo value]()
- 180Less than $50,000
- 62$50,000 to $99,999
- 103$100,000 to $149,999
- 158$150,000 to $199,999
- 100$200,000 to $249,999
- 35$250,000 to $299,999
- 46$300,000 to $399,999
- 18$400,000 to $499,999
- 9$500,000 to $749,999
- 21$750,000 to $999,999
- 31$1,000,000 or more

Distribution of rent paid by renters
![Distribution of rent paid by renters]()
- 13$200 to $299
- 11$300 to $399
- 52$400 to $499
- 3$500 to $599
- 3$600 to $699
- 5$700 to $799
- 41$800 to $899
- 109$900 to $999
- 55$1,000 to $1,249
- 46$1,250 to $1,499
- 50$1,500 to $1,999
- 7$2,000 or more

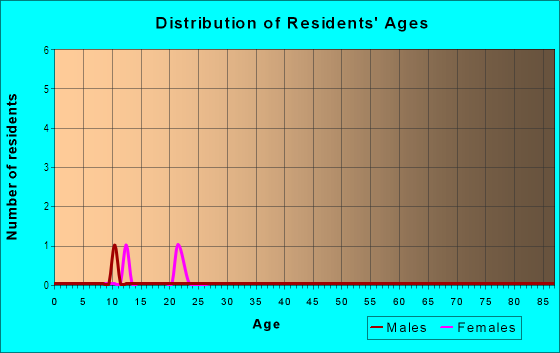
| Males: | 1,135 |
| Females: | 1,122 |
Males:
| This neighborhood: | 30.5 years |
| Whole city: | 35.0 years |
| This neighborhood: | 37.6 years |
| Whole city: | 38.2 years |
Average household size:
| Morgan State University: | 4.7 people |
| Baltimore: | 2.2 people |
Percentage of family households:
| Morgan State University: | 29.1% |
| Baltimore: | 34.2% |
| Here: | 35.1% |
| Baltimore: | 23.3% |
Percentage of married-couple families with children (among all households):
| Morgan State University: | 23.8% |
| Baltimore: | 22.4% |
Percentage of single-mother households (among all households):
| Morgan State University: | 7.0% |
| Baltimore: | 18.7% |
Percentage of never married males 15 years old and over:
Percentage of never married females 15 years old and over:
| Morgan State University: | 36.6% |
| Baltimore: | 25.1% |
Percentage of never married females 15 years old and over:
| Morgan State University: | 28.6% |
| city: | 27.5% |
Percentage of people that speak English not well or not at all:
| Morgan State University: | 1.3% |
| Baltimore: | 2.3% |
Percentage of people born in this state:
Percentage of people born in another U.S. state:
Percentage of native residents but born outside the U.S.:
Percentage of foreign born residents:
| Here: | 60.0% |
| Baltimore: | 64.4% |
Percentage of people born in another U.S. state:
| Morgan State University: | 30.8% |
| Baltimore: | 25.0% |
Percentage of native residents but born outside the U.S.:
| Here: | 1.0% |
| city: | 0.9% |
Percentage of foreign born residents:
| Here: | 8.2% |
| Baltimore: | 9.7% |
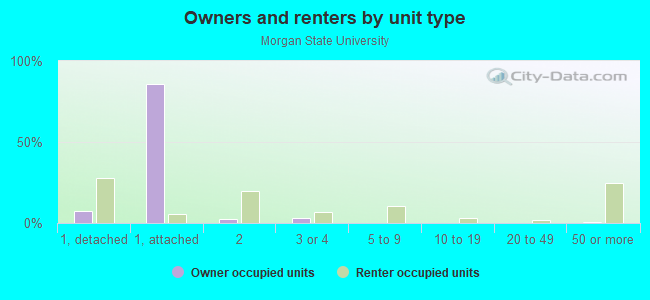
Owner-occupied
Renter-occupied

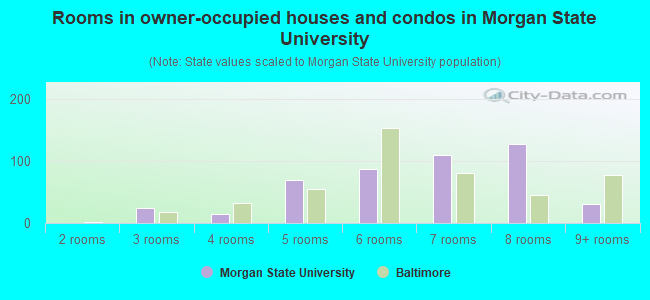
- Rooms in owner-occupied houses and condos in Morgan State University
- 01 room
- 02 rooms
- 253 rooms
- 144 rooms
- 695 rooms
- 876 rooms
- 1107 rooms
- 1288 rooms
- 319+ rooms
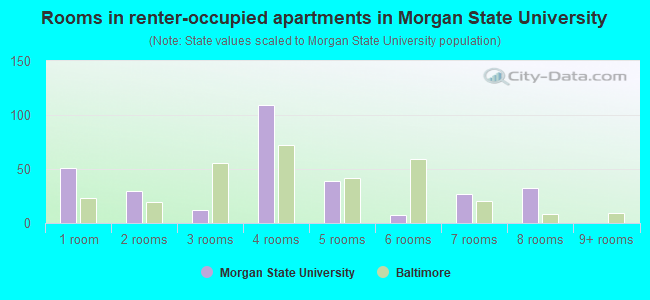
- Rooms in renter-occupied apartments in Morgan State University
- 511 room
- 302 rooms
- 123 rooms
- 1094 rooms
- 395 rooms
- 76 rooms
- 277 rooms
- 328 rooms
- 09+ rooms
Owner-occupied
Renter-occupied
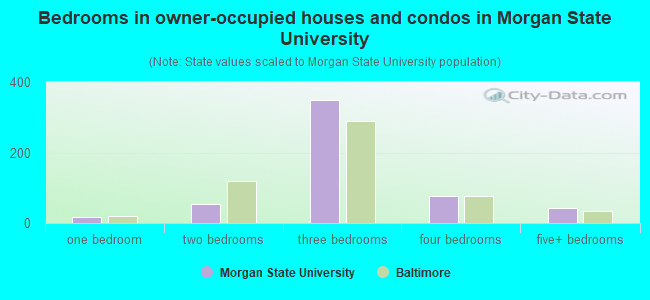
- Bedrooms in owner-occupied houses and condos in Morgan State University
- 0no bedroom
- 181 bedroom
- 542 bedrooms
- 3493 bedrooms
- 764 bedrooms
- 425+ bedrooms
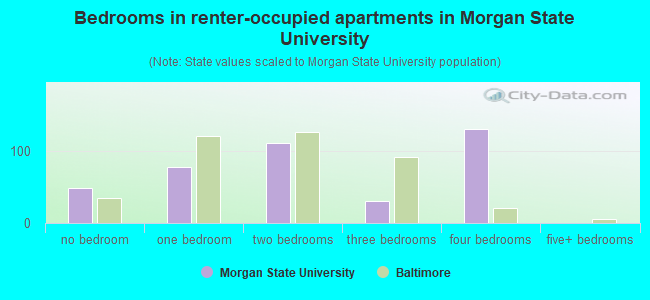
- Bedrooms in renter-occupied apartments in Morgan State University
- 48no bedroom
- 781 bedroom
- 1102 bedrooms
- 303 bedrooms
- 1304 bedrooms
- 05+ bedrooms
Average number of cars or other vehicles available in houses/condos:
Average number of cars or other vehicles available in apartments:
| This neighborhood: | 1.4 |
| Baltimore: | 1.5 |
Average number of cars or other vehicles available in apartments:
| Here: | 1.5 |
| city: | 0.8 |
Percentage of units with a mortgage:
| Morgan State University: | 68.0% |
| Baltimore: | 64.3% |
Average estimated value of townhouses or other attached units in 2022 (82.4% of all units):
| This neighborhood: | $188,901 |
| city: | $206,258 |
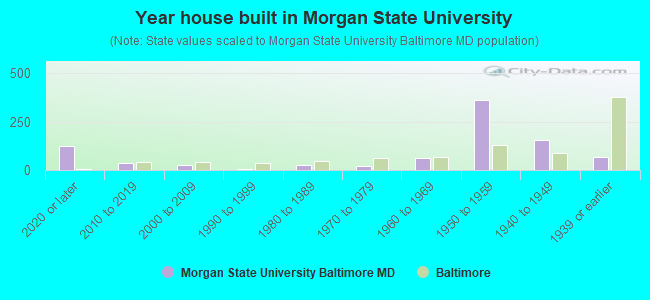
- Year house built in Morgan State University
- 1222020 or later
- 372010 to 2019
- 282000 to 2009
- 71990 to 1999
- 281980 to 1989
- 221970 to 1979
- 621960 to 1969
- 3631950 to 1959
- 1571940 to 1949
- 671939 or earlier
Travel time to work (commute)
![Travel time to work (commute)]()
- 20Less than 5 minutes
- 1025 to 9 minutes
- 4710 to 14 minutes
- 12515 to 19 minutes
- 14720 to 24 minutes
- 6725 to 29 minutes
- 14030 to 34 minutes
- 2335 to 39 minutes
- 6840 to 44 minutes
- 8645 to 59 minutes
- 6360 to 89 minutes
- 2490 or more minutes

Means of transportation to work
![Means of transportation to work]()
- 55.0%475Drove a car alone
- 11.6%100Carpooled
- 14.2%123Bus
- 3.2%28Subway or elevated rail
- 3.6%31Long-distance train or commuter rail
- 0.6%5Light rail, streetcar or trolley
- 1.3%11Taxi
- 1.7%15Bicycle
- 13.8%119Walked
- 0.6%5Other means
- 3.4%29Worked at home

Time leaving home to go to work
![Time leaving home to go to work]()
- 2912:00 a.m. to 4:59 a.m.
- 215:00 a.m. to 5:29 a.m.
- 265:30 a.m. to 5:59 a.m.
- 686:00 a.m. to 6:29 a.m.
- 546:30 a.m. to 6:59 a.m.
- 757:00 a.m. to 7:29 a.m.
- 857:30 a.m. to 7:59 a.m.
- 1048:00 a.m. to 8:29 a.m.
- 518:30 a.m. to 8:59 a.m.
- 859:00 a.m. to 9:59 a.m.
- 4610:00 a.m. to 10:59 a.m.
- 2111:00 a.m. to 11:59 a.m.
- 10312:00 p.m. to 3:59 p.m.
- 1284:00 p.m. to 11:59 p.m.

Occupations of males:
- Percentage of males in management occupations (except farmers):
Here: 2.4% city: 10.7%
- Percentage of males in business and financial operations occupations:
Here: 2.8% city: 5.9%
- Percentage of males in architecture and engineering occupations:
Here: 2.5% city: 2.9%
- Percentage of males in community and social services occupations:
Here: 1.0% city: 1.6%
- Percentage of males in education, training, and library occupations:
Here: 2.2% city: 5.4%
- Percentage of males in arts, design, entertainment, sports, and media occupations:
Here: 1.9% city: 2.8%
- Percentage of males in service occupations:
Here: 29.1% city: 14.7%
- Percentage of males in sales and office occupations:
Here: 15.7% city: 14.2%
- Percentage of males in construction, extraction, and maintenance occupations:
Here: 16.3% city: 5.6%
- Percentage of males in production occupations:
Here: 1.5% city: 4.2%
- Percentage of males in transportation occupations:
Here: 4.8% city: 6.8%
- Percentage of males in material moving occupations:
Here: 19.5% city: 7.0%
Occupations of females:
- Percentage of females in business and financial operations occupations:
Here: 5.4% city: 6.6%
- Percentage of females in community and social services occupations:
Here: 10.7% city: 3.6%
- Percentage of females in legal occupations:
Here: 4.7% city: 1.8%
- Percentage of females in education, training, and library occupations:
Here: 14.3% city: 10.7%
- Percentage of females in healthcare practitioners and technical occupations:
Here: 11.0% city: 9.8%
- Percentage of females in service occupations:
Here: 21.6% city: 20.4%
- Percentage of females in sales and office occupations:
Here: 27.0% city: 22.3%
- Percentage of females in transportation occupations:
Here: 1.3% city: 1.7%
- Percentage of females in material moving occupations:
Here: 1.8% city: 1.9%
Percentage of people 16-64 in Armed Forces:
| Morgan State University: | 0.0% |
| Baltimore: | 0.4% |
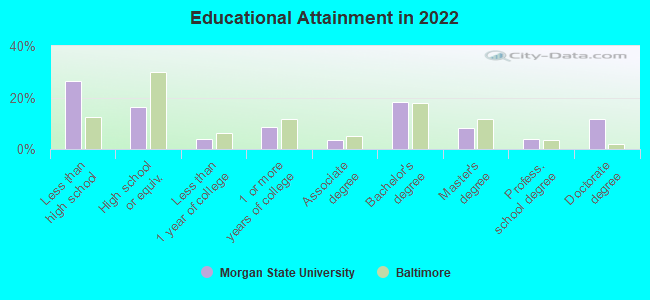
Education in this neighborhood (subdivision or community):
- Percentage of people 3 years and older in K-12 schools:
Morgan State University: 25.7% Baltimore: 14.7%
- Percentage of people 3 years and older in undergraduate colleges:
Morgan State University: 39.0% Baltimore: 6.0%
- Percentage of people 3 years and older in grad. or professional schools:
Morgan State University: 2.9% Baltimore: 2.8%
- Percentage of students K-12 enrolled in private schools:
Morgan State University: 90.1% Baltimore: 12.7%
Percentage of population below poverty level:
| Morgan State University: | 9.9% |
| Baltimore: | 18.5% |
Median year owner moved in (as recorded in 2022):
| Morgan State University: | 1998 |
| Baltimore: | 2009 |
Percentage of married-couple families with both working:
| Morgan State University: | 85.5% |
| Baltimore: | 79.2% |
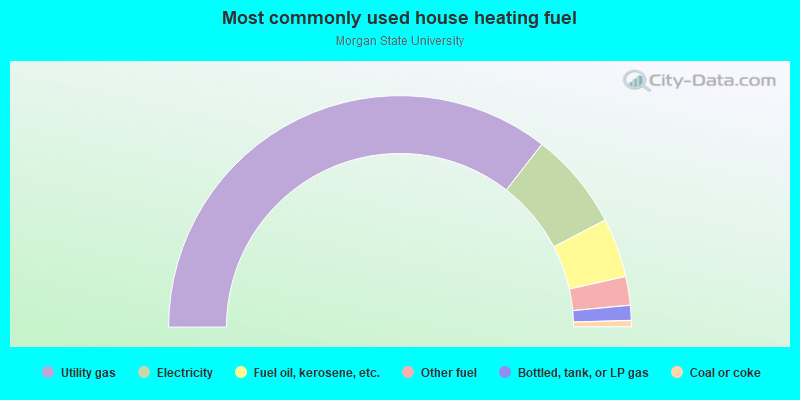
- 71.1%Utility gas
- 13.7%Electricity
- 8.3%Fuel oil, kerosene, etc.
- 4.0%Other fuel
- 2.1%Bottled, tank, or LP gas
- 0.9%Coal or coke
Highways in this neighborhood:
State Hwy 41 (Hillen Rd)
Length: 0.52 miles
Directions: N-S, SW-NE
Address range: 4311 to 4799
Directions: N-S, SW-NE
Address range: 4311 to 4799
Roads and streets:
Morgan State Campus Rd
Length: 0.80 miles
Directions: E-W, N-S, SE-NW, SW-NE
Directions: E-W, N-S, SE-NW, SW-NE
Perring Pkwy
Length: 0.60 miles
Direction: SW-NE
Address range: 4801 to 4999
Direction: SW-NE
Address range: 4801 to 4999
E Cold Spring Ln
Length: 0.34 miles
Direction: E-W
Address range: 1900 to 1993
Direction: E-W
Address range: 1900 to 1993
Echodale Ave
Length: 0.31 miles
Directions: E-W, SE-NW
Address range: 2000 to 2076
Directions: E-W, SE-NW
Address range: 2000 to 2076
Other features:
Chinquapin Run
Length: 0.27 miles
Directions: E-W, N-S, SE-NW
Directions: E-W, N-S, SE-NW