Morgan Park neighborhood in Baltimore, Maryland (MD), 21214 detailed profile
Settings
X

Business Search - 14 Million verified businesses
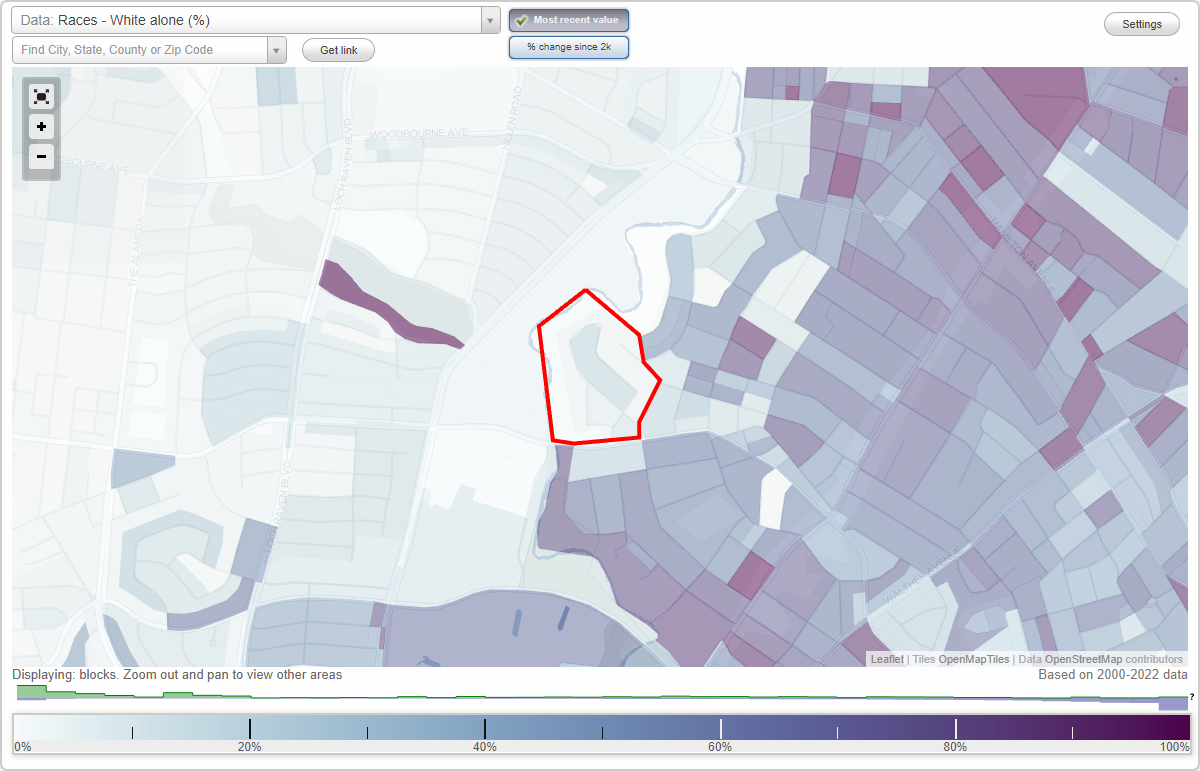
Area: 0.068 square miles
Population: 879
Population density:
| Morgan Park: | 12,850 people per square mile |
| Baltimore: | 7,053 people per square mile |

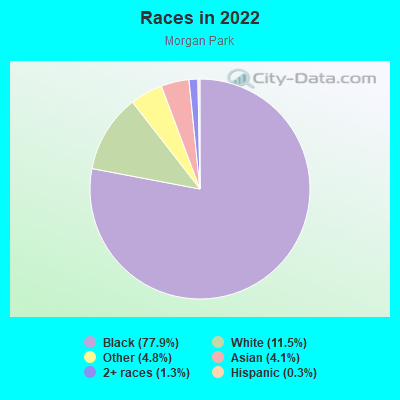
- 75177.9%Black
- 11111.5%White
- 464.8%Some other race
- 404.1%Asian
- 131.3%Two or more races
- 30.3%Hispanic or Latino
Median household income in 2022:
| Morgan Park: | $82,431 |
| Baltimore: | $55,198 |
Distribution of median household income
![Distribution of median household income]()
- 7Less than $10,000
- 24$10,000 to $19,999
- 3$20,000 to $29,999
- 12$30,000 to $39,999
- 47$40,000 to $49,999
- 36$50,000 to $59,999
- 14$60,000 to $74,999
- 9$75,000 to $99,999
- 17$100,000 to $124,999
- 47$125,000 to $149,999
- 72$150,000 to $199,999
- 3$200,000 or more

Distribution of owner-occupied house/condo value
![Distribution of owner-occupied house/condo value]()
- 27Less than $50,000
- 14$50,000 to $99,999
- 14$100,000 to $149,999
- 30$150,000 to $199,999
- 45$200,000 to $249,999
- 63$250,000 to $299,999
- 65$300,000 to $399,999
- 1$400,000 to $499,999
- 8$750,000 to $999,999
- 7$1,000,000 or more

Distribution of rent paid by renters
![Distribution of rent paid by renters]()
- 1$300 to $399
- 1$400 to $499
- 5$900 to $999
- 29$1,000 to $1,249
- 13$1,250 to $1,499
- 13$1,500 to $1,999
- 2$2,000 or more

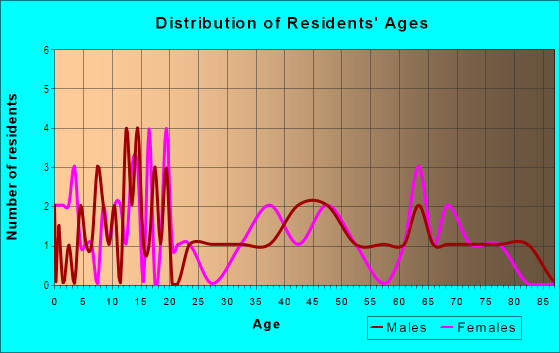
| Males: | 420 |
| Females: | 458 |
Males:
| This neighborhood: | 30.0 years |
| Whole city: | 35.0 years |
| This neighborhood: | 44.1 years |
| Whole city: | 38.2 years |
Average household size:
| Morgan Park: | 2.8 people |
| Baltimore: | 2.2 people |
Percentage of family households:
| Morgan Park: | 60.7% |
| Baltimore: | 34.2% |
| Here: | 69.3% |
| Baltimore: | 23.3% |
Percentage of married-couple families with children (among all households):
| Morgan Park: | 27.3% |
| Baltimore: | 22.4% |
Percentage of single-mother households (among all households):
| Morgan Park: | 0.6% |
| Baltimore: | 18.7% |
Percentage of never married males 15 years old and over:
Percentage of never married females 15 years old and over:
| Morgan Park: | 27.4% |
| Baltimore: | 25.1% |
Percentage of never married females 15 years old and over:
| Morgan Park: | 9.2% |
| city: | 27.5% |
Percentage of people that speak English not well or not at all:
| Morgan Park: | 0.4% |
| Baltimore: | 2.3% |
Percentage of people born in this state:
Percentage of people born in another U.S. state:
Percentage of native residents but born outside the U.S.:
Percentage of foreign born residents:
| Here: | 68.2% |
| Baltimore: | 64.4% |
Percentage of people born in another U.S. state:
| Morgan Park: | 23.0% |
| Baltimore: | 25.0% |
Percentage of native residents but born outside the U.S.:
| Here: | 0.5% |
| city: | 0.9% |
Percentage of foreign born residents:
| Here: | 8.8% |
| Baltimore: | 9.7% |
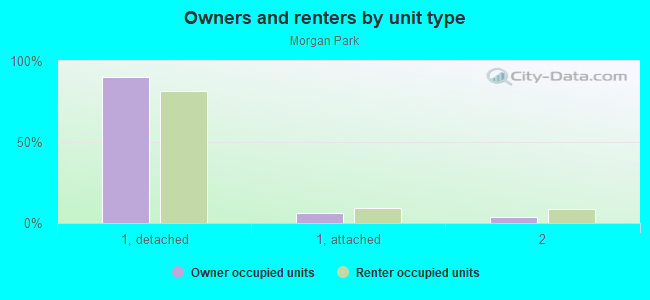
Owner-occupied
Renter-occupied

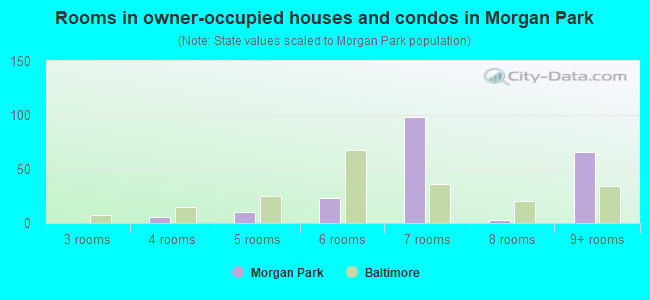
- Rooms in owner-occupied houses and condos in Morgan Park
- 01 room
- 02 rooms
- 03 rooms
- 64 rooms
- 105 rooms
- 236 rooms
- 987 rooms
- 38 rooms
- 669+ rooms
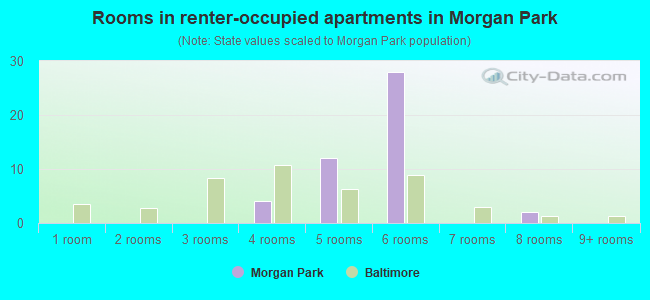
- Rooms in renter-occupied apartments in Morgan Park
- 01 room
- 02 rooms
- 03 rooms
- 44 rooms
- 125 rooms
- 286 rooms
- 07 rooms
- 28 rooms
- 09+ rooms
Owner-occupied
Renter-occupied
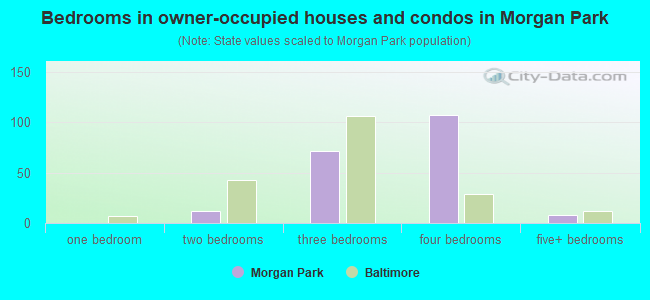
- Bedrooms in owner-occupied houses and condos in Morgan Park
- 0no bedroom
- 01 bedroom
- 122 bedrooms
- 713 bedrooms
- 1074 bedrooms
- 85+ bedrooms
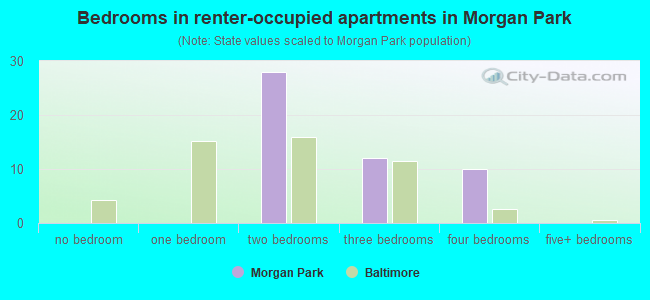
- Bedrooms in renter-occupied apartments in Morgan Park
- 0no bedroom
- 01 bedroom
- 282 bedrooms
- 123 bedrooms
- 104 bedrooms
- 05+ bedrooms
Average number of cars or other vehicles available in houses/condos:
Average number of cars or other vehicles available in apartments:
| This neighborhood: | 1.2 |
| Baltimore: | 1.5 |
Average number of cars or other vehicles available in apartments:
| Here: | 0.8 |
| city: | 0.8 |
Percentage of units with a mortgage:
| Morgan Park: | 66.7% |
| Baltimore: | 64.3% |
Housing prices:
- Average estimated value of detached houses in 2022 (94.2% of all units):
Morgan Park: $11,867 Baltimore: $350,815
- Average estimated value of townhouses or other attached units in 2022 (5.4% of all units):
This neighborhood: $1,809,214 city: $206,258
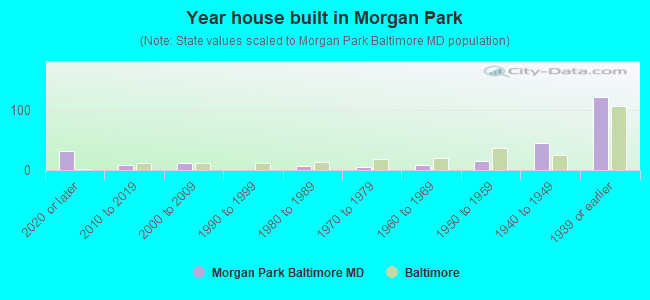
- Year house built in Morgan Park
- 322020 or later
- 92010 to 2019
- 122000 to 2009
- 01990 to 1999
- 61980 to 1989
- 51970 to 1979
- 81960 to 1969
- 151950 to 1959
- 451940 to 1949
- 1211939 or earlier
Travel time to work (commute)
![Travel time to work (commute)]()
- 5Less than 5 minutes
- 15 to 9 minutes
- 1510 to 14 minutes
- 1515 to 19 minutes
- 2420 to 24 minutes
- 2625 to 29 minutes
- 1130 to 34 minutes
- 335 to 39 minutes
- 1040 to 44 minutes
- 445 to 59 minutes
- 1160 to 89 minutes
- 390 or more minutes

Means of transportation to work
![Means of transportation to work]()
- 60.5%182Drove a car alone
- 17.3%52Carpooled
- 2.3%7Bus
- 0.3%1Subway or elevated rail
- 2.7%8Long-distance train or commuter rail
- 6.6%20Walked
- 0.3%1Other means
- 15.0%45Worked at home

Time leaving home to go to work
![Time leaving home to go to work]()
- 1112:00 a.m. to 4:59 a.m.
- 45:00 a.m. to 5:29 a.m.
- 25:30 a.m. to 5:59 a.m.
- 66:00 a.m. to 6:29 a.m.
- 36:30 a.m. to 6:59 a.m.
- 247:00 a.m. to 7:29 a.m.
- 87:30 a.m. to 7:59 a.m.
- 168:00 a.m. to 8:29 a.m.
- 228:30 a.m. to 8:59 a.m.
- 39:00 a.m. to 9:59 a.m.
- 1710:00 a.m. to 10:59 a.m.
- 311:00 a.m. to 11:59 a.m.
- 1312:00 p.m. to 3:59 p.m.
- 44:00 p.m. to 11:59 p.m.

Occupations of males:
- Percentage of males in business and financial operations occupations:
Here: 7.8% city: 5.9%
- Percentage of males in computer and mathematical occupations:
Here: 19.8% city: 6.1%
- Percentage of males in community and social services occupations:
Here: 8.2% city: 1.6%
- Percentage of males in arts, design, entertainment, sports, and media occupations:
Here: 6.3% city: 2.8%
- Percentage of males in service occupations:
Here: 29.9% city: 14.7%
- Percentage of males in construction, extraction, and maintenance occupations:
Here: 2.3% city: 5.6%
- Percentage of males in transportation occupations:
Here: 25.0% city: 6.8%
Occupations of females:
- Percentage of females in management occupations (except farmers):
Here: 9.3% city: 10.1%
- Percentage of females in computer and mathematical occupations:
Here: 10.0% city: 2.4%
- Percentage of females in education, training, and library occupations:
Here: 3.0% city: 10.7%
- Percentage of females in service occupations:
Here: 41.1% city: 20.4%
- Percentage of females in sales and office occupations:
Here: 34.8% city: 22.3%
- Percentage of females in material moving occupations:
Here: 1.1% city: 1.9%
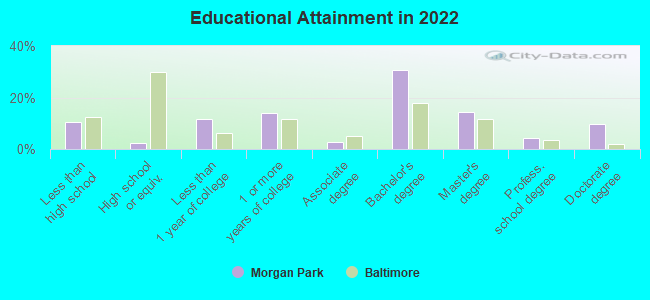
Education in this neighborhood (subdivision or community):
- Percentage of people 3 years and older in K-12 schools:
Morgan Park: 32.7% Baltimore: 14.7%
- Percentage of people 3 years and older in undergraduate colleges:
Morgan Park: 7.1% Baltimore: 6.0%
- Percentage of people 3 years and older in grad. or professional schools:
Morgan Park: 2.5% Baltimore: 2.8%
- Percentage of students K-12 enrolled in private schools:
Morgan Park: 92.7% Baltimore: 12.7%
Percentage of population below poverty level:
| Morgan Park: | 10.3% |
| Baltimore: | 18.5% |
Median year owner moved in (as recorded in 2022):
| Morgan Park: | 1999 |
| Baltimore: | 2009 |
Percentage of married-couple families with both working:
| Morgan Park: | 40.8% |
| Baltimore: | 79.2% |
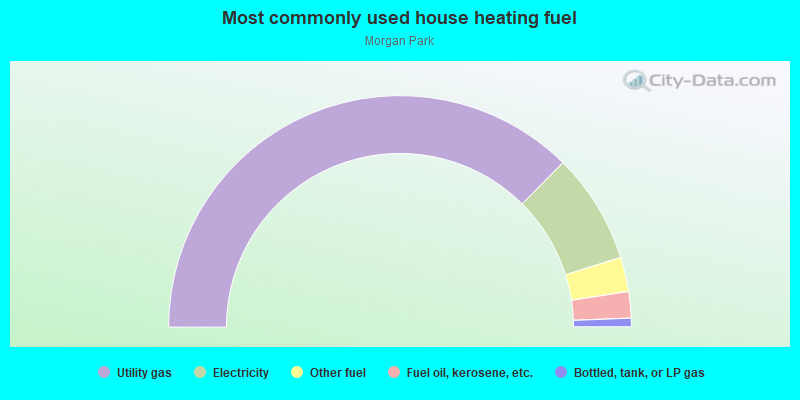
- 74.8%Utility gas
- 15.4%Electricity
- 4.8%Other fuel
- 3.7%Fuel oil, kerosene, etc.
- 1.2%Bottled, tank, or LP gas
Roads and streets:
Montebello Ter
Length: 0.38 miles
Directions: E-W, N-S, SE-NW, SW-NE
Address range: 2300 to 2506
Directions: E-W, N-S, SE-NW, SW-NE
Address range: 2300 to 2506
Ivy Ave
Length: 0.23 miles
Directions: E-W, N-S, SE-NW
Address range: 2300 to 2399
Directions: E-W, N-S, SE-NW
Address range: 2300 to 2399
Southern Ave
Length: 0.15 miles
Direction: SE-NW
Address range: 2100 to 2299
Direction: SE-NW
Address range: 2100 to 2299
Overland Ave
Length: 0.11 miles
Directions: N-S, SE-NW, SW-NE
Address range: 2400 to 2503
Directions: N-S, SE-NW, SW-NE
Address range: 2400 to 2503
College Ave
Length: 0.11 miles
Directions: E-W, N-S, SE-NW, SW-NE
Address range: 2400 to 2499
Directions: E-W, N-S, SE-NW, SW-NE
Address range: 2400 to 2499
Prospect Ave
Length: 0.07 miles
Direction: E-W
Direction: E-W
Herring Run Dr
Length: 0.06 miles
Direction: N-S
Direction: N-S