Monterey Corridor neighborhood in San Jose, California (CA), 95110, 95112, 95125 detailed profile
Settings
X

Business Search - 14 Million verified businesses
Area: 0.263 square miles
Population: 1,549
Population density:
| Monterey Corridor: | 5,897 people per square mile |
| San Jose: | 5,554 people per square mile |

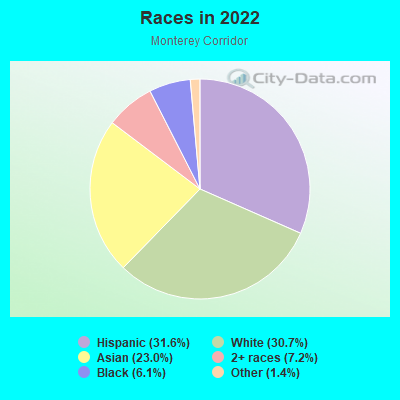
- 48831.6%Hispanic or Latino
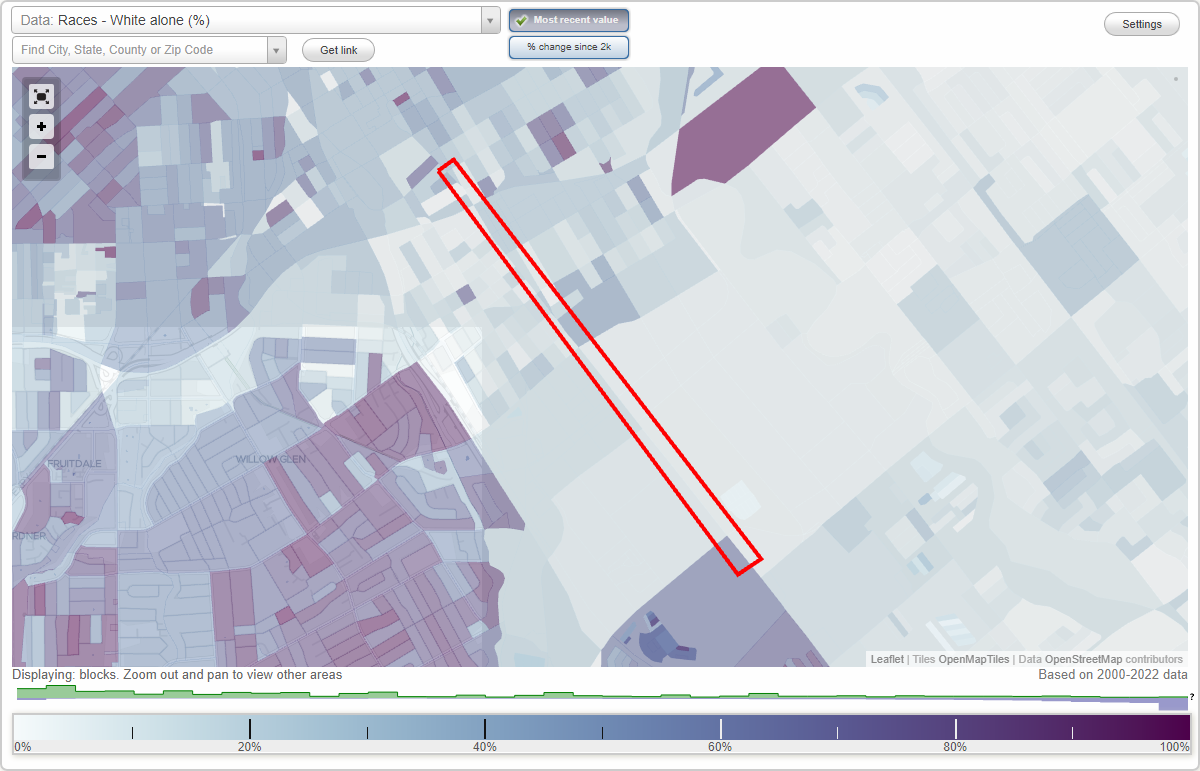
- 47430.7%White
- 35623.0%Asian
- 1117.2%Two or more races
- 956.1%Black
- 221.4%Some other race
Median household income in 2022:
| Monterey Corridor: | $342,672 |
| San Jose: | $133,835 |
Distribution of median household income
![Distribution of median household income]()
- 64Less than $10,000
- 185$10,000 to $19,999
- 25$20,000 to $29,999
- 50$30,000 to $39,999
- 30$40,000 to $49,999
- 25$50,000 to $59,999
- 51$60,000 to $74,999
- 34$75,000 to $99,999
- 30$100,000 to $124,999
- 135$125,000 to $149,999
- 176$150,000 to $199,999
- 179$200,000 or more

Distribution of owner-occupied house/condo value
![Distribution of owner-occupied house/condo value]()
- 2$50,000 to $99,999
- 5$250,000 to $299,999
- 180$500,000 to $749,999
- 43$750,000 to $999,999
- 76$1,000,000 or more

Distribution of rent paid by renters
![Distribution of rent paid by renters]()
- 31$100 to $199
- 99$200 to $299
- 31$300 to $399
- 5$400 to $499
- 3$500 to $599
- 5$800 to $899
- 20$900 to $999
- 8$1,000 to $1,249
- 17$1,250 to $1,499
- 33$1,500 to $1,999
- 657$2,000 or more

Median rent in 2022:
| Monterey Corridor: | $6,828 |
| San Jose: | $2,001 |
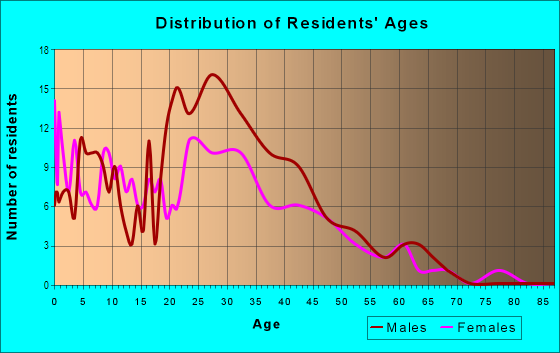
| Males: | 810 |
| Females: | 739 |
Males:
| This neighborhood: | 80.6 years |
| Whole city: | 37.6 years |
| This neighborhood: | 62.5 years |
| Whole city: | 39.1 years |
Average household size:
| Monterey Corridor: | 4.2 people |
| San Jose: | 2.9 people |
Percentage of family households:
| Monterey Corridor: | 29.4% |
| San Jose: | 49.9% |
| Here: | 25.2% |
| San Jose: | 53.0% |
Percentage of married-couple families with children (among all households):
| Monterey Corridor: | 37.7% |
| San Jose: | 25.8% |
Percentage of single-mother households (among all households):
| Monterey Corridor: | 15.4% |
| San Jose: | 5.2% |
Percentage of never married males 15 years old and over:
Percentage of never married females 15 years old and over:
| Monterey Corridor: | 26.8% |
| San Jose: | 20.9% |
Percentage of never married females 15 years old and over:
| Monterey Corridor: | 23.0% |
| city: | 16.7% |
Percentage of people that speak English not well or not at all:
| Monterey Corridor: | 9.8% |
| San Jose: | 11.4% |
Percentage of people born in this state:
Percentage of people born in another U.S. state:
Percentage of native residents but born outside the U.S.:
Percentage of foreign born residents:
| Here: | 52.8% |
| San Jose: | 46.1% |
Percentage of people born in another U.S. state:
| Monterey Corridor: | 9.6% |
| San Jose: | 10.4% |
Percentage of native residents but born outside the U.S.:
| Here: | 2.2% |
| city: | 1.7% |
Percentage of foreign born residents:
| Here: | 35.4% |
| San Jose: | 41.8% |
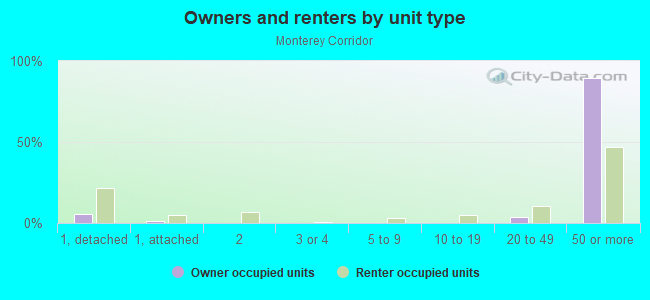
Owner-occupied
Renter-occupied

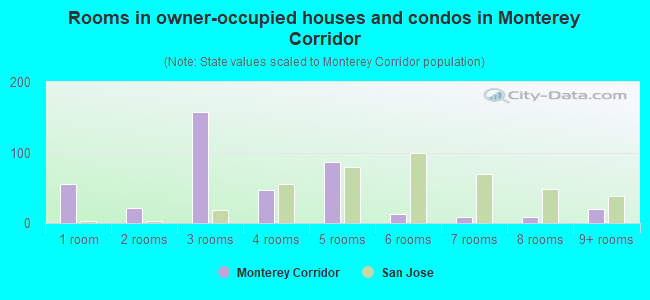
- Rooms in owner-occupied houses and condos in Monterey Corridor
- 561 room
- 212 rooms
- 1573 rooms
- 474 rooms
- 865 rooms
- 136 rooms
- 97 rooms
- 88 rooms
- 209+ rooms
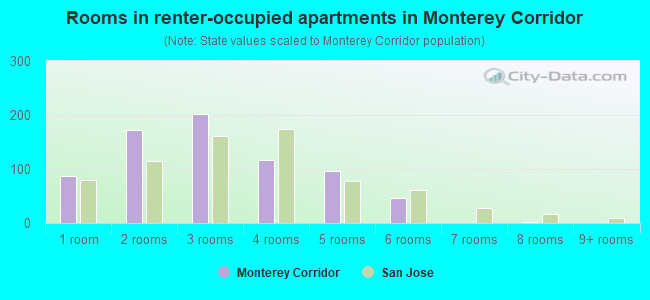
- Rooms in renter-occupied apartments in Monterey Corridor
- 871 room
- 1732 rooms
- 2023 rooms
- 1164 rooms
- 975 rooms
- 466 rooms
- 07 rooms
- 18 rooms
- 09+ rooms
Owner-occupied
Renter-occupied
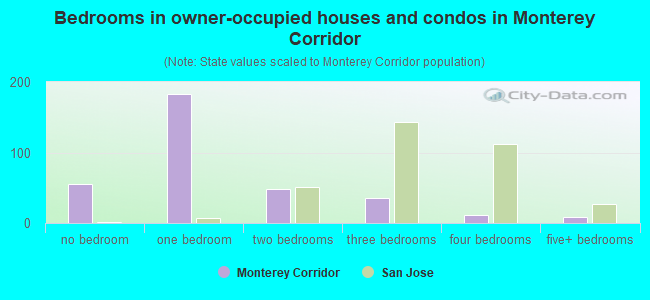
- Bedrooms in owner-occupied houses and condos in Monterey Corridor
- 56no bedroom
- 1831 bedroom
- 482 bedrooms
- 353 bedrooms
- 124 bedrooms
- 95+ bedrooms
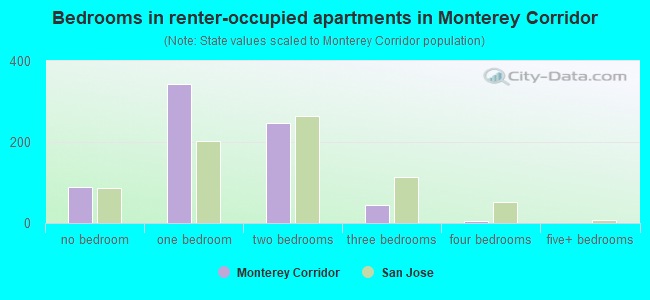
- Bedrooms in renter-occupied apartments in Monterey Corridor
- 88no bedroom
- 3421 bedroom
- 2482 bedrooms
- 453 bedrooms
- 44 bedrooms
- 05+ bedrooms
Average number of cars or other vehicles available in houses/condos:
Average number of cars or other vehicles available in apartments:
| This neighborhood: | 1.6 |
| San Jose: | 2.3 |
Average number of cars or other vehicles available in apartments:
| Here: | 1.2 |
| city: | 1.6 |
Percentage of units with a mortgage:
| Monterey Corridor: | 67.3% |
| San Jose: | 66.9% |
Average estimated value of detached houses in 2022 (21.9% of all units):
| Monterey Corridor: | $1,072,003 |
| San Jose: | $1,532,815 |
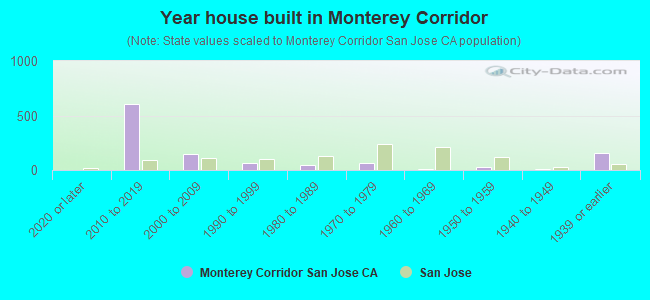
- Year house built in Monterey Corridor
- 02020 or later
- 6072010 to 2019
- 1442000 to 2009
- 601990 to 1999
- 421980 to 1989
- 601970 to 1979
- 121960 to 1969
- 251950 to 1959
- 61940 to 1949
- 1601939 or earlier
City-data.com crime index for city in 2020 (higher means more crime):
| City: | 268.4 |
| U.S. average: | 219.5 |
Travel time to work (commute)
![Travel time to work (commute)]()
- 8Less than 5 minutes
- 285 to 9 minutes
- 4510 to 14 minutes
- 7515 to 19 minutes
- 9920 to 24 minutes
- 725 to 29 minutes
- 8430 to 34 minutes
- 935 to 39 minutes
- 340 to 44 minutes
- 9745 to 59 minutes
- 2260 to 89 minutes
- 790 or more minutes

Means of transportation to work
![Means of transportation to work]()
- 51.5%511Drove a car alone
- 3.9%39Carpooled
- 2.7%27Bus
- 4.1%41Subway or elevated rail
- 3.2%32Long-distance train or commuter rail
- 8.3%82Light rail, streetcar or trolley
- 1.0%10Taxi
- 0.5%5Motorcycle
- 1.8%18Bicycle
- 16.5%164Walked
- 18.5%184Worked at home

Time leaving home to go to work
![Time leaving home to go to work]()
- 1812:00 a.m. to 4:59 a.m.
- 155:00 a.m. to 5:29 a.m.
- 195:30 a.m. to 5:59 a.m.
- 836:00 a.m. to 6:29 a.m.
- 256:30 a.m. to 6:59 a.m.
- 707:00 a.m. to 7:29 a.m.
- 237:30 a.m. to 7:59 a.m.
- 478:00 a.m. to 8:29 a.m.
- 238:30 a.m. to 8:59 a.m.
- 319:00 a.m. to 9:59 a.m.
- 1210:00 a.m. to 10:59 a.m.
- 1411:00 a.m. to 11:59 a.m.
- 2212:00 p.m. to 3:59 p.m.
- 144:00 p.m. to 11:59 p.m.

Occupations of males:
- Percentage of males in management occupations (except farmers):
Here: 9.4% city: 13.0%
- Percentage of males in business and financial operations occupations:
Here: 8.7% city: 4.6%
- Percentage of males in computer and mathematical occupations:
Here: 21.6% city: 13.6%
- Percentage of males in architecture and engineering occupations:
Here: 13.7% city: 10.2%
- Percentage of males in life, physical, and social science occupations:
Here: 3.5% city: 1.1%
- Percentage of males in legal occupations:
Here: 7.2% city: 0.8%
- Percentage of males in education, training, and library occupations:
Here: 3.4% city: 2.8%
- Percentage of males in healthcare practitioners and technical occupations:
Here: 1.2% city: 2.0%
- Percentage of males in service occupations:
Here: 4.9% city: 12.7%
- Percentage of males in sales and office occupations:
Here: 11.6% city: 12.8%
- Percentage of males in farming, fishing, and forestry occupations:
Here: 1.3% city: 0.4%
- Percentage of males in construction, extraction, and maintenance occupations:
Here: 3.9% city: 7.8%
- Percentage of males in production occupations:
Here: 3.3% city: 5.5%
- Percentage of males in transportation occupations:
Here: 3.1% city: 3.6%
- Percentage of males in material moving occupations:
Here: 4.2% city: 3.1%
Occupations of females:
- Percentage of females in management occupations (except farmers):
Here: 20.2% city: 11.0%
- Percentage of females in business and financial operations occupations:
Here: 16.8% city: 8.6%
- Percentage of females in computer and mathematical occupations:
Here: 6.4% city: 5.4%
- Percentage of females in architecture and engineering occupations:
Here: 1.4% city: 2.8%
- Percentage of females in community and social services occupations:
Here: 1.4% city: 1.8%
- Percentage of females in education, training, and library occupations:
Here: 15.7% city: 8.1%
- Percentage of females in arts, design, entertainment, sports, and media occupations:
Here: 8.4% city: 2.0%
- Percentage of females in healthcare practitioners and technical occupations:
Here: 18.2% city: 6.8%
- Percentage of females in service occupations:
Here: 9.9% city: 21.7%
- Percentage of females in sales and office occupations:
Here: 3.0% city: 22.0%
- Percentage of females in construction, extraction, and maintenance occupations:
Here: 2.1% city: 0.2%
- Percentage of females in material moving occupations:
Here: 1.8% city: 1.5%
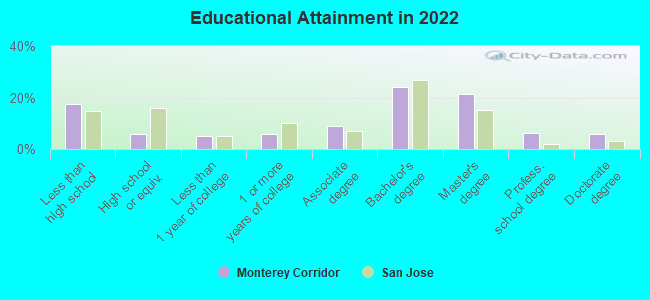
Education in this neighborhood (subdivision or community):
- Percentage of people 3 years and older in K-12 schools:
Monterey Corridor: 12.0% San Jose: 16.1%
- Percentage of people 3 years and older in undergraduate colleges:
Monterey Corridor: 9.7% San Jose: 6.5%
- Percentage of people 3 years and older in grad. or professional schools:
Monterey Corridor: 4.8% San Jose: 2.0%
- Percentage of students K-12 enrolled in private schools:
Monterey Corridor: 36.3% San Jose: 14.9%
Percentage of population below poverty level:
| Monterey Corridor: | 15.0% |
| San Jose: | 9.0% |
Median year owner moved in (as recorded in 2022):
Median year renter moved in (as recorded in 2022):
| Monterey Corridor: | 4641 |
| San Jose: | 2008 |
Median year renter moved in (as recorded in 2022):
| Monterey Corridor: | 4656 |
| San Jose: | 2020 |
Percentage of married-couple families with both working:
| Monterey Corridor: | 109.1% |
| San Jose: | 72.5% |
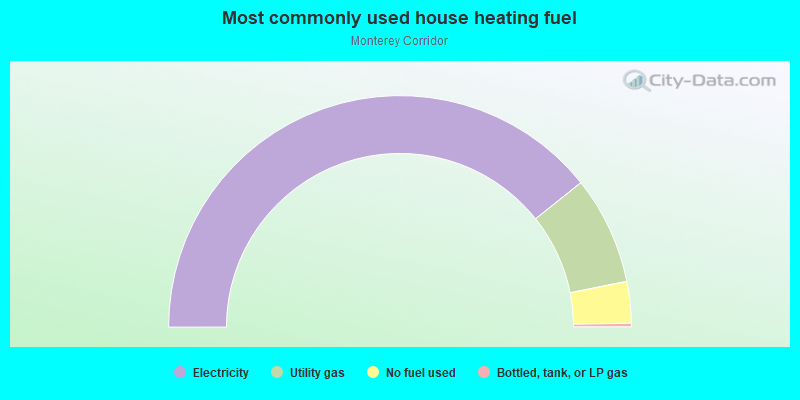
- 78.5%Electricity
- 15.1%Utility gas
- 5.8%No fuel used
- 0.5%Bottled, tank, or LP gas
Limited-access highways (interstate or state) in this neighborhood:
I- 280 (Sinclair Fwy)
Length: 0.04 miles
Direction: SW-NE
Direction: SW-NE
Highways in this neighborhood:
Monterey Hwy (State Hwy 82)
Length: 1.37 miles
Direction: SE-NW
Address range: 1400 to 2189
Direction: SE-NW
Address range: 1400 to 2189
S 1st St (State Hwy 82)
Length: 1.18 miles
Directions: N-S, SE-NW
Address range: 500 to 1399
Directions: N-S, SE-NW
Address range: 500 to 1399
State Hwy 82 (S Market St)
Length: 0.18 miles
Direction: SE-NW
Address range: 500 to 599
Direction: SE-NW
Address range: 500 to 599
Roads and streets:
S 2nd St
Length: 0.53 miles
Direction: SE-NW
Address range: 800 to 1299
Direction: SE-NW
Address range: 800 to 1299
E Reed St
Length: 0.10 miles
Directions: SE-NW, SW-NE
Address range: 1 to 24
Directions: SE-NW, SW-NE
Address range: 1 to 24
E Virginia St
Length: 0.08 miles
Direction: SW-NE
Address range: 1 to 74
Direction: SW-NE
Address range: 1 to 74
Martha St
Length: 0.07 miles
Direction: SW-NE
Address range: 1 to 49
Direction: SW-NE
Address range: 1 to 49
Pleasant Grove Ct
Length: 0.05 miles
Direction: SW-NE
Address range: 1 to 99
Direction: SW-NE
Address range: 1 to 99
Costa Ave
Length: 0.05 miles
Direction: SW-NE
Address range: 1 to 199
Direction: SW-NE
Address range: 1 to 199
Margaret St
Length: 0.04 miles
Direction: SW-NE
Address range: 1 to 25
Direction: SW-NE
Address range: 1 to 25
W William St
Length: 0.04 miles
Directions: E-W, SW-NE
Directions: E-W, SW-NE
Keyes St
Length: 0.03 miles
Direction: SW-NE
Address range: 1 to 49
Direction: SW-NE
Address range: 1 to 49
Railroad features:
Union Pacific RR
Length: 0.07 miles
Direction: SE-NW
Direction: SE-NW