Montego neighborhood in San Jose, California (CA), 95120 detailed profile
Settings
X

Business Search - 14 Million verified businesses
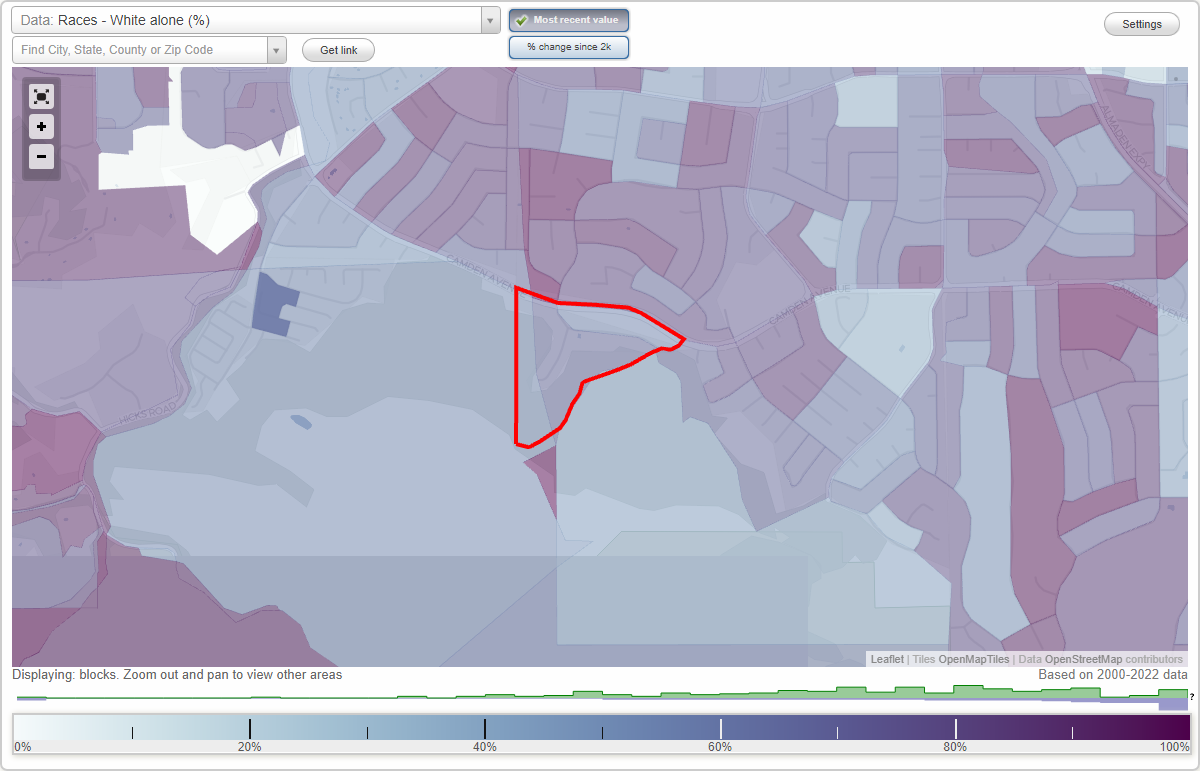
Area: 0.075 square miles
Population: 431
Population density:
| Montego: | 5,731 people per square mile |
| San Jose: | 5,554 people per square mile |

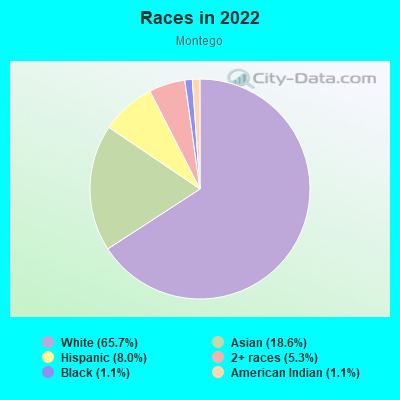
- 28665.7%White
- 8118.6%Asian
- 358.0%Hispanic or Latino
- 235.3%Two or more races
- 51.1%Black
- 51.1%American Indian
Median household income in 2022:
| Montego: | $227,106 |
| San Jose: | $133,835 |
Distribution of median household income
![Distribution of median household income]()
- 1Less than $10,000
- 1$10,000 to $19,999
- 8$20,000 to $29,999
- 2$30,000 to $39,999
- 8$40,000 to $49,999
- 3$50,000 to $59,999
- 3$60,000 to $74,999
- 21$75,000 to $99,999
- 12$100,000 to $124,999
- 4$125,000 to $149,999
- 17$150,000 to $199,999
- 87$200,000 or more

Distribution of owner-occupied house/condo value
![Distribution of owner-occupied house/condo value]()
- 1Less than $50,000
- 4$150,000 to $199,999
- 2$200,000 to $249,999
- 4$750,000 to $999,999
- 139$1,000,000 or more

Distribution of rent paid by renters
![Distribution of rent paid by renters]()
- 6$2,000 or more

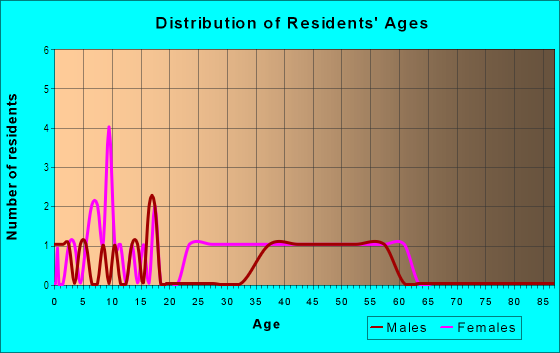
| Males: | 235 |
| Females: | 195 |
Males:
| This neighborhood: | 47.7 years |
| Whole city: | 37.6 years |
| This neighborhood: | 45.5 years |
| Whole city: | 39.1 years |
Average household size:
| Montego: | 3.1 people |
| San Jose: | 2.9 people |
Percentage of family households:
| Montego: | 52.1% |
| San Jose: | 49.9% |
| Here: | 70.6% |
| San Jose: | 53.0% |
Percentage of married-couple families with children (among all households):
| Montego: | 32.5% |
| San Jose: | 25.8% |
Percentage of single-mother households (among all households):
| Montego: | 1.9% |
| San Jose: | 5.2% |
Percentage of never married males 15 years old and over:
Percentage of never married females 15 years old and over:
| Montego: | 14.5% |
| San Jose: | 20.9% |
Percentage of never married females 15 years old and over:
| Montego: | 10.5% |
| city: | 16.7% |
Percentage of people that speak English not well or not at all:
| Montego: | 0.0% |
| San Jose: | 11.4% |
Percentage of people born in this state:
Percentage of people born in another U.S. state:
Percentage of native residents but born outside the U.S.:
Percentage of foreign born residents:
| Here: | 52.1% |
| San Jose: | 46.1% |
Percentage of people born in another U.S. state:
| Montego: | 22.1% |
| San Jose: | 10.4% |
Percentage of native residents but born outside the U.S.:
| Here: | 0.5% |
| city: | 1.7% |
Percentage of foreign born residents:
| Here: | 25.2% |
| San Jose: | 41.8% |
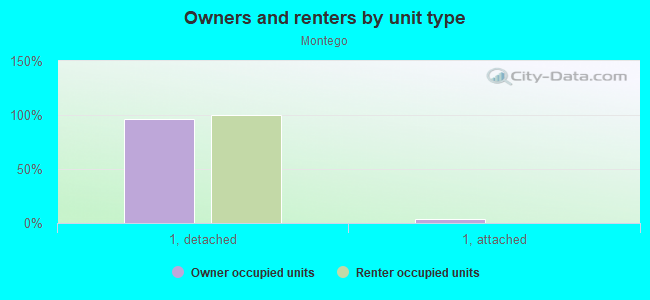
Owner-occupied
Renter-occupied

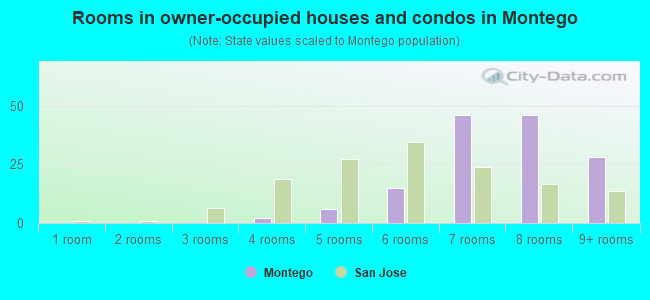
- Rooms in owner-occupied houses and condos in Montego
- 01 room
- 02 rooms
- 03 rooms
- 24 rooms
- 65 rooms
- 156 rooms
- 467 rooms
- 468 rooms
- 289+ rooms
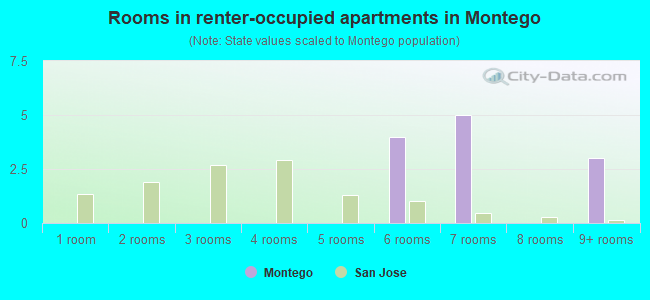
- Rooms in renter-occupied apartments in Montego
- 01 room
- 02 rooms
- 03 rooms
- 04 rooms
- 05 rooms
- 46 rooms
- 57 rooms
- 08 rooms
- 39+ rooms
Owner-occupied
Renter-occupied
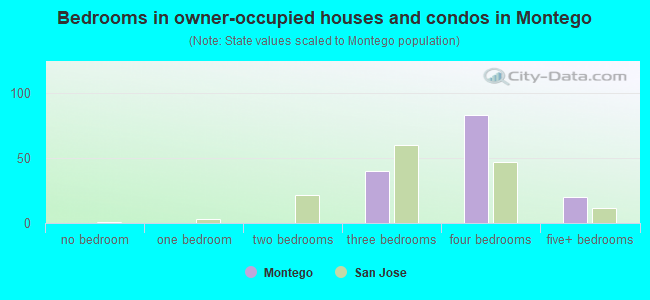
- Bedrooms in owner-occupied houses and condos in Montego
- 0no bedroom
- 01 bedroom
- 02 bedrooms
- 403 bedrooms
- 834 bedrooms
- 205+ bedrooms
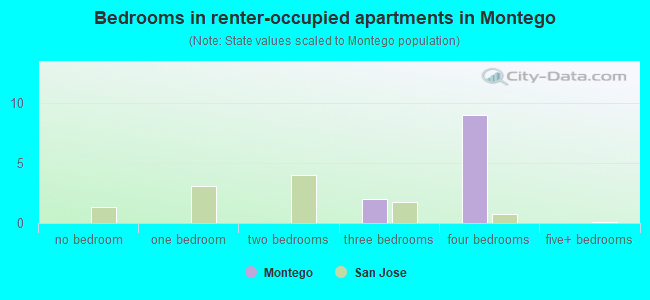
- Bedrooms in renter-occupied apartments in Montego
- 0no bedroom
- 01 bedroom
- 02 bedrooms
- 23 bedrooms
- 94 bedrooms
- 05+ bedrooms
Average number of cars or other vehicles available in houses/condos:
Average number of cars or other vehicles available in apartments:
| This neighborhood: | 2.3 |
| San Jose: | 2.3 |
Average number of cars or other vehicles available in apartments:
| Here: | |
| city: |
Percentage of units with a mortgage:
| Montego: | 78.6% |
| San Jose: | 66.9% |
Average estimated value of detached houses in 2022 (97.9% of all units):
| Montego: | $1,746,123 |
| San Jose: | $1,532,815 |
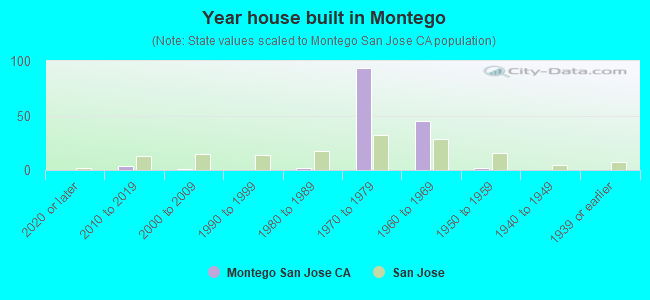
- Year house built in Montego
- 02020 or later
- 42010 to 2019
- 12000 to 2009
- 01990 to 1999
- 21980 to 1989
- 941970 to 1979
- 451960 to 1969
- 21950 to 1959
- 01940 to 1949
- 01939 or earlier
City-data.com crime index for city in 2020 (higher means more crime):
| City: | 268.4 |
| U.S. average: | 219.5 |
Travel time to work (commute)
![Travel time to work (commute)]()
- 85 to 9 minutes
- 1710 to 14 minutes
- 1915 to 19 minutes
- 3220 to 24 minutes
- 1625 to 29 minutes
- 3330 to 34 minutes
- 935 to 39 minutes
- 940 to 44 minutes
- 1245 to 59 minutes
- 1460 to 89 minutes
- 690 or more minutes

Means of transportation to work
![Means of transportation to work]()
- 53.6%117Drove a car alone
- 6.0%13Carpooled
- 0.5%1Bus
- 0.5%1Long-distance train or commuter rail
- 0.9%2Walked
- 0.9%2Other means
- 37.5%82Worked at home

Time leaving home to go to work
![Time leaving home to go to work]()
- 112:00 a.m. to 4:59 a.m.
- 15:00 a.m. to 5:29 a.m.
- 95:30 a.m. to 5:59 a.m.
- 56:00 a.m. to 6:29 a.m.
- 176:30 a.m. to 6:59 a.m.
- 327:00 a.m. to 7:29 a.m.
- 237:30 a.m. to 7:59 a.m.
- 148:00 a.m. to 8:29 a.m.
- 148:30 a.m. to 8:59 a.m.
- 389:00 a.m. to 9:59 a.m.
- 710:00 a.m. to 10:59 a.m.
- 311:00 a.m. to 11:59 a.m.
- 1612:00 p.m. to 3:59 p.m.
- 54:00 p.m. to 11:59 p.m.

Occupations of males:
- Percentage of males in management occupations (except farmers):
Here: 13.9% city: 13.0%
- Percentage of males in business and financial operations occupations:
Here: 3.0% city: 4.6%
- Percentage of males in computer and mathematical occupations:
Here: 31.9% city: 13.6%
- Percentage of males in architecture and engineering occupations:
Here: 15.0% city: 10.2%
- Percentage of males in legal occupations:
Here: 2.5% city: 0.8%
- Percentage of males in education, training, and library occupations:
Here: 1.1% city: 2.8%
- Percentage of males in arts, design, entertainment, sports, and media occupations:
Here: 1.2% city: 1.8%
- Percentage of males in healthcare practitioners and technical occupations:
Here: 1.4% city: 2.0%
- Percentage of males in service occupations:
Here: 2.4% city: 12.7%
- Percentage of males in sales and office occupations:
Here: 28.5% city: 12.8%
Occupations of females:
- Percentage of females in management occupations (except farmers):
Here: 3.6% city: 11.0%
- Percentage of females in business and financial operations occupations:
Here: 10.8% city: 8.6%
- Percentage of females in computer and mathematical occupations:
Here: 13.8% city: 5.4%
- Percentage of females in architecture and engineering occupations:
Here: 3.8% city: 2.8%
- Percentage of females in community and social services occupations:
Here: 1.2% city: 1.8%
- Percentage of females in legal occupations:
Here: 3.8% city: 1.3%
- Percentage of females in education, training, and library occupations:
Here: 13.4% city: 8.1%
- Percentage of females in arts, design, entertainment, sports, and media occupations:
Here: 14.5% city: 2.0%
- Percentage of females in healthcare practitioners and technical occupations:
Here: 12.1% city: 6.8%
- Percentage of females in service occupations:
Here: 8.2% city: 21.7%
- Percentage of females in sales and office occupations:
Here: 14.2% city: 22.0%
- Percentage of females in production occupations:
Here: 1.4% city: 4.0%
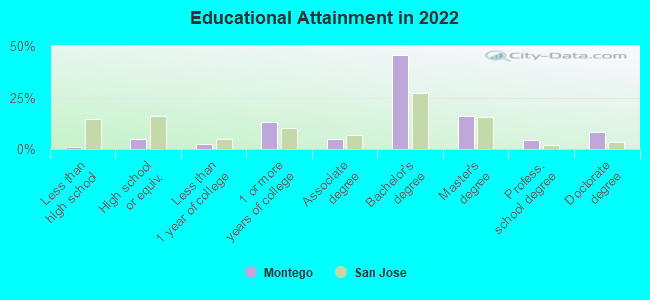
Education in this neighborhood (subdivision or community):
- Percentage of people 3 years and older in K-12 schools:
Montego: 20.1% San Jose: 16.1%
- Percentage of people 3 years and older in undergraduate colleges:
Montego: 4.7% San Jose: 6.5%
- Percentage of people 3 years and older in grad. or professional schools:
Montego: 4.0% San Jose: 2.0%
- Percentage of students K-12 enrolled in private schools:
Montego: 31.8% San Jose: 14.9%
Percentage of population below poverty level:
| Montego: | 0.8% |
| San Jose: | 9.0% |
Median year owner moved in (as recorded in 2022):
| Montego: | 2005 |
| San Jose: | 2008 |
Percentage of married-couple families with both working:
| Montego: | 77.5% |
| San Jose: | 72.5% |
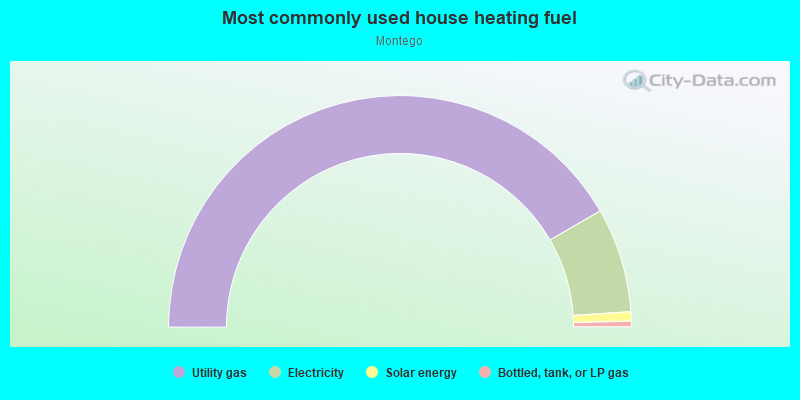
- 83.3%Utility gas
- 14.6%Electricity
- 1.3%Solar energy
- 0.8%Bottled, tank, or LP gas
Roads and streets:
Camden Ave
Length: 0.46 miles
Directions: E-W, SE-NW
Address range: 6168 to 6199
Directions: E-W, SE-NW
Address range: 6168 to 6199
Montego Ct
Length: 0.16 miles
Directions: E-W, N-S, SW-NE
Address range: 6400 to 6499
Directions: E-W, N-S, SW-NE
Address range: 6400 to 6499
Montego Dr
Length: 0.07 miles
Directions: N-S, SE-NW
Directions: N-S, SE-NW