Monarch Park neighborhood in Longmont, Colorado (CO), 80503 detailed profile
Settings
X


Business Search - 14 Million verified businesses
Area: 0.501 square miles
Population: 378
Population density:
| Monarch Park: | 755 people per square mile |
| Longmont: | 4,619 people per square mile |

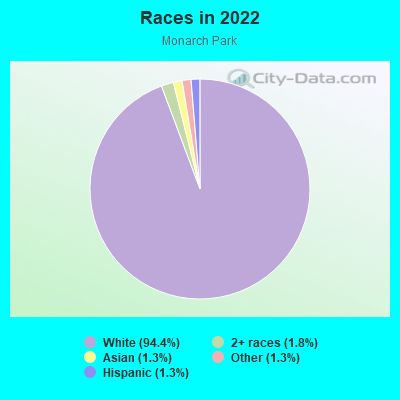
- 37294.4%White
- 71.8%Two or more races
- 51.3%Asian
- 51.3%Some other race
- 51.3%Hispanic or Latino
Median household income in 2022:
| Monarch Park: | $152,755 |
| Longmont: | $89,010 |
Distribution of median household income
![Distribution of median household income]()
- 6Less than $10,000
- 38$10,000 to $19,999
- 2$20,000 to $29,999
- 12$30,000 to $39,999
- 13$40,000 to $49,999
- 4$50,000 to $59,999
- 9$60,000 to $74,999
- 14$75,000 to $99,999
- 24$100,000 to $124,999
- 21$125,000 to $149,999
- 12$150,000 to $199,999
- 56$200,000 or more

Distribution of owner-occupied house/condo value
![Distribution of owner-occupied house/condo value]()
- 7Less than $50,000
- 2$200,000 to $249,999
- 2$250,000 to $299,999
- 8$300,000 to $399,999
- 11$400,000 to $499,999
- 71$500,000 to $749,999
- 44$750,000 to $999,999
- 19$1,000,000 or more

Distribution of rent paid by renters
![Distribution of rent paid by renters]()
- 2$200 to $299
- 1$700 to $799
- 2$900 to $999
- 9$1,000 to $1,249
- 4$1,250 to $1,499
- 3$1,500 to $1,999
- 42$2,000 or more

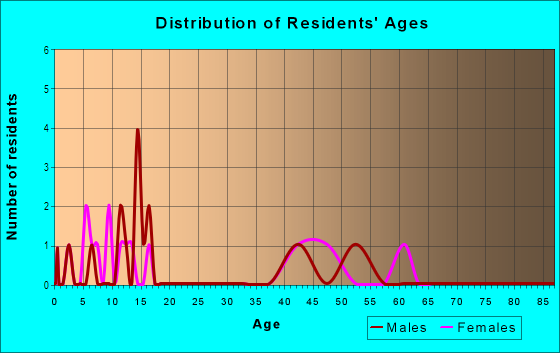
| Males: | 215 |
| Females: | 162 |
Males:
| This neighborhood: | 57.0 years |
| Whole city: | 40.0 years |
| This neighborhood: | 56.4 years |
| Whole city: | 43.1 years |
Average household size:
| Monarch Park: | 2.4 people |
| Longmont: | 2.3 people |
Percentage of family households:
| Monarch Park: | 47.5% |
| Longmont: | 37.5% |
| Here: | 80.2% |
| Longmont: | 42.4% |
Percentage of married-couple families with children (among all households):
| Monarch Park: | 32.8% |
| Longmont: | 30.9% |
Percentage of single-mother households (among all households):
| Monarch Park: | 0.4% |
| Longmont: | 10.2% |
Percentage of never married males 15 years old and over:
Percentage of never married females 15 years old and over:
| Monarch Park: | 15.3% |
| Longmont: | 18.2% |
Percentage of never married females 15 years old and over:
| Monarch Park: | 5.6% |
| city: | 14.8% |
Percentage of people that speak English not well or not at all:
| Monarch Park: | 0.8% |
| Longmont: | 2.0% |
Percentage of people born in this state:
Percentage of people born in another U.S. state:
Percentage of native residents but born outside the U.S.:
Percentage of foreign born residents:
| Here: | 27.4% |
| Longmont: | 33.6% |
Percentage of people born in another U.S. state:
| Monarch Park: | 61.9% |
| Longmont: | 54.6% |
Percentage of native residents but born outside the U.S.:
| Here: | 3.7% |
| city: | 2.6% |
Percentage of foreign born residents:
| Here: | 6.9% |
| Longmont: | 9.2% |
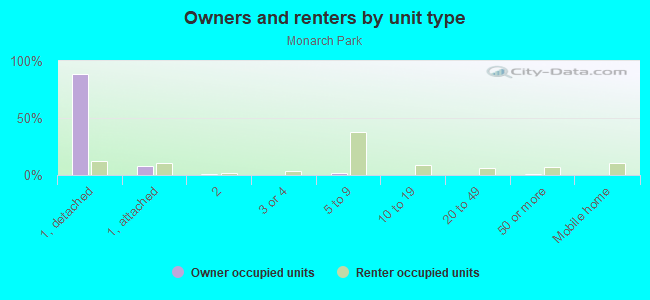
Owner-occupied
Renter-occupied

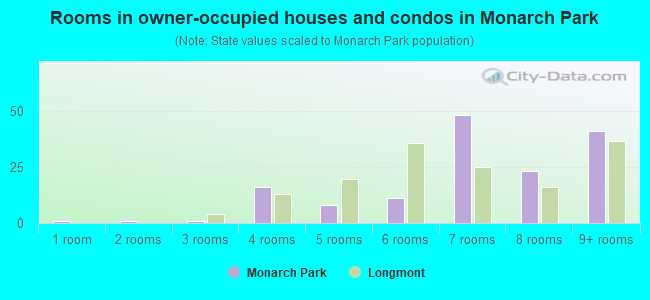
- Rooms in owner-occupied houses and condos in Monarch Park
- 11 room
- 12 rooms
- 13 rooms
- 164 rooms
- 85 rooms
- 116 rooms
- 487 rooms
- 238 rooms
- 419+ rooms
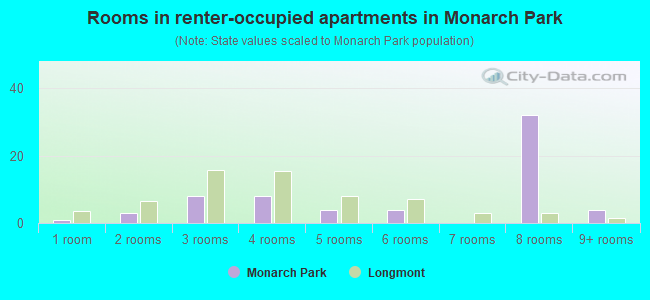
- Rooms in renter-occupied apartments in Monarch Park
- 11 room
- 32 rooms
- 83 rooms
- 84 rooms
- 45 rooms
- 46 rooms
- 07 rooms
- 328 rooms
- 49+ rooms
Owner-occupied
Renter-occupied
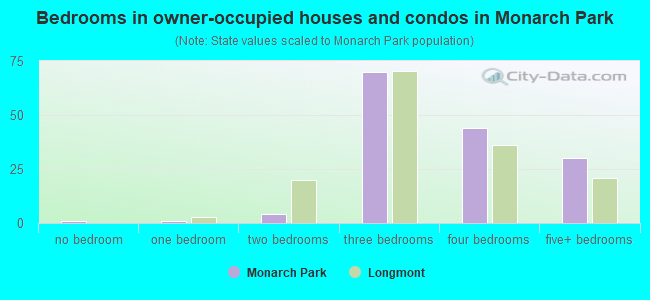
- Bedrooms in owner-occupied houses and condos in Monarch Park
- 1no bedroom
- 11 bedroom
- 42 bedrooms
- 703 bedrooms
- 444 bedrooms
- 305+ bedrooms
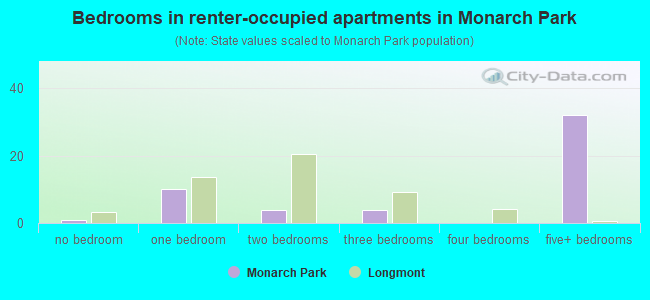
- Bedrooms in renter-occupied apartments in Monarch Park
- 1no bedroom
- 101 bedroom
- 42 bedrooms
- 43 bedrooms
- 04 bedrooms
- 325+ bedrooms
Average number of cars or other vehicles available in houses/condos:
Average number of cars or other vehicles available in apartments:
| This neighborhood: | 2.4 |
| Longmont: | 2.1 |
Average number of cars or other vehicles available in apartments:
| Here: | 4.1 |
| city: | 1.5 |
Percentage of units with a mortgage:
| Monarch Park: | 70.0% |
| Longmont: | 71.7% |
Housing prices:
- Average estimated value of detached houses in 2022 (89.9% of all units):
Monarch Park: $684,492 Longmont: $556,493
- Average estimated value of townhouses or other attached units in 2022 (9.4% of all units):
This neighborhood: $523,493 city: $344,308
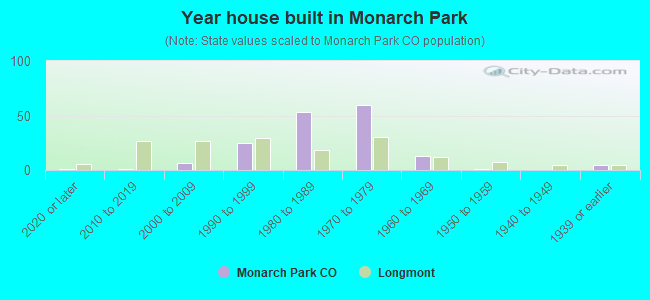
- Year house built in Monarch Park
- 12020 or later
- 12010 to 2019
- 62000 to 2009
- 251990 to 1999
- 531980 to 1989
- 601970 to 1979
- 131960 to 1969
- 11950 to 1959
- 01940 to 1949
- 51939 or earlier
City-data.com crime index for city in 2020 (higher means more crime):
| City: | 290.7 |
| U.S. average: | 219.5 |
Travel time to work (commute)
![Travel time to work (commute)]()
- 7Less than 5 minutes
- 105 to 9 minutes
- 1710 to 14 minutes
- 2115 to 19 minutes
- 2620 to 24 minutes
- 425 to 29 minutes
- 2530 to 34 minutes
- 735 to 39 minutes
- 140 to 44 minutes
- 745 to 59 minutes
- 1060 to 89 minutes
- 290 or more minutes

Means of transportation to work
![Means of transportation to work]()
- 61.0%117Drove a car alone
- 4.2%8Carpooled
- 11.5%22Bus
- 2.6%5Bicycle
- 1.0%2Walked
- 0.5%1Other means
- 22.4%43Worked at home

Time leaving home to go to work
![Time leaving home to go to work]()
- 112:00 a.m. to 4:59 a.m.
- 15:00 a.m. to 5:29 a.m.
- 75:30 a.m. to 5:59 a.m.
- 126:00 a.m. to 6:29 a.m.
- 66:30 a.m. to 6:59 a.m.
- 217:00 a.m. to 7:29 a.m.
- 357:30 a.m. to 7:59 a.m.
- 138:00 a.m. to 8:29 a.m.
- 148:30 a.m. to 8:59 a.m.
- 119:00 a.m. to 9:59 a.m.
- 410:00 a.m. to 10:59 a.m.
- 111:00 a.m. to 11:59 a.m.
- 712:00 p.m. to 3:59 p.m.
- 14:00 p.m. to 11:59 p.m.

Occupations of males:
- Percentage of males in management occupations (except farmers):
Here: 37.1% city: 11.0%
- Percentage of males in computer and mathematical occupations:
Here: 8.5% city: 9.7%
- Percentage of males in architecture and engineering occupations:
Here: 4.4% city: 7.4%
- Percentage of males in life, physical, and social science occupations:
Here: 4.4% city: 1.3%
- Percentage of males in community and social services occupations:
Here: 1.4% city: 0.9%
- Percentage of males in legal occupations:
Here: 3.8% city: 1.0%
- Percentage of males in education, training, and library occupations:
Here: 7.9% city: 3.7%
- Percentage of males in arts, design, entertainment, sports, and media occupations:
Here: 3.8% city: 2.0%
- Percentage of males in service occupations:
Here: 13.7% city: 11.4%
- Percentage of males in sales and office occupations:
Here: 9.4% city: 15.1%
- Percentage of males in production occupations:
Here: 7.0% city: 4.9%
- Percentage of males in material moving occupations:
Here: 3.8% city: 4.5%
Occupations of females:
- Percentage of females in management occupations (except farmers):
Here: 4.7% city: 11.8%
- Percentage of females in business and financial operations occupations:
Here: 12.9% city: 5.6%
- Percentage of females in computer and mathematical occupations:
Here: 8.6% city: 3.1%
- Percentage of females in life, physical, and social science occupations:
Here: 5.0% city: 1.7%
- Percentage of females in community and social services occupations:
Here: 2.3% city: 2.8%
- Percentage of females in education, training, and library occupations:
Here: 14.3% city: 9.3%
- Percentage of females in service occupations:
Here: 43.3% city: 17.8%
- Percentage of females in sales and office occupations:
Here: 6.8% city: 26.1%
- Percentage of females in transportation occupations:
Here: 4.3% city: 1.5%
- Percentage of females in material moving occupations:
Here: 1.2% city: 1.6%
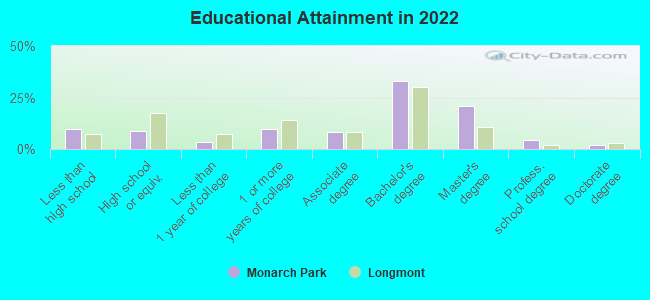
Education in this neighborhood (subdivision or community):
- Percentage of people 3 years and older in K-12 schools:
Monarch Park: 12.2% Longmont: 14.7%
- Percentage of people 3 years and older in undergraduate colleges:
Monarch Park: 30.2% Longmont: 3.2%
- Percentage of people 3 years and older in grad. or professional schools:
Monarch Park: 0.0% Longmont: 1.4%
- Percentage of students K-12 enrolled in private schools:
Monarch Park: 39.1% Longmont: 21.2%
Percentage of population below poverty level:
| Monarch Park: | 5.4% |
| Longmont: | 9.4% |
Median year owner moved in (as recorded in 2022):
| Monarch Park: | 2002 |
| Longmont: | 2012 |
Percentage of married-couple families with both working:
| Monarch Park: | 49.2% |
| Longmont: | 79.7% |
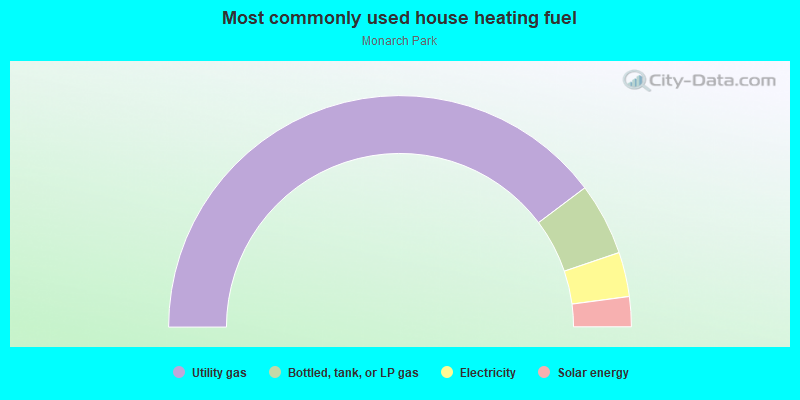
- 79.4%Utility gas
- 10.1%Bottled, tank, or LP gas
- 6.2%Electricity
- 4.2%Solar energy
Highways in this neighborhood:
State Hwy 52 (Mineral Rd)
Length: 0.46 miles
Direction: E-W
Address range: 7500 to 7899
Direction: E-W
Address range: 7500 to 7899
Diagonal Hwy (Longmont Diagonal Hwy, State Hwy 119)
Length: 0.14 miles
Direction: SW-NE
Direction: SW-NE
Roads and streets:
W Dry Creek Pkwy
Length: 0.91 miles
Directions: E-W, N-S, SE-NW, SW-NE
Directions: E-W, N-S, SE-NW, SW-NE
Monarch Rd
Length: 0.76 miles
Direction: E-W
Address range: 7202 to 7765
Direction: E-W
Address range: 7202 to 7765
Monarch Park Pl
Length: 0.47 miles
Directions: E-W, N-S, SE-NW, SW-NE
Address range: 6200 to 6399
Directions: E-W, N-S, SE-NW, SW-NE
Address range: 6200 to 6399
Dry Creek Pkwy
Length: 0.46 miles
Directions: E-W, N-S, SE-NW, SW-NE
Address range: 6300 to 6500
Directions: E-W, N-S, SE-NW, SW-NE
Address range: 6300 to 6500
Monarch Park Ct
Length: 0.28 miles
Directions: E-W, N-S
Address range: 6400 to 6599
Directions: E-W, N-S
Address range: 6400 to 6599
71st St
Length: 0.19 miles
Direction: N-S
Direction: N-S
E Dry Creek Pkwy
Length: 0.19 miles
Directions: E-W, N-S, SW-NE
Address range: 7400 to 7499
Directions: E-W, N-S, SW-NE
Address range: 7400 to 7499
Railroad features:
Burlington Northern Santa Fe Rlwy
Length: 0.48 miles
Direction: SW-NE
Direction: SW-NE
Other features:
Dry Crk
Length: 1.16 miles
Directions: E-W, N-S, SE-NW, SW-NE
Directions: E-W, N-S, SE-NW, SW-NE
Other features:
Bldr and Lt Hand Ditch
Length: 0.07 miles
Direction: SW-NE
Direction: SW-NE