Millbrook neighborhood in Columbus, Ohio (OH), 43207 detailed profile
Settings
X


Business Search - 14 Million verified businesses
Area: 0.172 square miles
Population: 1,274
Population density:
| Millbrook: | 7,427 people per square mile |
| Columbus: | 4,320 people per square mile |

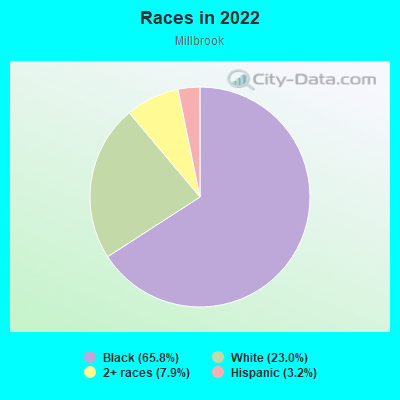
- 83865.8%Black
- 29323.0%White
- 1017.9%Two or more races
- 413.2%Hispanic or Latino
Median household income in 2022:
| Millbrook: | $33,496 |
| Columbus: | $61,727 |
Distribution of median household income
![Distribution of median household income]()
- 68Less than $10,000
- 101$10,000 to $19,999
- 53$20,000 to $29,999
- 72$30,000 to $39,999
- 49$40,000 to $49,999
- 30$50,000 to $59,999
- 49$60,000 to $74,999
- 24$75,000 to $99,999
- 29$125,000 to $149,999

Distribution of owner-occupied house/condo value
![Distribution of owner-occupied house/condo value]()
- 14Less than $50,000
- 81$50,000 to $99,999
- 14$100,000 to $149,999
- 5$150,000 to $199,999

Distribution of rent paid by renters
![Distribution of rent paid by renters]()
- 15Less than $100
- 12$100 to $199
- 2$200 to $299
- 17$500 to $599
- 16$600 to $699
- 73$700 to $799
- 80$800 to $899
- 125$900 to $999
- 29$1,000 to $1,249

Median rent in 2022:
| Millbrook: | $862 |
| Columbus: | $1,005 |
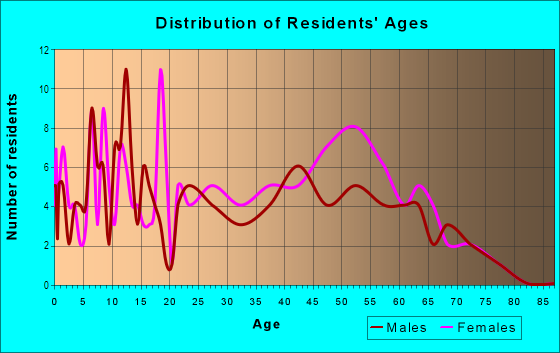
| Males: | 659 |
| Females: | 615 |
Males:
| This neighborhood: | 32.9 years |
| Whole city: | 32.9 years |
| This neighborhood: | 33.1 years |
| Whole city: | 33.7 years |
Average household size:
| Millbrook: | 2.2 people |
| Columbus: | 2.3 people |
Percentage of family households:
| Millbrook: | 41.2% |
| Columbus: | 40.8% |
| Here: | 8.5% |
| Columbus: | 30.8% |
Percentage of married-couple families with children (among all households):
| Millbrook: | 13.7% |
| Columbus: | 23.7% |
Percentage of single-mother households (among all households):
| Millbrook: | 16.1% |
| Columbus: | 15.7% |
Percentage of never married males 15 years old and over:
Percentage of never married females 15 years old and over:
| Millbrook: | 32.4% |
| Columbus: | 24.6% |
Percentage of never married females 15 years old and over:
| Millbrook: | 25.1% |
| city: | 21.9% |
Percentage of people that speak English not well or not at all:
| Millbrook: | 0.0% |
| Columbus: | 3.5% |
Percentage of people born in this state:
Percentage of people born in another U.S. state:
Percentage of native residents but born outside the U.S.:
Percentage of foreign born residents:
| Here: | 74.3% |
| Columbus: | 61.6% |
Percentage of people born in another U.S. state:
| Millbrook: | 22.1% |
| Columbus: | 22.4% |
Percentage of native residents but born outside the U.S.:
| Here: | 2.2% |
| city: | 1.3% |
Percentage of foreign born residents:
| Here: | 1.4% |
| Columbus: | 14.7% |
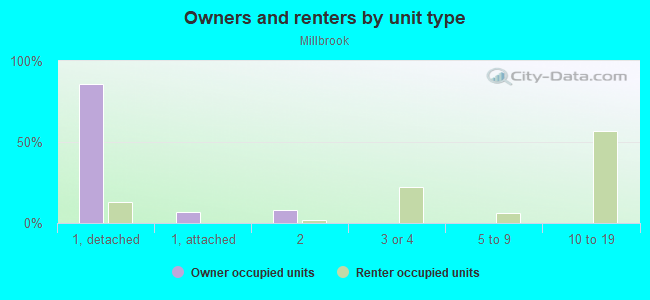
Owner-occupied
Renter-occupied

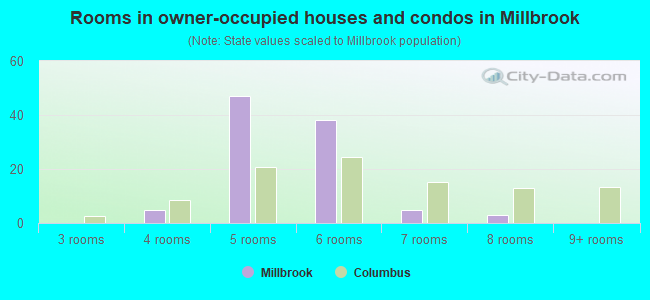
- Rooms in owner-occupied houses and condos in Millbrook
- 01 room
- 02 rooms
- 03 rooms
- 54 rooms
- 475 rooms
- 386 rooms
- 57 rooms
- 38 rooms
- 09+ rooms
- Rooms in renter-occupied apartments in Millbrook
- 61 room
- 02 rooms
- 503 rooms
- 1844 rooms
- 965 rooms
- 266 rooms
- 47 rooms
- 08 rooms
- 09+ rooms
Owner-occupied
Renter-occupied
- Bedrooms in owner-occupied houses and condos in Millbrook
- 0no bedroom
- 01 bedroom
- 152 bedrooms
- 803 bedrooms
- 34 bedrooms
- 05+ bedrooms
- Bedrooms in renter-occupied apartments in Millbrook
- 6no bedroom
- 611 bedroom
- 2122 bedrooms
- 723 bedrooms
- 164 bedrooms
- 05+ bedrooms
Average number of cars or other vehicles available in houses/condos:
Average number of cars or other vehicles available in apartments:
| This neighborhood: | 1.6 |
| Columbus: | 1.8 |
Average number of cars or other vehicles available in apartments:
| Here: | 1.2 |
| city: | 1.3 |
Percentage of units with a mortgage:
| Millbrook: | 45.8% |
| Columbus: | 69.3% |
- Year house built in Millbrook
- 02020 or later
- 252010 to 2019
- 02000 to 2009
- 261990 to 1999
- 41980 to 1989
- 711970 to 1979
- 2031960 to 1969
- 4201950 to 1959
- 21940 to 1949
- 211939 or earlier
City-data.com crime index for city in 2020 (higher means more crime):
| City: | 376.1 |
| U.S. average: | 219.5 |
Travel time to work (commute)
![Travel time to work (commute)]()
- 3Less than 5 minutes
- 135 to 9 minutes
- 1510 to 14 minutes
- 2015 to 19 minutes
- 2720 to 24 minutes
- 225 to 29 minutes
- 2030 to 34 minutes
- 7345 to 59 minutes
- 460 to 89 minutes
- 390 or more minutes

Means of transportation to work
![Means of transportation to work]()
- 67.7%281Drove a car alone
- 8.9%37Carpooled
- 4.1%17Bus
- 1.7%7Walked
- 1.2%5Other means
- 15.4%64Worked at home

Time leaving home to go to work
![Time leaving home to go to work]()
- 2112:00 a.m. to 4:59 a.m.
- 205:00 a.m. to 5:29 a.m.
- 15:30 a.m. to 5:59 a.m.
- 46:30 a.m. to 6:59 a.m.
- 87:00 a.m. to 7:29 a.m.
- 27:30 a.m. to 7:59 a.m.
- 158:00 a.m. to 8:29 a.m.
- 28:30 a.m. to 8:59 a.m.
- 1210:00 a.m. to 10:59 a.m.
- 211:00 a.m. to 11:59 a.m.
- 1912:00 p.m. to 3:59 p.m.
- 284:00 p.m. to 11:59 p.m.

Occupations of males:
- Percentage of males in management occupations (except farmers):
Here: 6.5% city: 10.2%
- Percentage of males in life, physical, and social science occupations:
Here: 3.6% city: 1.1%
- Percentage of males in community and social services occupations:
Here: 2.8% city: 1.2%
- Percentage of males in arts, design, entertainment, sports, and media occupations:
Here: 1.3% city: 2.1%
- Percentage of males in service occupations:
Here: 26.7% city: 13.8%
- Percentage of males in sales and office occupations:
Here: 28.2% city: 17.0%
- Percentage of males in construction, extraction, and maintenance occupations:
Here: 6.5% city: 5.2%
- Percentage of males in production occupations:
Here: 2.8% city: 6.5%
- Percentage of males in transportation occupations:
Here: 17.1% city: 6.4%
- Percentage of males in material moving occupations:
Here: 3.1% city: 7.9%
Occupations of females:
- Percentage of females in management occupations (except farmers):
Here: 8.2% city: 10.0%
- Percentage of females in business and financial operations occupations:
Here: 6.1% city: 8.2%
- Percentage of females in community and social services occupations:
Here: 2.4% city: 3.0%
- Percentage of females in legal occupations:
Here: 1.0% city: 1.3%
- Percentage of females in education, training, and library occupations:
Here: 2.7% city: 7.9%
- Percentage of females in service occupations:
Here: 23.8% city: 19.3%
- Percentage of females in sales and office occupations:
Here: 22.1% city: 25.0%
- Percentage of females in production occupations:
Here: 14.6% city: 3.0%
- Percentage of females in transportation occupations:
Here: 4.8% city: 1.3%
- Percentage of females in material moving occupations:
Here: 14.3% city: 3.7%
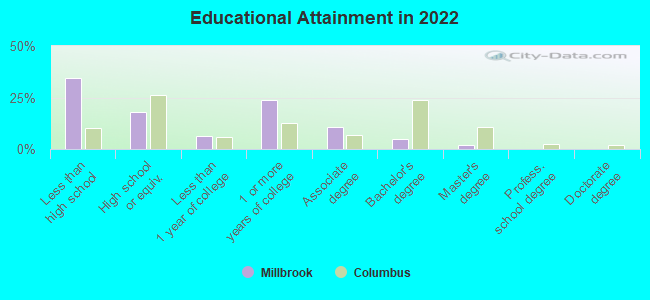
Education in this neighborhood (subdivision or community):
- Percentage of people 3 years and older in K-12 schools:
Millbrook: 22.0% Columbus: 15.2%
- Percentage of people 3 years and older in undergraduate colleges:
Millbrook: 2.0% Columbus: 6.7%
- Percentage of people 3 years and older in grad. or professional schools:
Millbrook: 0.0% Columbus: 2.4%
- Percentage of students K-12 enrolled in private schools:
Millbrook: 3.0% Columbus: 13.8%
Percentage of population below poverty level:
| Millbrook: | 39.6% |
| Columbus: | 18.1% |
Median year owner moved in (as recorded in 2022):
Median year renter moved in (as recorded in 2022):
| Millbrook: | 1989 |
| Columbus: | 2012 |
Median year renter moved in (as recorded in 2022):
| Millbrook: | 2018 |
| Columbus: | 2020 |
Percentage of married-couple families with both working:
| Millbrook: | 100.0% |
| Columbus: | 75.5% |
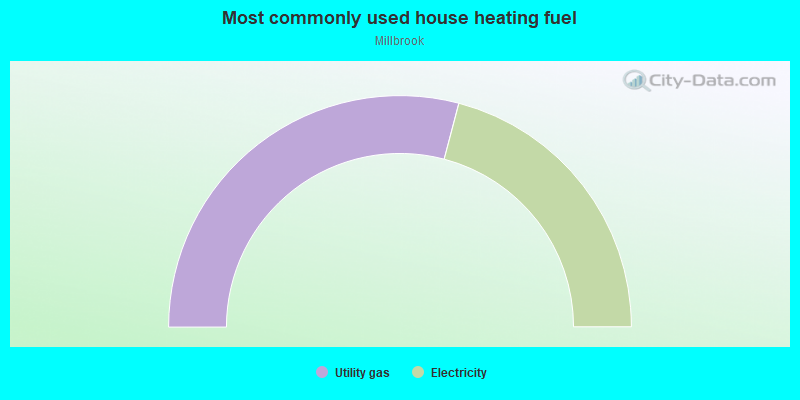
- 58.2%Utility gas
- 41.8%Electricity
Roads and streets:
Smith Rd
Length: 0.29 miles
Directions: E-W, SE-NW, SW-NE
Address range: 1542 to 1710
Directions: E-W, SE-NW, SW-NE
Address range: 1542 to 1710
Liscomb Rd
Length: 0.28 miles
Direction: E-W
Address range: 1500 to 1799
Direction: E-W
Address range: 1500 to 1799
Holburn Ave
Length: 0.26 miles
Directions: N-S, SW-NE
Address range: 1771 to 1951
Directions: N-S, SW-NE
Address range: 1771 to 1951
Kermit Ave
Length: 0.25 miles
Directions: N-S, SW-NE
Address range: 1739 to 1910
Directions: N-S, SW-NE
Address range: 1739 to 1910
Pannell Ave
Length: 0.21 miles
Direction: N-S
Address range: 1800 to 1947
Direction: N-S
Address range: 1800 to 1947
Valcon Ave
Length: 0.20 miles
Directions: N-S, SW-NE
Address range: 1785 to 1930
Directions: N-S, SW-NE
Address range: 1785 to 1930
Nason Ave
Length: 0.20 miles
Directions: N-S, SE-NW
Address range: 1754 to 1899
Directions: N-S, SE-NW
Address range: 1754 to 1899
Page Rd
Length: 0.13 miles
Direction: E-W
Address range: 1634 to 1706
Direction: E-W
Address range: 1634 to 1706
Valcon Pl
Length: 0.07 miles
Directions: E-W, SE-NW
Address range: 1578 to 1630
Directions: E-W, SE-NW
Address range: 1578 to 1630