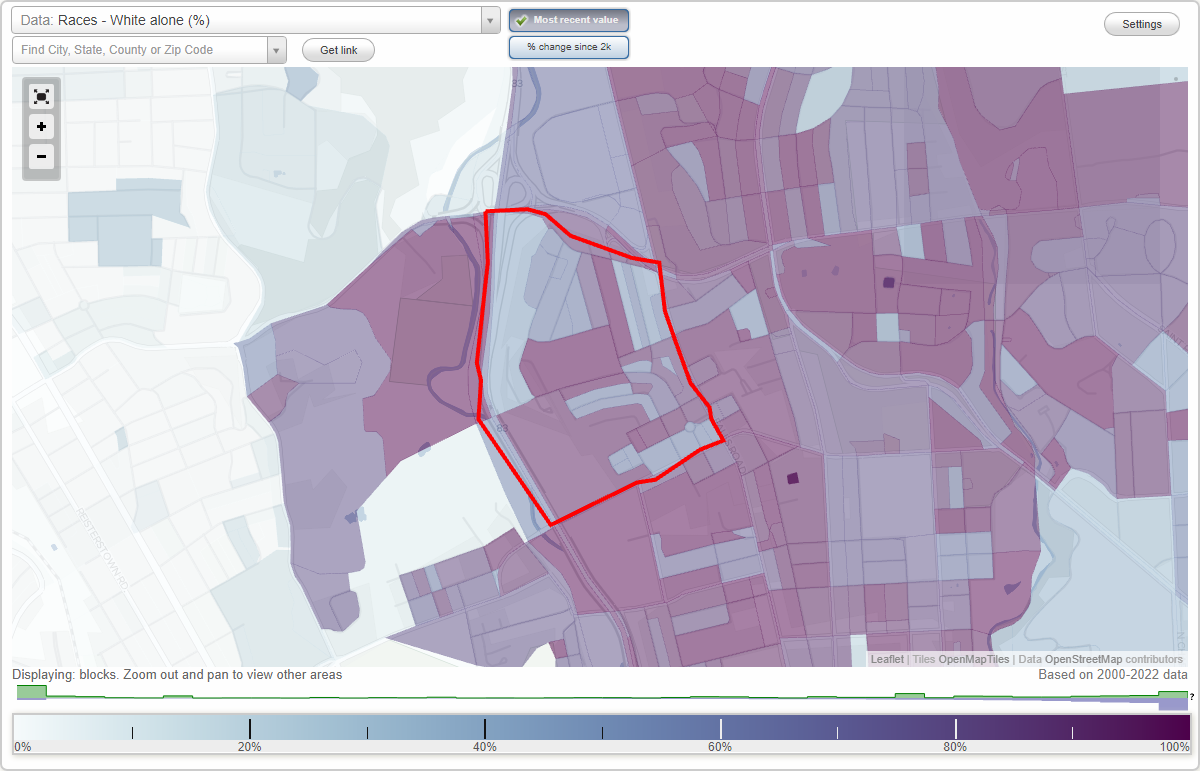
Medfield neighborhood in Baltimore, Maryland (MD), 21211 detailed profile
Settings
X

Business Search - 14 Million verified businesses
Area: 0.267 square miles
Population: 2,274
Population density:
| Medfield: | 8,528 people per square mile |
| Baltimore: | 7,053 people per square mile |

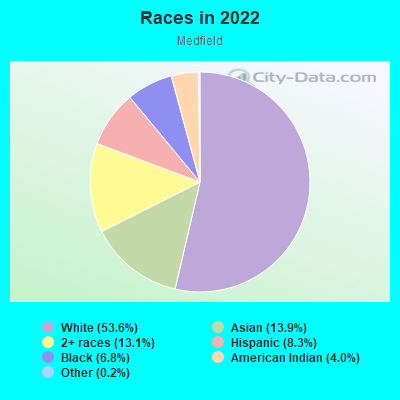
- 1,38153.6%White
- 35913.9%Asian
- 33813.1%Two or more races
- 2138.3%Hispanic or Latino
- 1756.8%Black
- 1034.0%American Indian
- 60.2%Some other race
- 20.08%Native Hawaiian and Other
Pacific Islander
Median household income in 2022:
| Medfield: | $96,123 |
| Baltimore: | $55,198 |
Distribution of median household income
![Distribution of median household income]()
- 101Less than $10,000
- 106$10,000 to $19,999
- 88$20,000 to $29,999
- 69$30,000 to $39,999
- 114$40,000 to $49,999
- 154$50,000 to $59,999
- 108$60,000 to $74,999
- 317$75,000 to $99,999
- 125$100,000 to $124,999
- 97$125,000 to $149,999
- 89$150,000 to $199,999
- 51$200,000 or more

Distribution of owner-occupied house/condo value
![Distribution of owner-occupied house/condo value]()
- 123Less than $50,000
- 95$50,000 to $99,999
- 36$100,000 to $149,999
- 90$150,000 to $199,999
- 246$200,000 to $249,999
- 64$250,000 to $299,999
- 81$300,000 to $399,999
- 70$400,000 to $499,999
- 69$500,000 to $749,999
- 18$750,000 to $999,999
- 18$1,000,000 or more

Distribution of rent paid by renters
![Distribution of rent paid by renters]()
- 28$100 to $199
- 17$200 to $299
- 8$400 to $499
- 54$500 to $599
- 70$600 to $699
- 69$700 to $799
- 5$800 to $899
- 32$900 to $999
- 331$1,000 to $1,249
- 116$1,250 to $1,499
- 53$1,500 to $1,999
- 148$2,000 or more

Median rent in 2022:
| Medfield: | $1,218 |
| Baltimore: | $1,043 |
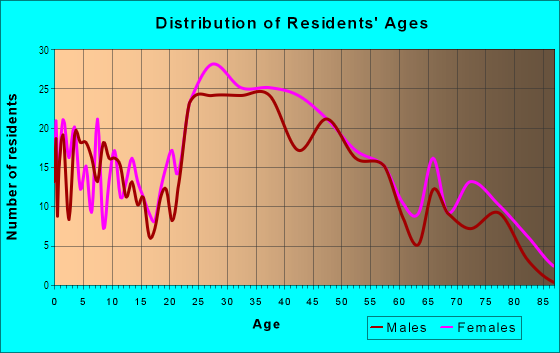
| Males: | 1,118 |
| Females: | 1,156 |
Males:
| This neighborhood: | 40.9 years |
| Whole city: | 35.0 years |
| This neighborhood: | 42.2 years |
| Whole city: | 38.2 years |
Average household size:
| Medfield: | 1.9 people |
| Baltimore: | 2.2 people |
Percentage of family households:
| Medfield: | 33.6% |
| Baltimore: | 34.2% |
| Here: | 36.4% |
| Baltimore: | 23.3% |
Percentage of married-couple families with children (among all households):
| Medfield: | 49.7% |
| Baltimore: | 22.4% |
Percentage of single-mother households (among all households):
| Medfield: | 4.8% |
| Baltimore: | 18.7% |
Percentage of never married males 15 years old and over:
Percentage of never married females 15 years old and over:
| Medfield: | 18.6% |
| Baltimore: | 25.1% |
Percentage of never married females 15 years old and over:
| Medfield: | 21.1% |
| city: | 27.5% |
Percentage of people that speak English not well or not at all:
| Medfield: | 3.7% |
| Baltimore: | 2.3% |
Percentage of people born in this state:
Percentage of people born in another U.S. state:
Percentage of native residents but born outside the U.S.:
Percentage of foreign born residents:
| Here: | 50.5% |
| Baltimore: | 64.4% |
Percentage of people born in another U.S. state:
| Medfield: | 28.7% |
| Baltimore: | 25.0% |
Percentage of native residents but born outside the U.S.:
| Here: | 0.2% |
| city: | 0.9% |
Percentage of foreign born residents:
| Here: | 20.6% |
| Baltimore: | 9.7% |
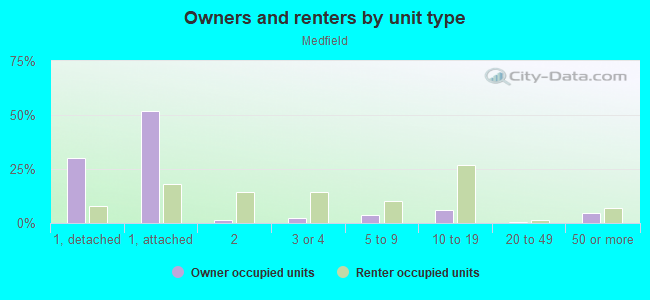
Owner-occupied
Renter-occupied

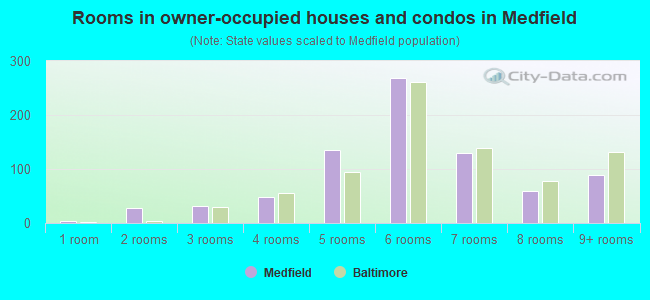
- Rooms in owner-occupied houses and condos in Medfield
- 41 room
- 272 rooms
- 313 rooms
- 494 rooms
- 1365 rooms
- 2686 rooms
- 1307 rooms
- 608 rooms
- 889+ rooms
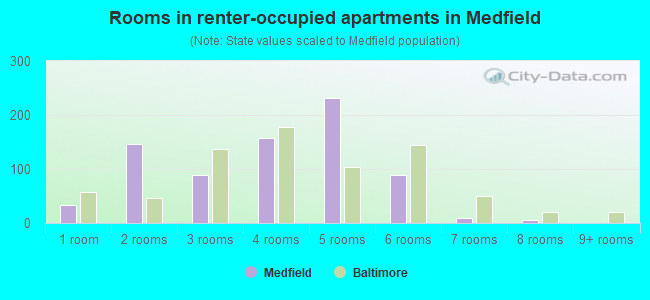
- Rooms in renter-occupied apartments in Medfield
- 331 room
- 1462 rooms
- 883 rooms
- 1574 rooms
- 2315 rooms
- 886 rooms
- 97 rooms
- 58 rooms
- 09+ rooms
Owner-occupied
Renter-occupied
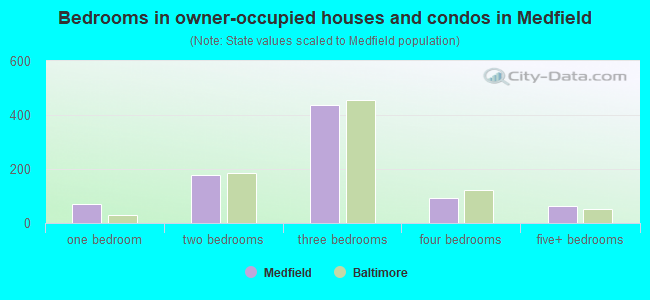
- Bedrooms in owner-occupied houses and condos in Medfield
- 4no bedroom
- 721 bedroom
- 1792 bedrooms
- 4383 bedrooms
- 924 bedrooms
- 635+ bedrooms
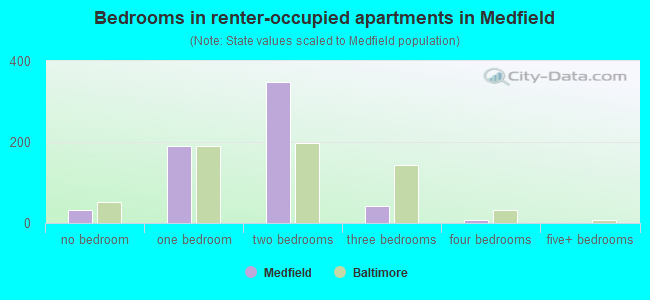
- Bedrooms in renter-occupied apartments in Medfield
- 33no bedroom
- 1901 bedroom
- 3482 bedrooms
- 423 bedrooms
- 84 bedrooms
- 05+ bedrooms
Average number of cars or other vehicles available in houses/condos:
Average number of cars or other vehicles available in apartments:
| This neighborhood: | 1.3 |
| Baltimore: | 1.5 |
Average number of cars or other vehicles available in apartments:
| Here: | 0.9 |
| city: | 0.8 |
Percentage of units with a mortgage:
| Medfield: | 66.5% |
| Baltimore: | 64.3% |
Average estimated value of townhouses or other attached units in 2022 (44.4% of all units):
| This neighborhood: | $310,518 |
| city: | $206,258 |
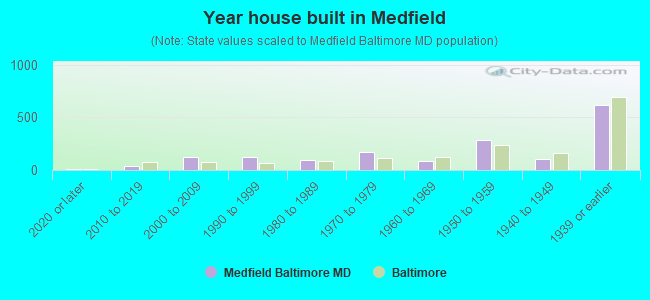
- Year house built in Medfield
- 112020 or later
- 402010 to 2019
- 1222000 to 2009
- 1251990 to 1999
- 971980 to 1989
- 1671970 to 1979
- 841960 to 1969
- 2811950 to 1959
- 1001940 to 1949
- 6201939 or earlier
Travel time to work (commute)
![Travel time to work (commute)]()
- 18Less than 5 minutes
- 635 to 9 minutes
- 15610 to 14 minutes
- 19815 to 19 minutes
- 30920 to 24 minutes
- 10025 to 29 minutes
- 14130 to 34 minutes
- 12735 to 39 minutes
- 3840 to 44 minutes
- 13945 to 59 minutes
- 8860 to 89 minutes
- 1190 or more minutes

Means of transportation to work
![Means of transportation to work]()
- 60.8%950Drove a car alone
- 4.2%65Carpooled
- 5.0%78Bus
- 0.9%14Subway or elevated rail
- 3.2%50Long-distance train or commuter rail
- 2.0%32Light rail, streetcar or trolley
- 0.8%13Taxi
- 0.3%5Motorcycle
- 1.9%29Bicycle
- 14.0%218Walked
- 4.0%62Other means
- 12.9%201Worked at home

Time leaving home to go to work
![Time leaving home to go to work]()
- 3212:00 a.m. to 4:59 a.m.
- 675:00 a.m. to 5:29 a.m.
- 325:30 a.m. to 5:59 a.m.
- 896:00 a.m. to 6:29 a.m.
- 1046:30 a.m. to 6:59 a.m.
- 657:00 a.m. to 7:29 a.m.
- 1257:30 a.m. to 7:59 a.m.
- 1718:00 a.m. to 8:29 a.m.
- 1998:30 a.m. to 8:59 a.m.
- 409:00 a.m. to 9:59 a.m.
- 6410:00 a.m. to 10:59 a.m.
- 14311:00 a.m. to 11:59 a.m.
- 11712:00 p.m. to 3:59 p.m.
- 1324:00 p.m. to 11:59 p.m.

Occupations of males:
- Percentage of males in management occupations (except farmers):
Here: 7.7% city: 10.7%
- Percentage of males in business and financial operations occupations:
Here: 3.3% city: 5.9%
- Percentage of males in computer and mathematical occupations:
Here: 12.8% city: 6.1%
- Percentage of males in architecture and engineering occupations:
Here: 5.3% city: 2.9%
- Percentage of males in life, physical, and social science occupations:
Here: 2.3% city: 2.3%
- Percentage of males in community and social services occupations:
Here: 4.1% city: 1.6%
- Percentage of males in education, training, and library occupations:
Here: 4.8% city: 5.4%
- Percentage of males in arts, design, entertainment, sports, and media occupations:
Here: 1.3% city: 2.8%
- Percentage of males in healthcare practitioners and technical occupations:
Here: 6.2% city: 4.0%
- Percentage of males in service occupations:
Here: 16.7% city: 14.7%
- Percentage of males in sales and office occupations:
Here: 9.8% city: 14.2%
- Percentage of males in construction, extraction, and maintenance occupations:
Here: 12.6% city: 5.6%
- Percentage of males in transportation occupations:
Here: 3.6% city: 6.8%
- Percentage of males in material moving occupations:
Here: 6.1% city: 7.0%
Occupations of females:
- Percentage of females in management occupations (except farmers):
Here: 8.1% city: 10.1%
- Percentage of females in business and financial operations occupations:
Here: 12.0% city: 6.6%
- Percentage of females in architecture and engineering occupations:
Here: 2.0% city: 0.9%
- Percentage of females in life, physical, and social science occupations:
Here: 1.3% city: 2.5%
- Percentage of females in community and social services occupations:
Here: 4.4% city: 3.6%
- Percentage of females in legal occupations:
Here: 2.8% city: 1.8%
- Percentage of females in education, training, and library occupations:
Here: 11.9% city: 10.7%
- Percentage of females in healthcare practitioners and technical occupations:
Here: 1.7% city: 9.8%
- Percentage of females in service occupations:
Here: 16.9% city: 20.4%
- Percentage of females in sales and office occupations:
Here: 34.5% city: 22.3%
- Percentage of females in production occupations:
Here: 2.6% city: 2.3%
Percentage of people 16-64 in Armed Forces:
| Medfield: | 0.0% |
| Baltimore: | 0.4% |
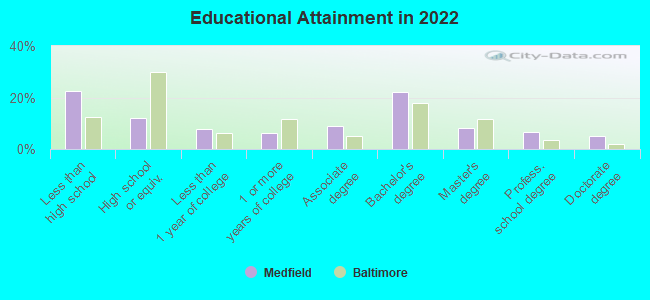
Education in this neighborhood (subdivision or community):
- Percentage of people 3 years and older in K-12 schools:
Medfield: 21.3% Baltimore: 14.7%
- Percentage of people 3 years and older in undergraduate colleges:
Medfield: 6.5% Baltimore: 6.0%
- Percentage of people 3 years and older in grad. or professional schools:
Medfield: 2.2% Baltimore: 2.8%
- Percentage of students K-12 enrolled in private schools:
Medfield: 57.9% Baltimore: 12.7%
Percentage of population below poverty level:
| Medfield: | 6.7% |
| Baltimore: | 18.5% |
Median year owner moved in (as recorded in 2022):
Median year renter moved in (as recorded in 2022):
| Medfield: | 2010 |
| Baltimore: | 2009 |
Median year renter moved in (as recorded in 2022):
| Medfield: | 2019 |
| Baltimore: | 2019 |
Percentage of married-couple families with both working:
| Medfield: | 102.9% |
| Baltimore: | 79.2% |
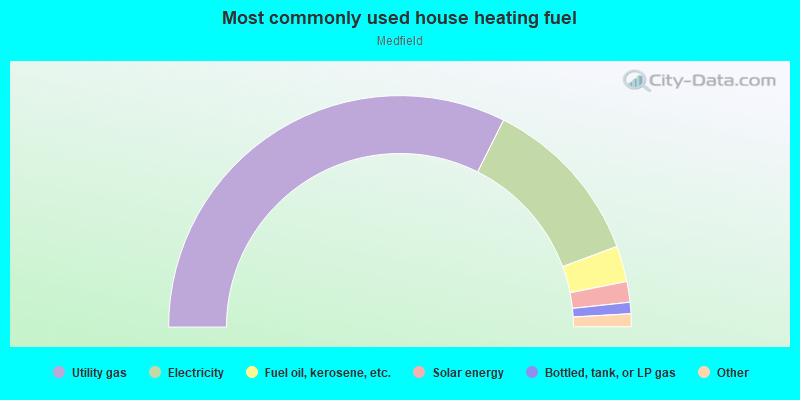
- 64.8%Utility gas
- 23.9%Electricity
- 5.0%Fuel oil, kerosene, etc.
- 2.9%Solar energy
- 1.6%Bottled, tank, or LP gas
- 0.9%Other fuel
- 0.9%No fuel used
Limited-access highways (interstate or state) in this neighborhood:
Jones Falls Expy (I- 83)
Length: 1.04 miles
Directions: N-S, SE-NW
Directions: N-S, SE-NW
Highways in this neighborhood:
State Hwy 25 (Falls Rd)
Length: 0.31 miles
Directions: N-S, SE-NW
Address range: 4100 to 4505
Directions: N-S, SE-NW
Address range: 4100 to 4505
Roads and streets:
W Old Cold Spring Ln
Length: 0.50 miles
Directions: E-W, SE-NW
Address range: 1200 to 1699
Directions: E-W, SE-NW
Address range: 1200 to 1699
Roland Heights Ave
Length: 0.44 miles
Direction: E-W
Address range: 1200 to 1599
Direction: E-W
Address range: 1200 to 1599
Laplata Ave
Length: 0.40 miles
Directions: E-W, N-S, SE-NW, SW-NE
Address range: 4300 to 4499
Directions: E-W, N-S, SE-NW, SW-NE
Address range: 4300 to 4499
Buchanan Ave
Length: 0.34 miles
Directions: N-S, SE-NW
Address range: 4100 to 4499
Directions: N-S, SE-NW
Address range: 4100 to 4499
Clydesdale Ave
Length: 0.31 miles
Directions: E-W, SE-NW, SW-NE
Address range: 4232 to 4499
Directions: E-W, SE-NW, SW-NE
Address range: 4232 to 4499
W 42nd St
Length: 0.31 miles
Directions: E-W, SW-NE
Address range: 1200 to 1499
Directions: E-W, SW-NE
Address range: 1200 to 1499
Weldon Ave
Length: 0.30 miles
Directions: E-W, N-S, SE-NW, SW-NE
Address range: 1201 to 1399
Directions: E-W, N-S, SE-NW, SW-NE
Address range: 1201 to 1399
Buena Vista Ave
Length: 0.27 miles
Directions: N-S, SE-NW
Address range: 4100 to 4499
Directions: N-S, SE-NW
Address range: 4100 to 4499
W 41st St
Length: 0.26 miles
Direction: E-W
Address range: 1200 to 1605
Direction: E-W
Address range: 1200 to 1605
Newport Ave
Length: 0.26 miles
Direction: N-S
Address range: 4200 to 4499
Direction: N-S
Address range: 4200 to 4499
Woodheights Ave
Length: 0.25 miles
Direction: E-W
Address range: 1400 to 1599
Direction: E-W
Address range: 1400 to 1599
Redfern Ave
Length: 0.24 miles
Directions: E-W, SE-NW
Address range: 1400 to 1499
Directions: E-W, SE-NW
Address range: 1400 to 1499
Elsa Ter
Length: 0.24 miles
Directions: E-W, SE-NW
Address range: 4131 to 4299
Directions: E-W, SE-NW
Address range: 4131 to 4299
Falls Bridge Dr
Length: 0.23 miles
Directions: E-W, N-S, SE-NW, SW-NE
Address range: 4400 to 4499
Directions: E-W, N-S, SE-NW, SW-NE
Address range: 4400 to 4499
Edgehill Ave
Length: 0.23 miles
Directions: E-W, SE-NW
Address range: 4100 to 4299
Directions: E-W, SE-NW
Address range: 4100 to 4299
Grandview Ave
Length: 0.22 miles
Direction: N-S
Address range: 4300 to 4499
Direction: N-S
Address range: 4300 to 4499
Medfield Ave
Length: 0.19 miles
Direction: E-W
Address range: 1300 to 1499
Direction: E-W
Address range: 1300 to 1499
Overlook Ave
Length: 0.09 miles
Direction: N-S
Address range: 4300 to 4499
Direction: N-S
Address range: 4300 to 4499
S Weldon Pl
Length: 0.07 miles
Direction: E-W
Address range: 1400 to 1499
Direction: E-W
Address range: 1400 to 1499
N Weldon Pl
Length: 0.07 miles
Direction: SW-NE
Address range: 1400 to 1499
Direction: SW-NE
Address range: 1400 to 1499
W Weldon Pl
Length: 0.06 miles
Directions: E-W, N-S, SE-NW, SW-NE
Address range: 4100 to 4199
Directions: E-W, N-S, SE-NW, SW-NE
Address range: 4100 to 4199
Amherst Ave
Length: 0.06 miles
Directions: E-W, SE-NW
Address range: 1600 to 1799
Directions: E-W, SE-NW
Address range: 1600 to 1799
Other features:
Jones Fls
Length: 0.21 miles
Direction: SE-NW
Direction: SE-NW