McDonnell Center neighborhood in Huntington Beach, California (CA), 92647, 92649 detailed profile
Settings
X


Business Search - 14 Million verified businesses
Area: 0.520 square miles
Population: 1,138
Population density:
| McDonnell Center: | 2,187 people per square mile |
| Huntington Beach: | 7,362 people per square mile |

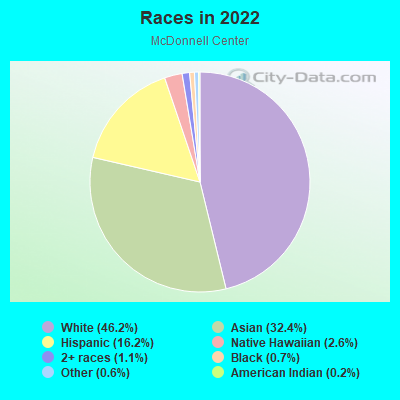
- 52646.2%White
- 36932.4%Asian
- 18416.2%Hispanic or Latino
- 302.6%Native Hawaiian and Other
Pacific Islander - 121.1%Two or more races
- 80.7%Black
- 70.6%Some other race
- 20.2%American Indian
Median household income in 2022:
| McDonnell Center: | $137,107 |
| Huntington Beach: | $111,122 |
Distribution of median household income
![Distribution of median household income]()
- 14Less than $10,000
- 35$10,000 to $19,999
- 14$20,000 to $29,999
- 31$30,000 to $39,999
- 21$40,000 to $49,999
- 20$50,000 to $59,999
- 25$60,000 to $74,999
- 24$75,000 to $99,999
- 19$100,000 to $124,999
- 47$125,000 to $149,999
- 19$150,000 to $199,999
- 137$200,000 or more

Distribution of owner-occupied house/condo value
![Distribution of owner-occupied house/condo value]()
- 28Less than $50,000
- 11$50,000 to $99,999
- 4$300,000 to $399,999
- 14$400,000 to $499,999
- 33$500,000 to $749,999
- 155$750,000 to $999,999
- 150$1,000,000 or more

Distribution of rent paid by renters
![Distribution of rent paid by renters]()
- 7$1,000 to $1,249
- 14$1,250 to $1,499
- 57$1,500 to $1,999
- 55$2,000 or more

Median rent in 2022:
| McDonnell Center: | $1,818 |
| Huntington Beach: | $2,001 |
| Males: | 597 |
| Females: | 541 |
Males:
| This neighborhood: | 42.7 years |
| Whole city: | 43.6 years |
| This neighborhood: | 44.4 years |
| Whole city: | 44.2 years |
Average household size:
| McDonnell Center: | 3.3 people |
| Huntington Beach: | 2.5 people |
Percentage of family households:
| McDonnell Center: | 61.6% |
| Huntington Beach: | 42.1% |
| Here: | 65.1% |
| Huntington Beach: | 47.5% |
Percentage of married-couple families with children (among all households):
| McDonnell Center: | 22.8% |
| Huntington Beach: | 31.5% |
Percentage of single-mother households (among all households):
| McDonnell Center: | 7.4% |
| Huntington Beach: | 5.7% |
Percentage of never married males 15 years old and over:
Percentage of never married females 15 years old and over:
| McDonnell Center: | 22.7% |
| Huntington Beach: | 18.9% |
Percentage of never married females 15 years old and over:
| McDonnell Center: | 13.0% |
| city: | 16.3% |
Percentage of people that speak English not well or not at all:
| McDonnell Center: | 3.8% |
| Huntington Beach: | 4.1% |
Percentage of people born in this state:
Percentage of people born in another U.S. state:
Percentage of native residents but born outside the U.S.:
Percentage of foreign born residents:
| Here: | 61.0% |
| Huntington Beach: | 57.7% |
Percentage of people born in another U.S. state:
| McDonnell Center: | 18.2% |
| Huntington Beach: | 22.8% |
Percentage of native residents but born outside the U.S.:
| Here: | 1.8% |
| city: | 1.5% |
Percentage of foreign born residents:
| Here: | 19.1% |
| Huntington Beach: | 18.0% |
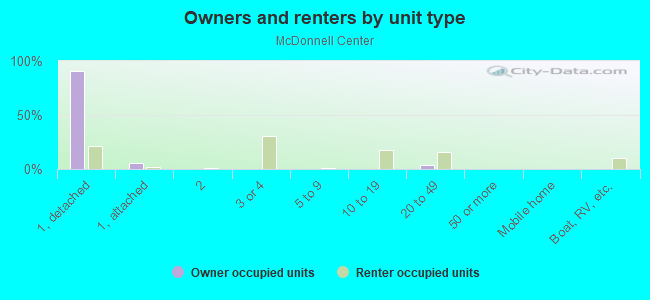
Owner-occupied
Renter-occupied

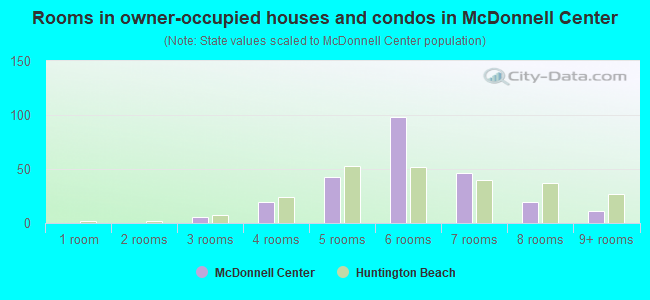
- Rooms in owner-occupied houses and condos in McDonnell Center
- 01 room
- 02 rooms
- 63 rooms
- 194 rooms
- 435 rooms
- 986 rooms
- 467 rooms
- 198 rooms
- 119+ rooms
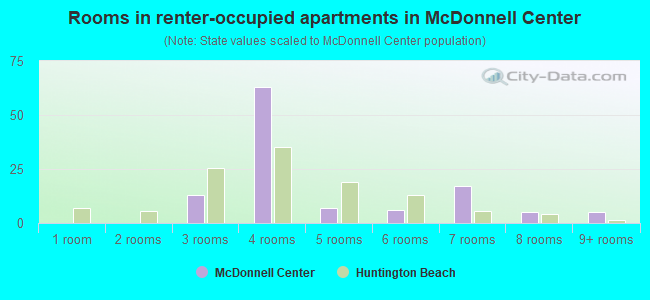
- Rooms in renter-occupied apartments in McDonnell Center
- 01 room
- 02 rooms
- 133 rooms
- 634 rooms
- 75 rooms
- 66 rooms
- 177 rooms
- 58 rooms
- 59+ rooms
Owner-occupied
Renter-occupied
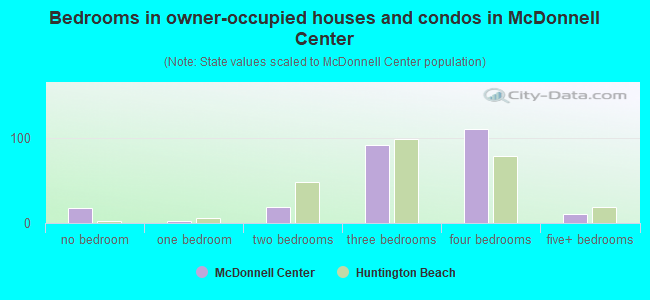
- Bedrooms in owner-occupied houses and condos in McDonnell Center
- 18no bedroom
- 21 bedroom
- 192 bedrooms
- 913 bedrooms
- 1104 bedrooms
- 115+ bedrooms
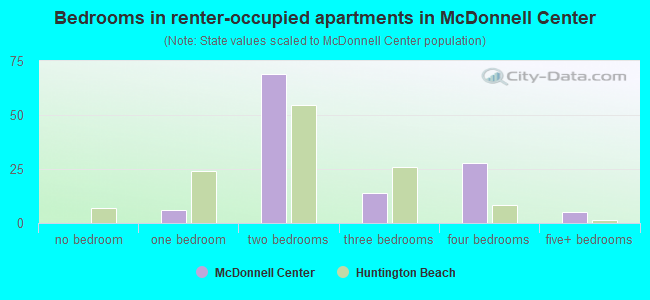
- Bedrooms in renter-occupied apartments in McDonnell Center
- 0no bedroom
- 61 bedroom
- 692 bedrooms
- 143 bedrooms
- 284 bedrooms
- 55+ bedrooms
Average number of cars or other vehicles available in houses/condos:
Average number of cars or other vehicles available in apartments:
| This neighborhood: | |
| Huntington Beach: |
Average number of cars or other vehicles available in apartments:
| Here: | 1.8 |
| city: | 1.8 |
Percentage of units with a mortgage:
| McDonnell Center: | 77.4% |
| Huntington Beach: | 63.1% |
Average estimated value of detached houses in 2022 (73.5% of all units):
| McDonnell Center: | $1,044,622 |
| Huntington Beach: | $1,395,007 |
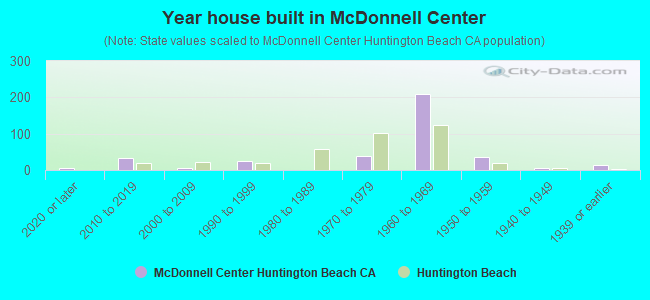
- Year house built in McDonnell Center
- 52020 or later
- 342010 to 2019
- 62000 to 2009
- 251990 to 1999
- 11980 to 1989
- 391970 to 1979
- 2091960 to 1969
- 371950 to 1959
- 61940 to 1949
- 131939 or earlier
City-data.com crime index for city in 2020 (higher means more crime):
| City: | 172.8 |
| U.S. average: | 219.5 |
Travel time to work (commute)
![Travel time to work (commute)]()
- 18Less than 5 minutes
- 275 to 9 minutes
- 6010 to 14 minutes
- 10015 to 19 minutes
- 2520 to 24 minutes
- 5125 to 29 minutes
- 8230 to 34 minutes
- 1535 to 39 minutes
- 5740 to 44 minutes
- 15045 to 59 minutes
- 2460 to 89 minutes
- 1290 or more minutes

Means of transportation to work
![Means of transportation to work]()
- 71.0%447Drove a car alone
- 17.3%109Carpooled
- 0.2%1Bus
- 1.1%7Motorcycle
- 4.5%28Walked
- 1.1%7Other means
- 6.8%43Worked at home

Time leaving home to go to work
![Time leaving home to go to work]()
- 1412:00 a.m. to 4:59 a.m.
- 295:00 a.m. to 5:29 a.m.
- 225:30 a.m. to 5:59 a.m.
- 496:00 a.m. to 6:29 a.m.
- 826:30 a.m. to 6:59 a.m.
- 887:00 a.m. to 7:29 a.m.
- 507:30 a.m. to 7:59 a.m.
- 588:00 a.m. to 8:29 a.m.
- 328:30 a.m. to 8:59 a.m.
- 229:00 a.m. to 9:59 a.m.
- 3610:00 a.m. to 10:59 a.m.
- 911:00 a.m. to 11:59 a.m.
- 1112:00 p.m. to 3:59 p.m.
- 514:00 p.m. to 11:59 p.m.

Occupations of males:
- Percentage of males in management occupations (except farmers):
Here: 7.9% city: 17.0%
- Percentage of males in business and financial operations occupations:
Here: 14.8% city: 8.0%
- Percentage of males in computer and mathematical occupations:
Here: 13.0% city: 4.1%
- Percentage of males in architecture and engineering occupations:
Here: 13.8% city: 5.2%
- Percentage of males in community and social services occupations:
Here: 6.6% city: 1.5%
- Percentage of males in education, training, and library occupations:
Here: 4.9% city: 4.0%
- Percentage of males in healthcare practitioners and technical occupations:
Here: 10.8% city: 4.2%
- Percentage of males in sales and office occupations:
Here: 9.9% city: 17.7%
- Percentage of males in construction, extraction, and maintenance occupations:
Here: 6.0% city: 5.8%
- Percentage of males in production occupations:
Here: 10.3% city: 5.1%
- Percentage of males in material moving occupations:
Here: 2.1% city: 2.5%
Occupations of females:
- Percentage of females in management occupations (except farmers):
Here: 2.3% city: 12.6%
- Percentage of females in business and financial operations occupations:
Here: 4.1% city: 8.8%
- Percentage of females in computer and mathematical occupations:
Here: 5.6% city: 1.5%
- Percentage of females in life, physical, and social science occupations:
Here: 2.5% city: 1.1%
- Percentage of females in community and social services occupations:
Here: 3.4% city: 3.1%
- Percentage of females in legal occupations:
Here: 7.0% city: 2.5%
- Percentage of females in education, training, and library occupations:
Here: 1.5% city: 8.8%
- Percentage of females in arts, design, entertainment, sports, and media occupations:
Here: 5.9% city: 2.6%
- Percentage of females in healthcare practitioners and technical occupations:
Here: 23.6% city: 10.1%
- Percentage of females in service occupations:
Here: 17.5% city: 16.4%
- Percentage of females in sales and office occupations:
Here: 22.1% city: 25.5%
- Percentage of females in production occupations:
Here: 2.6% city: 2.3%
- Percentage of females in transportation occupations:
Here: 1.8% city: 0.5%
- Percentage of females in material moving occupations:
Here: 6.2% city: 2.3%
Percentage of people 16-64 in Armed Forces:
| McDonnell Center: | 0.0% |
| Huntington Beach: | 0.2% |
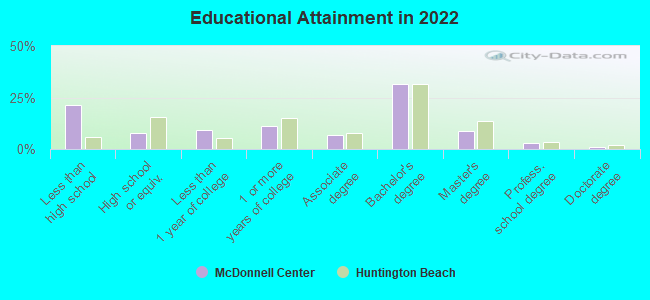
Education in this neighborhood (subdivision or community):
- Percentage of people 3 years and older in K-12 schools:
McDonnell Center: 13.2% Huntington Beach: 13.1%
- Percentage of people 3 years and older in undergraduate colleges:
McDonnell Center: 7.2% Huntington Beach: 5.8%
- Percentage of people 3 years and older in grad. or professional schools:
McDonnell Center: 0.7% Huntington Beach: 1.2%
- Percentage of students K-12 enrolled in private schools:
McDonnell Center: 40.0% Huntington Beach: 18.8%
Percentage of population below poverty level:
| McDonnell Center: | 5.1% |
| Huntington Beach: | 7.0% |
Median year renter moved in (as recorded in 2022):
| McDonnell Center: | 2015 |
| Huntington Beach: | 2019 |
Percentage of married-couple families with both working:
| McDonnell Center: | 90.9% |
| Huntington Beach: | 65.3% |
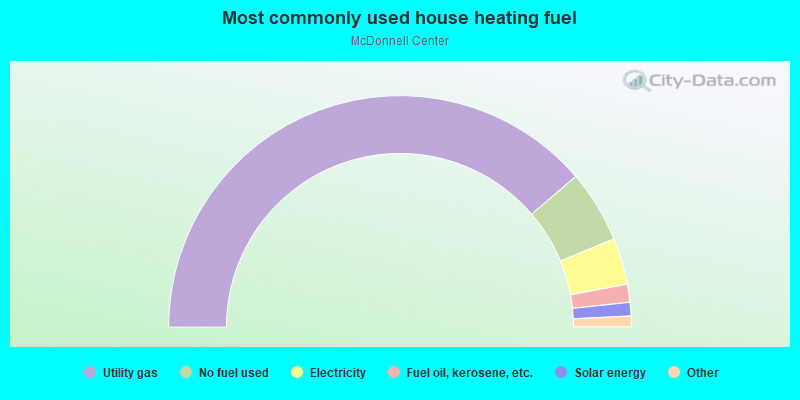
- 77.4%Utility gas
- 10.1%No fuel used
- 6.5%Electricity
- 2.5%Fuel oil, kerosene, etc.
- 1.9%Solar energy
- 0.9%Bottled, tank, or LP gas
- 0.6%Wood
Roads and streets:
Skylab Rd
Length: 1.19 miles
Direction: E-W
Address range: 5018 to 5899
Direction: E-W
Address range: 5018 to 5899
Rancho Rd
Length: 0.59 miles
Directions: E-W, SE-NW, SW-NE
Address range: 5200 to 5299
Directions: E-W, SE-NW, SW-NE
Address range: 5200 to 5299
Astronautics Dr
Length: 0.44 miles
Direction: N-S
Direction: N-S
Able Ln
Length: 0.44 miles
Direction: N-S
Address range: 14600 to 14989
Direction: N-S
Address range: 14600 to 14989
Springdale St
Length: 0.41 miles
Direction: N-S
Address range: 14626 to 14987
Direction: N-S
Address range: 14626 to 14987
Sahara Ln
Length: 0.05 miles
Direction: N-S
Direction: N-S
Railroad features:
U S Navy RR R W
Length: 0.76 miles
Directions: E-W, SE-NW
Directions: E-W, SE-NW