Mayglen (Little Rock) neighborhood in San Jose, California (CA), 95133 detailed profile
Settings
X

Business Search - 14 Million verified businesses
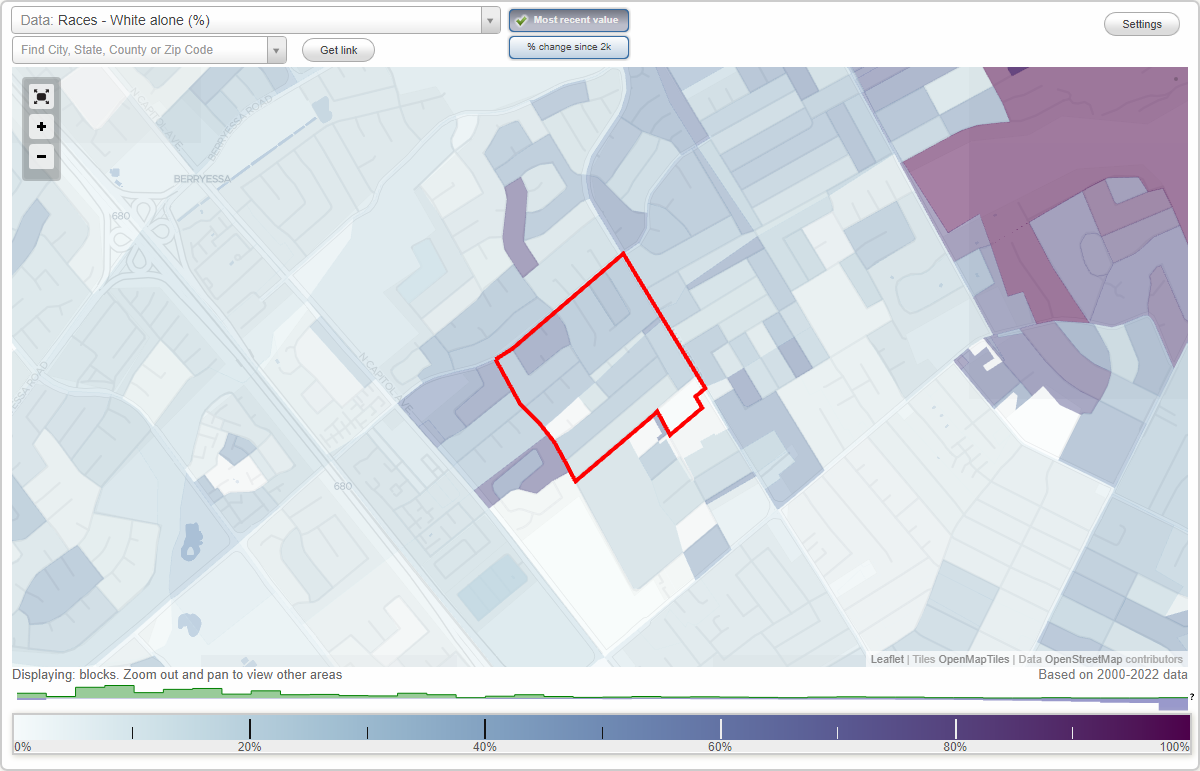
Area: 0.136 square miles
Population: 824
Population density:
| Mayglen (Little Rock): | 6,055 people per square mile |
| San Jose: | 5,554 people per square mile |

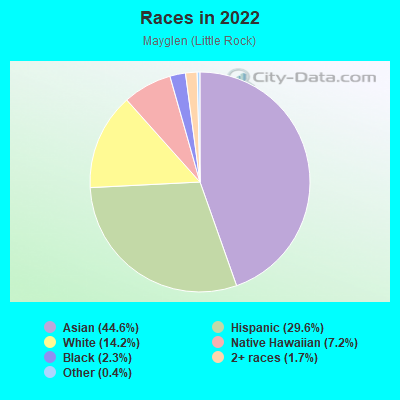
- 37044.6%Asian
- 24629.6%Hispanic or Latino
- 11814.2%White
- 607.2%Native Hawaiian and Other
Pacific Islander - 192.3%Black
- 141.7%Two or more races
- 30.4%Some other race
Median household income in 2022:
| Mayglen (Little Rock): | $120,220 |
| San Jose: | $133,835 |
Distribution of median household income
![Distribution of median household income]()
- 13Less than $10,000
- 93$10,000 to $19,999
- 30$20,000 to $29,999
- 9$30,000 to $39,999
- 5$40,000 to $49,999
- 5$50,000 to $59,999
- 11$60,000 to $74,999
- 14$75,000 to $99,999
- 32$100,000 to $124,999
- 36$125,000 to $149,999
- 32$150,000 to $199,999
- 55$200,000 or more

Distribution of owner-occupied house/condo value
![Distribution of owner-occupied house/condo value]()
- 5Less than $50,000
- 3$150,000 to $199,999
- 5$200,000 to $249,999
- 9$250,000 to $299,999
- 34$400,000 to $499,999
- 7$500,000 to $749,999
- 49$750,000 to $999,999
- 105$1,000,000 or more

Distribution of rent paid by renters
![Distribution of rent paid by renters]()
- 34$200 to $299
- 15$1,000 to $1,249
- 16$1,250 to $1,499
- 10$1,500 to $1,999
- 171$2,000 or more

Median rent in 2022:
| Mayglen (Little Rock): | $3,171 |
| San Jose: | $2,001 |
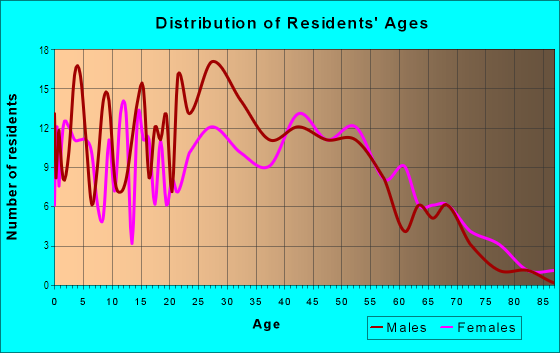
| Males: | 451 |
| Females: | 373 |
Males:
| This neighborhood: | 34.9 years |
| Whole city: | 37.6 years |
| This neighborhood: | 43.1 years |
| Whole city: | 39.1 years |
Average household size:
| Mayglen (Little Rock): | 4.1 people |
| San Jose: | 2.9 people |
Percentage of family households:
| Mayglen (Little Rock): | 45.9% |
| San Jose: | 49.9% |
| Here: | 54.1% |
| San Jose: | 53.0% |
Percentage of married-couple families with children (among all households):
| Mayglen (Little Rock): | 23.9% |
| San Jose: | 25.8% |
Percentage of single-mother households (among all households):
| Mayglen (Little Rock): | 4.6% |
| San Jose: | 5.2% |
Percentage of never married males 15 years old and over:
Percentage of never married females 15 years old and over:
| Mayglen (Little Rock): | 25.8% |
| San Jose: | 20.9% |
Percentage of never married females 15 years old and over:
| Mayglen (Little Rock): | 18.5% |
| city: | 16.7% |
Percentage of people that speak English not well or not at all:
| Mayglen (Little Rock): | 12.1% |
| San Jose: | 11.4% |
Percentage of people born in this state:
Percentage of people born in another U.S. state:
Percentage of native residents but born outside the U.S.:
Percentage of foreign born residents:
| Here: | 34.8% |
| San Jose: | 46.1% |
Percentage of people born in another U.S. state:
| Mayglen (Little Rock): | 7.9% |
| San Jose: | 10.4% |
Percentage of native residents but born outside the U.S.:
| Here: | 3.3% |
| city: | 1.7% |
Percentage of foreign born residents:
| Here: | 54.0% |
| San Jose: | 41.8% |
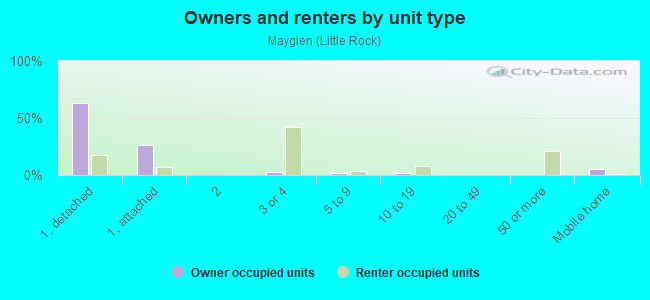
Owner-occupied
Renter-occupied

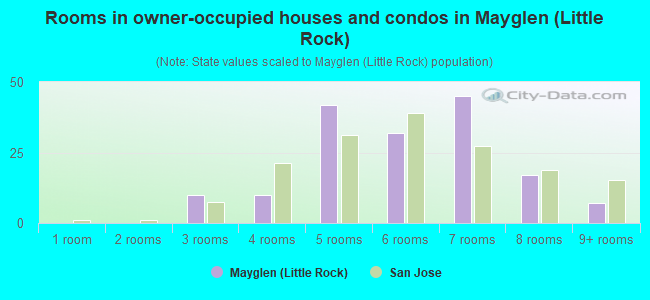
- Rooms in owner-occupied houses and condos in Mayglen <
> - 01 room
- 02 rooms
- 103 rooms
- 104 rooms
- 425 rooms
- 326 rooms
- 457 rooms
- 178 rooms
- 79+ rooms
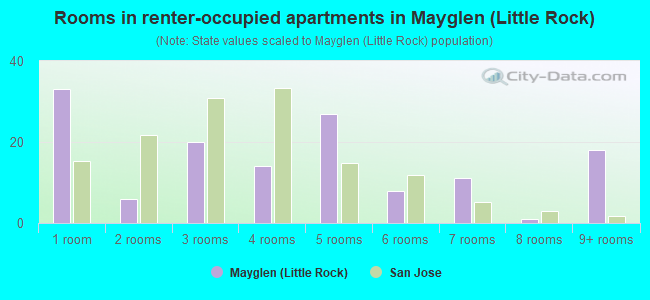
- Rooms in renter-occupied apartments in Mayglen <
> - 331 room
- 62 rooms
- 203 rooms
- 144 rooms
- 275 rooms
- 86 rooms
- 117 rooms
- 18 rooms
- 189+ rooms
Owner-occupied
Renter-occupied
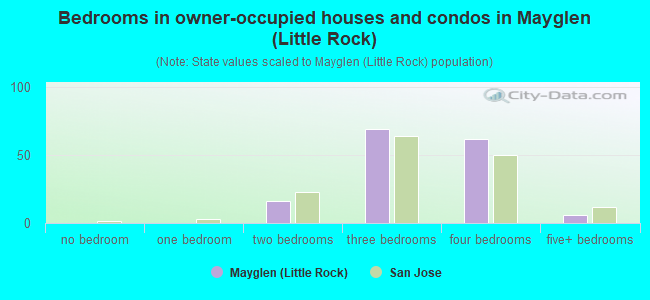
- Bedrooms in owner-occupied houses and condos in Mayglen <
> - 0no bedroom
- 01 bedroom
- 162 bedrooms
- 693 bedrooms
- 624 bedrooms
- 65+ bedrooms
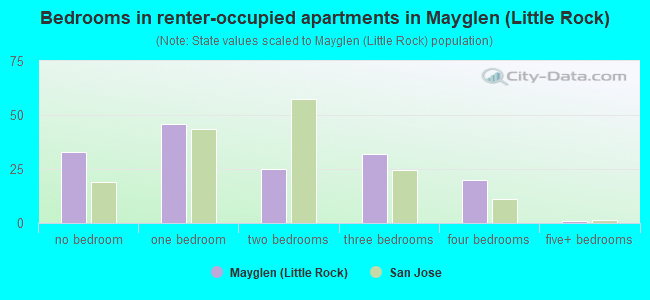
- Bedrooms in renter-occupied apartments in Mayglen <
> - 33no bedroom
- 461 bedroom
- 252 bedrooms
- 323 bedrooms
- 204 bedrooms
- 15+ bedrooms
Average number of cars or other vehicles available in houses/condos:
Average number of cars or other vehicles available in apartments:
| This neighborhood: | 2.4 |
| San Jose: | 2.3 |
Average number of cars or other vehicles available in apartments:
| Here: | 2.4 |
| city: | 1.6 |
Percentage of units with a mortgage:
| Mayglen (Little Rock): | 60.1% |
| San Jose: | 66.9% |
Average estimated value of detached houses in 2022 (84.8% of all units):
| Mayglen (Little Rock): | $980,486 |
| San Jose: | $1,532,815 |
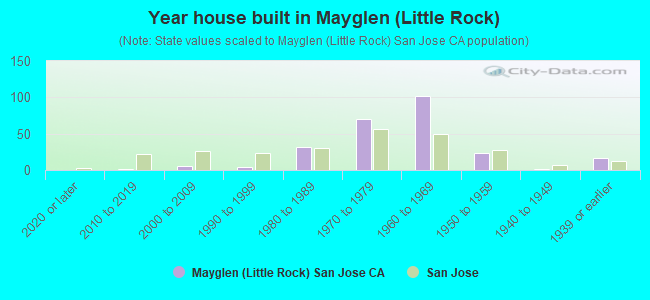
- Year house built in Mayglen <
> - 02020 or later
- 12010 to 2019
- 62000 to 2009
- 41990 to 1999
- 321980 to 1989
- 701970 to 1979
- 1021960 to 1969
- 241950 to 1959
- 21940 to 1949
- 161939 or earlier
City-data.com crime index for city in 2020 (higher means more crime):
| City: | 268.4 |
| U.S. average: | 219.5 |
Travel time to work (commute)
![Travel time to work (commute)]()
- 2Less than 5 minutes
- 45 to 9 minutes
- 2110 to 14 minutes
- 4215 to 19 minutes
- 6320 to 24 minutes
- 2125 to 29 minutes
- 10230 to 34 minutes
- 235 to 39 minutes
- 840 to 44 minutes
- 2645 to 59 minutes
- 660 to 89 minutes
- 190 or more minutes

Means of transportation to work
![Means of transportation to work]()
- 61.7%235Drove a car alone
- 19.9%76Carpooled
- 21.3%81Bus
- 2.1%8Subway or elevated rail
- 0.3%1Long-distance train or commuter rail
- 1.6%6Light rail, streetcar or trolley
- 0.5%2Taxi
- 7.3%28Walked
- 1.0%4Other means
- 13.1%50Worked at home

Time leaving home to go to work
![Time leaving home to go to work]()
- 1812:00 a.m. to 4:59 a.m.
- 65:00 a.m. to 5:29 a.m.
- 125:30 a.m. to 5:59 a.m.
- 236:00 a.m. to 6:29 a.m.
- 246:30 a.m. to 6:59 a.m.
- 487:00 a.m. to 7:29 a.m.
- 197:30 a.m. to 7:59 a.m.
- 378:00 a.m. to 8:29 a.m.
- 228:30 a.m. to 8:59 a.m.
- 329:00 a.m. to 9:59 a.m.
- 1010:00 a.m. to 10:59 a.m.
- 411:00 a.m. to 11:59 a.m.
- 3612:00 p.m. to 3:59 p.m.
- 54:00 p.m. to 11:59 p.m.

Occupations of males:
- Percentage of males in management occupations (except farmers):
Here: 7.3% city: 13.0%
- Percentage of males in business and financial operations occupations:
Here: 1.4% city: 4.6%
- Percentage of males in computer and mathematical occupations:
Here: 11.1% city: 13.6%
- Percentage of males in architecture and engineering occupations:
Here: 18.3% city: 10.2%
- Percentage of males in education, training, and library occupations:
Here: 1.1% city: 2.8%
- Percentage of males in arts, design, entertainment, sports, and media occupations:
Here: 2.4% city: 1.8%
- Percentage of males in healthcare practitioners and technical occupations:
Here: 2.7% city: 2.0%
- Percentage of males in service occupations:
Here: 17.5% city: 12.7%
- Percentage of males in sales and office occupations:
Here: 7.0% city: 12.8%
- Percentage of males in construction, extraction, and maintenance occupations:
Here: 14.2% city: 7.8%
- Percentage of males in production occupations:
Here: 6.4% city: 5.5%
- Percentage of males in transportation occupations:
Here: 3.0% city: 3.6%
- Percentage of males in material moving occupations:
Here: 1.8% city: 3.1%
Occupations of females:
- Percentage of females in management occupations (except farmers):
Here: 4.6% city: 11.0%
- Percentage of females in business and financial operations occupations:
Here: 8.7% city: 8.6%
- Percentage of females in computer and mathematical occupations:
Here: 7.9% city: 5.4%
- Percentage of females in life, physical, and social science occupations:
Here: 1.6% city: 1.7%
- Percentage of females in community and social services occupations:
Here: 6.2% city: 1.8%
- Percentage of females in education, training, and library occupations:
Here: 4.0% city: 8.1%
- Percentage of females in healthcare practitioners and technical occupations:
Here: 2.2% city: 6.8%
- Percentage of females in service occupations:
Here: 39.1% city: 21.7%
- Percentage of females in sales and office occupations:
Here: 14.7% city: 22.0%
- Percentage of females in production occupations:
Here: 8.3% city: 4.0%
- Percentage of females in material moving occupations:
Here: 1.7% city: 1.5%
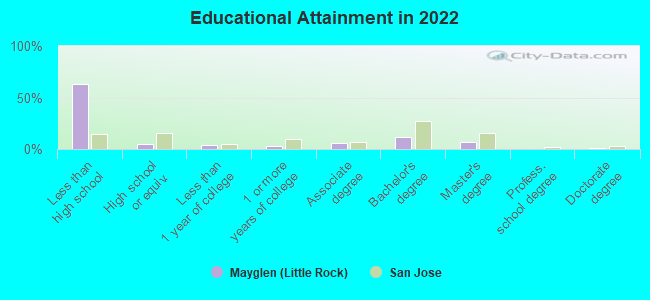
Education in this neighborhood (subdivision or community):
- Percentage of people 3 years and older in K-12 schools:
Mayglen (Little Rock): 17.3% San Jose: 16.1%
- Percentage of people 3 years and older in undergraduate colleges:
Mayglen (Little Rock): 6.8% San Jose: 6.5%
- Percentage of people 3 years and older in grad. or professional schools:
Mayglen (Little Rock): 1.0% San Jose: 2.0%
- Percentage of students K-12 enrolled in private schools:
Mayglen (Little Rock): 69.1% San Jose: 14.9%
Percentage of population below poverty level:
| Mayglen (Little Rock): | 7.7% |
| San Jose: | 9.0% |
Median year owner moved in (as recorded in 2022):
Median year renter moved in (as recorded in 2022):
| Mayglen (Little Rock): | 2001 |
| San Jose: | 2008 |
Median year renter moved in (as recorded in 2022):
| Mayglen (Little Rock): | 2013 |
| San Jose: | 2020 |
Percentage of married-couple families with both working:
| Mayglen (Little Rock): | 57.0% |
| San Jose: | 72.5% |
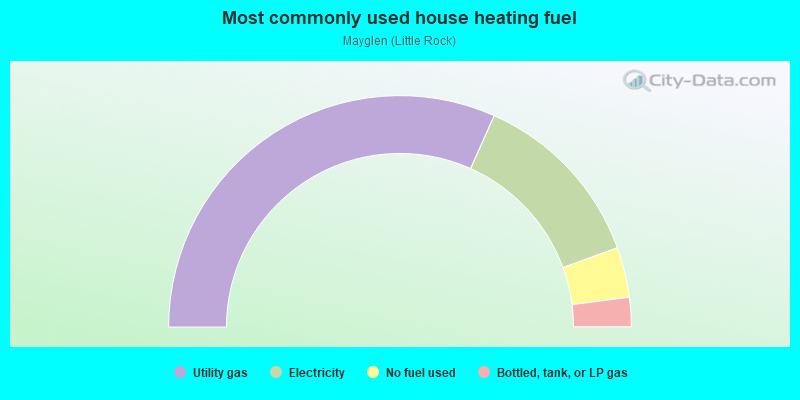
- 63.3%Utility gas
- 25.5%Electricity
- 7.0%No fuel used
- 4.1%Bottled, tank, or LP gas
Roads and streets:
Little Rock Dr
Length: 0.30 miles
Direction: SW-NE
Address range: 2890 to 3099
Direction: SW-NE
Address range: 2890 to 3099
N White Rd
Length: 0.29 miles
Direction: SE-NW
Address range: 484 to 649
Direction: SE-NW
Address range: 484 to 649
Nashville Dr
Length: 0.25 miles
Direction: SW-NE
Address range: 2900 to 3099
Direction: SW-NE
Address range: 2900 to 3099
Patt Ave
Length: 0.25 miles
Direction: SW-NE
Address range: 2848 to 3999
Direction: SW-NE
Address range: 2848 to 3999
Jim Dr
Length: 0.18 miles
Direction: SE-NW
Address range: 500 to 699
Direction: SE-NW
Address range: 500 to 699
Salt Lake Dr
Length: 0.17 miles
Direction: SE-NW
Address range: 600 to 671
Direction: SE-NW
Address range: 600 to 671
Baton Rouge Dr
Length: 0.13 miles
Direction: SW-NE
Address range: 2805 to 2899
Direction: SW-NE
Address range: 2805 to 2899
Mayglen Way
Length: 0.09 miles
Directions: E-W, SW-NE
Address range: 2900 to 2999
Directions: E-W, SW-NE
Address range: 2900 to 2999
Baton Rouge Ct
Length: 0.04 miles
Direction: SE-NW
Address range: 2800 to 2899
Direction: SE-NW
Address range: 2800 to 2899
Jefferson Ct
Length: 0.04 miles
Direction: SE-NW
Address range: 600 to 699
Direction: SE-NW
Address range: 600 to 699
Little Rock Ct
Length: 0.03 miles
Direction: SE-NW
Address range: 2800 to 2999
Direction: SE-NW
Address range: 2800 to 2999
Detroit Ct
Length: 0.03 miles
Direction: SE-NW
Address range: 600 to 699
Direction: SE-NW
Address range: 600 to 699
Mayglen Ct
Length: 0.02 miles
Direction: SE-NW
Address range: 2800 to 2999
Direction: SE-NW
Address range: 2800 to 2999
Royal Glen Ct
Length: 0.02 miles
Direction: SW-NE
Address range: 600 to 699
Direction: SW-NE
Address range: 600 to 699