Masten Park neighborhood in Buffalo, New York (NY), 14208, 14209 detailed profile
Settings
X


Business Search - 14 Million verified businesses
Area: 0.492 square miles
Population: 6,522
Population density:
| Masten Park: | 13,263 people per square mile |
| Buffalo: | 6,808 people per square mile |

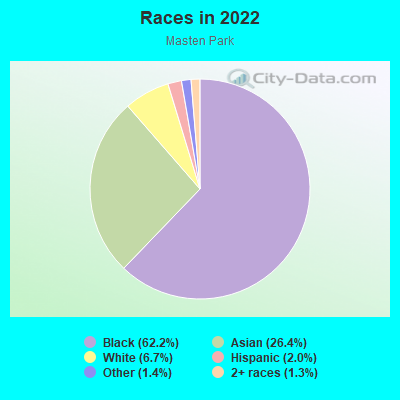
- 4,40562.2%Black
- 1,87426.4%Asian
- 4726.7%White
- 1402.0%Hispanic or Latino
- 1011.4%Some other race
- 941.3%Two or more races
Median household income in 2022:
| Masten Park: | $24,451 |
| Buffalo: | $48,904 |
Distribution of median household income
![Distribution of median household income]()
- 71Less than $10,000
- 703$10,000 to $19,999
- 1,633$20,000 to $29,999
- 95$30,000 to $39,999
- 368$40,000 to $49,999
- 122$50,000 to $59,999
- 86$60,000 to $74,999
- 250$75,000 to $99,999
- 360$100,000 to $124,999
- 18$125,000 to $149,999
- 13$150,000 to $199,999
- 13$200,000 or more

Distribution of owner-occupied house/condo value
![Distribution of owner-occupied house/condo value]()
- 909Less than $50,000
- 669$50,000 to $99,999
- 468$100,000 to $149,999
- 16$150,000 to $199,999
- 28$200,000 to $249,999
- 31$250,000 to $299,999
- 18$1,000,000 or more

Distribution of rent paid by renters
![Distribution of rent paid by renters]()
- 188$100 to $199
- 71$200 to $299
- 487$300 to $399
- 732$400 to $499
- 299$500 to $599
- 57$600 to $699
- 46$700 to $799
- 137$800 to $899
- 42$900 to $999
- 8$1,000 to $1,249

Median rent in 2022:
| Masten Park: | $410 |
| Buffalo: | $797 |
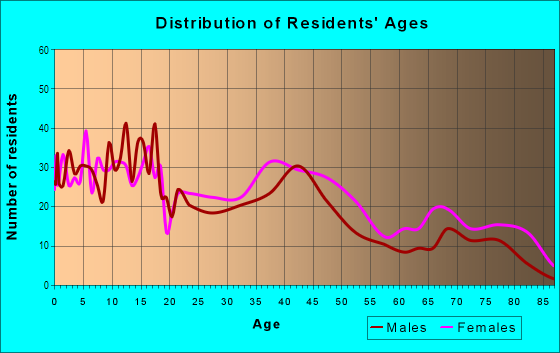
| Males: | 2,921 |
| Females: | 3,600 |
Males:
| This neighborhood: | 27.1 years |
| Whole city: | 34.6 years |
| This neighborhood: | 65.1 years |
| Whole city: | 35.0 years |
Average household size:
| Masten Park: | 1.9 people |
| Buffalo: | 2.2 people |
Percentage of family households:
| Masten Park: | 21.6% |
| Buffalo: | 35.8% |
| Here: | 11.5% |
| Buffalo: | 24.5% |
Percentage of married-couple families with children (among all households):
| Masten Park: | 53.2% |
| Buffalo: | 22.3% |
Percentage of single-mother households (among all households):
| Masten Park: | 19.8% |
| Buffalo: | 17.8% |
Percentage of never married males 15 years old and over:
Percentage of never married females 15 years old and over:
| Masten Park: | 24.6% |
| Buffalo: | 25.6% |
Percentage of never married females 15 years old and over:
| Masten Park: | 18.4% |
| city: | 26.3% |
Percentage of people born in this state:
Percentage of people born in another U.S. state:
Percentage of native residents but born outside the U.S.:
Percentage of foreign born residents:
| Here: | 75.6% |
| Buffalo: | 75.1% |
Percentage of people born in another U.S. state:
| Masten Park: | 13.8% |
| Buffalo: | 10.9% |
Percentage of native residents but born outside the U.S.:
| Here: | 2.2% |
| city: | 3.9% |
Percentage of foreign born residents:
| Here: | 8.4% |
| Buffalo: | 10.0% |
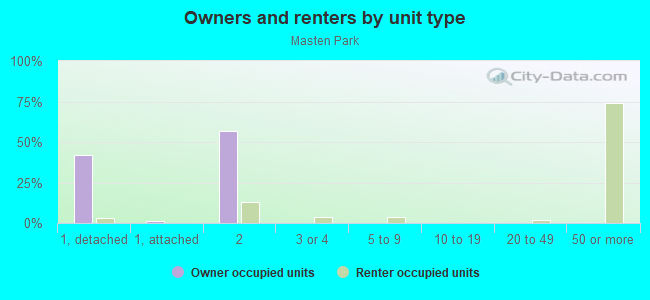
Owner-occupied
Renter-occupied

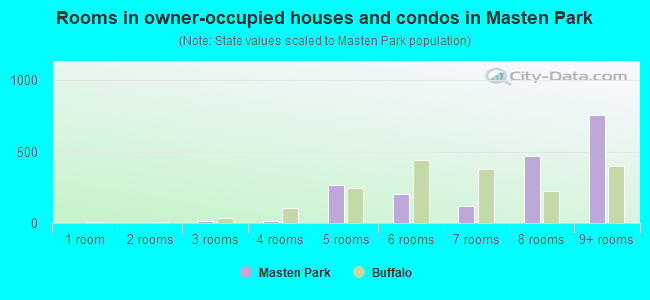
- Rooms in owner-occupied houses and condos in Masten Park
- 01 room
- 02 rooms
- 163 rooms
- 154 rooms
- 2655 rooms
- 2036 rooms
- 1177 rooms
- 4688 rooms
- 7579+ rooms
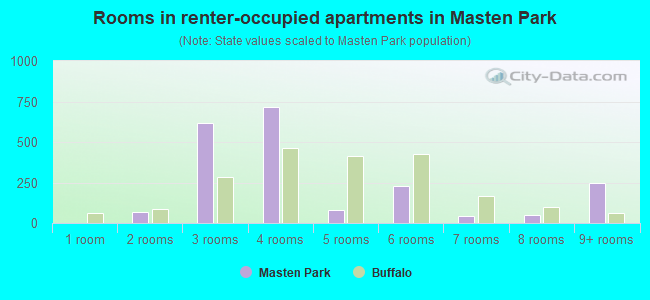
- Rooms in renter-occupied apartments in Masten Park
- 01 room
- 702 rooms
- 6173 rooms
- 7184 rooms
- 795 rooms
- 2276 rooms
- 417 rooms
- 518 rooms
- 2499+ rooms
Owner-occupied
Renter-occupied
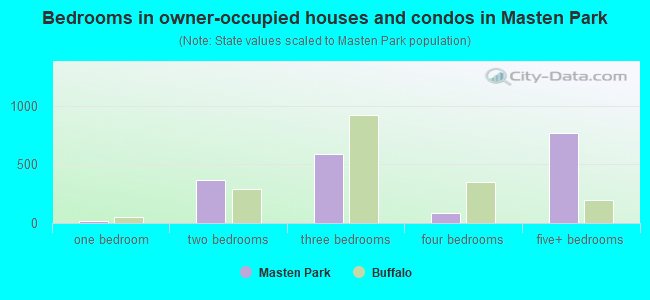
- Bedrooms in owner-occupied houses and condos in Masten Park
- 0no bedroom
- 151 bedroom
- 3672 bedrooms
- 5933 bedrooms
- 854 bedrooms
- 7655+ bedrooms
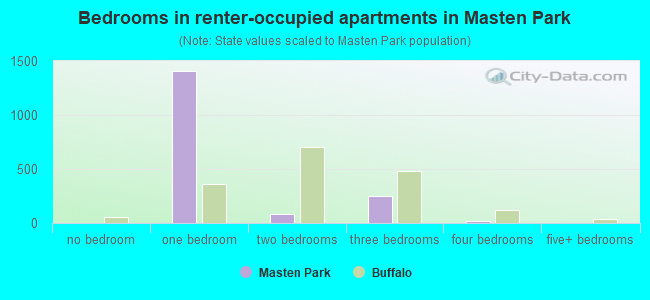
- Bedrooms in renter-occupied apartments in Masten Park
- 0no bedroom
- 1,4061 bedroom
- 862 bedrooms
- 2493 bedrooms
- 224 bedrooms
- 05+ bedrooms
Average number of cars or other vehicles available in houses/condos:
Average number of cars or other vehicles available in apartments:
| This neighborhood: | 1.1 |
| Buffalo: | 1.5 |
Average number of cars or other vehicles available in apartments:
| Here: | 0.4 |
| city: | 0.9 |
Percentage of units with a mortgage:
| Masten Park: | 6.5% |
| Buffalo: | 48.3% |
Housing prices:
- Average estimated value of detached houses in 2022 (18.4% of all units):
Masten Park: $62,532 New York: $476,719
- Average estimated value of housing units in 2-unit structures in 2022 (44.0% of all units):
This neighborhood: $69,802 New York: $713,077
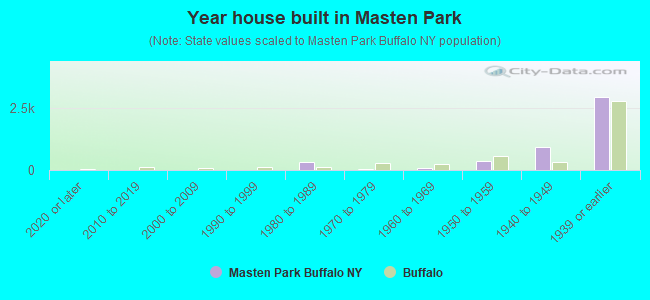
- Year house built in Masten Park
- 02020 or later
- 02010 to 2019
- 02000 to 2009
- 01990 to 1999
- 3351980 to 1989
- 431970 to 1979
- 771960 to 1969
- 3451950 to 1959
- 9291940 to 1949
- 2,9441939 or earlier
City-data.com crime index for city in 2020 (higher means more crime):
| City: | 441.3 |
| U.S. average: | 219.5 |
Travel time to work (commute)
![Travel time to work (commute)]()
- 36Less than 5 minutes
- 2475 to 9 minutes
- 16710 to 14 minutes
- 14115 to 19 minutes
- 27320 to 24 minutes
- 10130 to 34 minutes
- 6545 to 59 minutes
- 14660 to 89 minutes

Means of transportation to work
![Means of transportation to work]()
- 54.0%843Drove a car alone
- 7.5%117Carpooled
- 9.0%140Bus
- 1.0%15Taxi
- 1.0%16Bicycle
- 29.4%460Walked
- 1.3%21Worked at home

Time leaving home to go to work
![Time leaving home to go to work]()
- 465:00 a.m. to 5:29 a.m.
- 705:30 a.m. to 5:59 a.m.
- 316:00 a.m. to 6:29 a.m.
- 1016:30 a.m. to 6:59 a.m.
- 1757:00 a.m. to 7:29 a.m.
- 2037:30 a.m. to 7:59 a.m.
- 848:00 a.m. to 8:29 a.m.
- 798:30 a.m. to 8:59 a.m.
- 529:00 a.m. to 9:59 a.m.
- 1310:00 a.m. to 10:59 a.m.
- 5411:00 a.m. to 11:59 a.m.
- 5212:00 p.m. to 3:59 p.m.
- 2144:00 p.m. to 11:59 p.m.

Occupations of males:
- Percentage of males in management occupations (except farmers):
Here: 4.7% city: 8.7%
- Percentage of males in legal occupations:
Here: 1.7% city: 1.8%
- Percentage of males in education, training, and library occupations:
Here: 13.9% city: 4.7%
- Percentage of males in healthcare practitioners and technical occupations:
Here: 1.2% city: 2.6%
- Percentage of males in service occupations:
Here: 11.1% city: 21.5%
- Percentage of males in sales and office occupations:
Here: 64.8% city: 15.9%
- Percentage of males in construction, extraction, and maintenance occupations:
Here: 2.9% city: 5.6%
- Percentage of males in production occupations:
Here: 10.2% city: 7.3%
- Percentage of males in transportation occupations:
Here: 1.7% city: 5.1%
- Percentage of males in material moving occupations:
Here: 2.0% city: 7.6%
Occupations of females:
- Percentage of females in management occupations (except farmers):
Here: 35.9% city: 7.4%
- Percentage of females in education, training, and library occupations:
Here: 12.0% city: 10.9%
- Percentage of females in healthcare practitioners and technical occupations:
Here: 3.0% city: 8.0%
- Percentage of females in service occupations:
Here: 35.9% city: 26.7%
- Percentage of females in sales and office occupations:
Here: 16.3% city: 25.5%
- Percentage of females in production occupations:
Here: 3.4% city: 3.4%
- Percentage of females in material moving occupations:
Here: 1.4% city: 2.0%
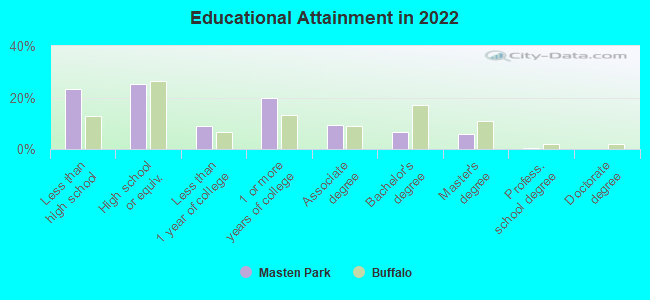
Education in this neighborhood (subdivision or community):
- Percentage of people 3 years and older in K-12 schools:
Masten Park: 14.8% Buffalo: 16.7%
- Percentage of people 3 years and older in undergraduate colleges:
Masten Park: 9.2% Buffalo: 6.6%
- Percentage of people 3 years and older in grad. or professional schools:
Masten Park: 0.3% Buffalo: 2.5%
- Percentage of students K-12 enrolled in private schools:
Masten Park: 45.9% Buffalo: 11.8%
Percentage of population below poverty level:
| Masten Park: | 26.6% |
| Buffalo: | 23.6% |
Median year owner moved in (as recorded in 2022):
Median year renter moved in (as recorded in 2022):
| Masten Park: | 1990 |
| Buffalo: | 2008 |
Median year renter moved in (as recorded in 2022):
| Masten Park: | 2004 |
| Buffalo: | 2019 |
Percentage of married-couple families with both working:
| Masten Park: | 41.0% |
| Buffalo: | 64.1% |
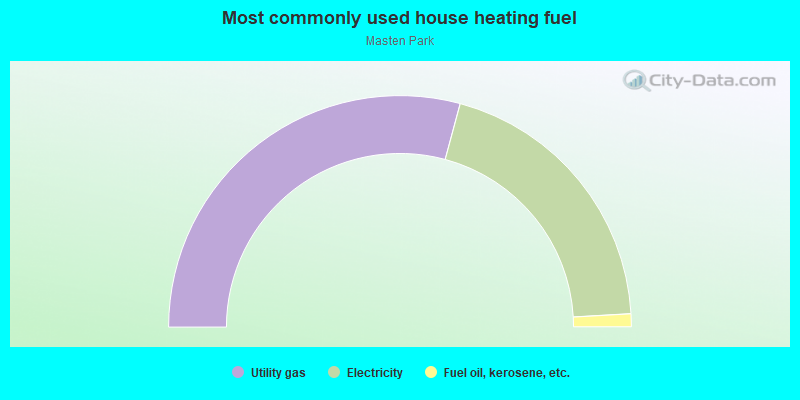
- 58.4%Utility gas
- 39.8%Electricity
- 1.8%Fuel oil, kerosene, etc.
Roads and streets:
Best St
Length: 0.83 miles
Direction: E-W
Address range: 61 to 385
Direction: E-W
Address range: 61 to 385
Dodge St
Length: 0.79 miles
Direction: E-W
Address range: 60 to 369
Direction: E-W
Address range: 60 to 369
Southampton St
Length: 0.77 miles
Direction: E-W
Address range: 1 to 299
Direction: E-W
Address range: 1 to 299
Northampton St
Length: 0.75 miles
Direction: E-W
Address range: 58 to 352
Direction: E-W
Address range: 58 to 352
Riley St
Length: 0.75 miles
Direction: E-W
Address range: 47 to 332
Direction: E-W
Address range: 47 to 332
Harriet Tubman Way (Michigan Ave)
Length: 0.69 miles
Direction: N-S
Address range: 1131 to 1475
Direction: N-S
Address range: 1131 to 1475
Masten Ave
Length: 0.69 miles
Direction: N-S
Address range: 65 to 424
Direction: N-S
Address range: 65 to 424
Woodlawn Ave
Length: 0.66 miles
Direction: E-W
Address range: 30 to 299
Direction: E-W
Address range: 30 to 299
Glenwood Ave
Length: 0.66 miles
Direction: E-W
Address range: 50 to 308
Direction: E-W
Address range: 50 to 308
Eaton St
Length: 0.59 miles
Direction: E-W
Address range: 1 to 299
Direction: E-W
Address range: 1 to 299
Laurel St
Length: 0.58 miles
Direction: E-W
Address range: 66 to 299
Direction: E-W
Address range: 66 to 299
E Utica St
Length: 0.58 miles
Direction: E-W
Address range: 90 to 319
Direction: E-W
Address range: 90 to 319
Edna Pl
Length: 0.42 miles
Direction: E-W
Address range: 1 to 199
Direction: E-W
Address range: 1 to 199
Ellicott St
Length: 0.40 miles
Direction: N-S
Address range: 945 to 1199
Direction: N-S
Address range: 945 to 1199
Purdy St
Length: 0.26 miles
Direction: N-S
Address range: 1 to 149
Direction: N-S
Address range: 1 to 149
Memphis Aly
Length: 0.20 miles
Direction: E-W
Direction: E-W
Emerson Pl
Length: 0.19 miles
Direction: E-W
Address range: 1 to 99
Direction: E-W
Address range: 1 to 99
Welker St
Length: 0.19 miles
Direction: N-S
Address range: 1 to 99
Direction: N-S
Address range: 1 to 99
Jefferson Ave
Length: 0.19 miles
Direction: N-S
Address range: 1062 to 1155
Direction: N-S
Address range: 1062 to 1155
Verplanck St
Length: 0.19 miles
Direction: N-S
Address range: 1 to 99
Direction: N-S
Address range: 1 to 99
Holland Pl
Length: 0.13 miles
Direction: N-S
Address range: 1 to 99
Direction: N-S
Address range: 1 to 99
Waverly St
Length: 0.10 miles
Direction: N-S
Address range: 1 to 52
Direction: N-S
Address range: 1 to 52
Chester St
Length: 0.10 miles
Direction: N-S
Address range: 1 to 54
Direction: N-S
Address range: 1 to 54
Otis Pl
Length: 0.06 miles
Direction: N-S
Address range: 1 to 32
Direction: N-S
Address range: 1 to 32