Lynhaven neighborhood in San Jose, California (CA), 95117 detailed profile
Settings
X


Business Search - 14 Million verified businesses
Area: 0.331 square miles
Population: 1,772
Population density:
| Lynhaven: | 5,349 people per square mile |
| San Jose: | 5,554 people per square mile |

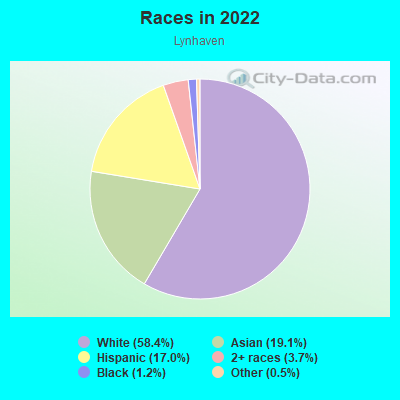
- 1,03958.4%White
- 33919.1%Asian
- 30317.0%Hispanic or Latino
- 663.7%Two or more races
- 221.2%Black
- 90.5%Some other race
Median household income in 2022:
| Lynhaven: | $161,506 |
| San Jose: | $133,835 |
Distribution of median household income
![Distribution of median household income]()
- 95Less than $10,000
- 135$10,000 to $19,999
- 124$20,000 to $29,999
- 47$30,000 to $39,999
- 170$40,000 to $49,999
- 37$50,000 to $59,999
- 47$60,000 to $74,999
- 51$75,000 to $99,999
- 81$100,000 to $124,999
- 40$125,000 to $149,999
- 95$150,000 to $199,999
- 264$200,000 or more

Distribution of owner-occupied house/condo value
![Distribution of owner-occupied house/condo value]()
- 18Less than $50,000
- 8$50,000 to $99,999
- 18$100,000 to $149,999
- 7$500,000 to $749,999
- 62$750,000 to $999,999
- 430$1,000,000 or more

Distribution of rent paid by renters
![Distribution of rent paid by renters]()
- 28Less than $100
- 6$300 to $399
- 10$400 to $499
- 22$500 to $599
- 61$1,250 to $1,499
- 25$1,500 to $1,999
- 413$2,000 or more

Median rent in 2022:
| Lynhaven: | $2,537 |
| San Jose: | $2,001 |
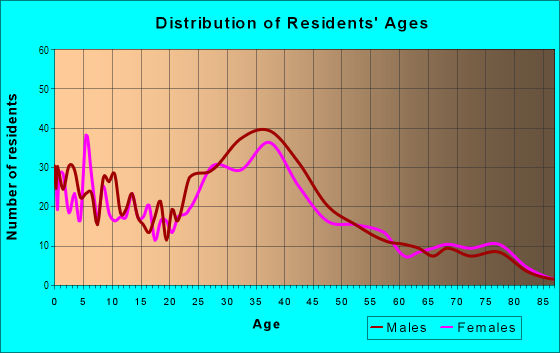
| Males: | 808 |
| Females: | 963 |
Males:
| This neighborhood: | 38.7 years |
| Whole city: | 37.6 years |
| This neighborhood: | 35.5 years |
| Whole city: | 39.1 years |
Average household size:
| Lynhaven: | 8.4 people |
| San Jose: | 2.9 people |
Percentage of family households:
| Lynhaven: | 49.0% |
| San Jose: | 49.9% |
| Here: | 60.2% |
| San Jose: | 53.0% |
Percentage of married-couple families with children (among all households):
| Lynhaven: | 34.8% |
| San Jose: | 25.8% |
Percentage of single-mother households (among all households):
| Lynhaven: | 2.8% |
| San Jose: | 5.2% |
Percentage of never married males 15 years old and over:
Percentage of never married females 15 years old and over:
| Lynhaven: | 13.7% |
| San Jose: | 20.9% |
Percentage of never married females 15 years old and over:
| Lynhaven: | 16.2% |
| city: | 16.7% |
Percentage of people that speak English not well or not at all:
| Lynhaven: | 6.8% |
| San Jose: | 11.4% |
Percentage of people born in this state:
Percentage of people born in another U.S. state:
Percentage of native residents but born outside the U.S.:
Percentage of foreign born residents:
| Here: | 50.9% |
| San Jose: | 46.1% |
Percentage of people born in another U.S. state:
| Lynhaven: | 16.1% |
| San Jose: | 10.4% |
Percentage of native residents but born outside the U.S.:
| Here: | 1.4% |
| city: | 1.7% |
Percentage of foreign born residents:
| Here: | 31.6% |
| San Jose: | 41.8% |
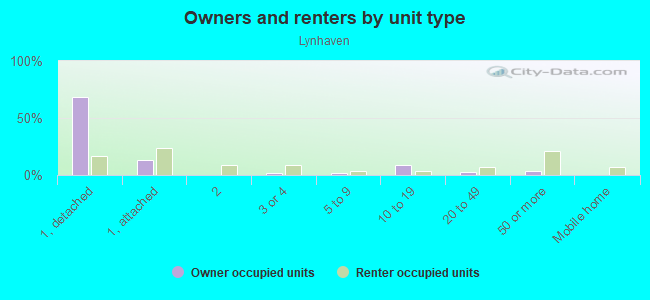
Owner-occupied
Renter-occupied

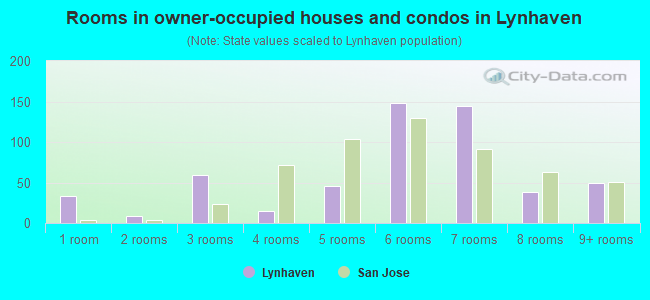
- Rooms in owner-occupied houses and condos in Lynhaven
- 331 room
- 92 rooms
- 593 rooms
- 154 rooms
- 465 rooms
- 1486 rooms
- 1457 rooms
- 388 rooms
- 499+ rooms
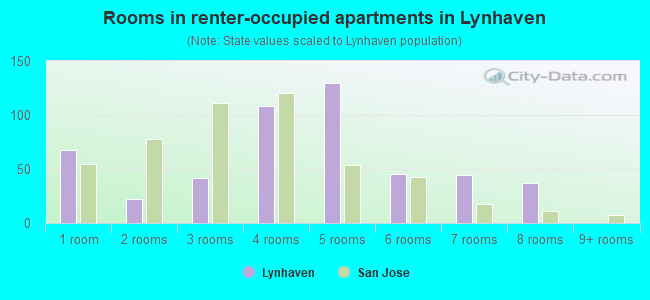
- Rooms in renter-occupied apartments in Lynhaven
- 681 room
- 222 rooms
- 423 rooms
- 1084 rooms
- 1305 rooms
- 456 rooms
- 447 rooms
- 378 rooms
- 09+ rooms
Owner-occupied
Renter-occupied
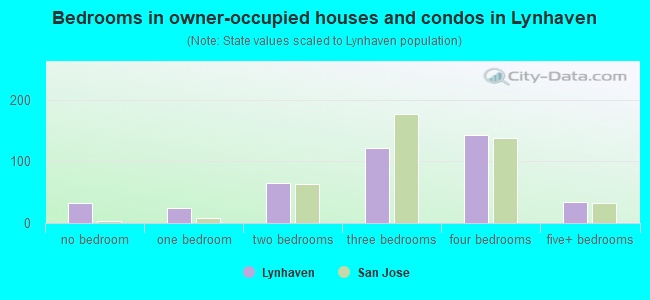
- Bedrooms in owner-occupied houses and condos in Lynhaven
- 33no bedroom
- 241 bedroom
- 652 bedrooms
- 1223 bedrooms
- 1424 bedrooms
- 345+ bedrooms
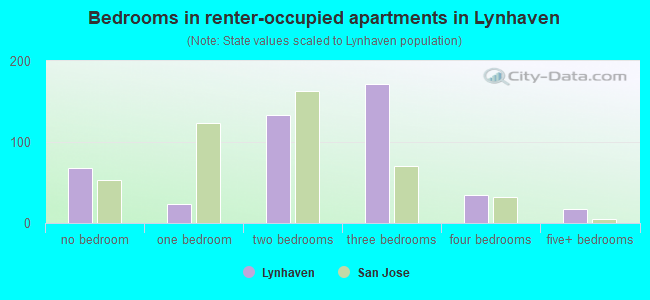
- Bedrooms in renter-occupied apartments in Lynhaven
- 68no bedroom
- 231 bedroom
- 1332 bedrooms
- 1723 bedrooms
- 344 bedrooms
- 175+ bedrooms
Average number of cars or other vehicles available in houses/condos:
Average number of cars or other vehicles available in apartments:
| This neighborhood: | |
| San Jose: |
Average number of cars or other vehicles available in apartments:
| Here: | 2.0 |
| city: | 1.6 |
Percentage of units with a mortgage:
| Lynhaven: | 65.4% |
| San Jose: | 66.9% |
Housing prices:
- Average estimated value of detached houses in 2022 (59.8% of all units):
Lynhaven: $1,612,080 San Jose: $1,532,815
- Average estimated value of townhouses or other attached units in 2022 (33.4% of all units):
This neighborhood: $892,466 city: $1,024,857
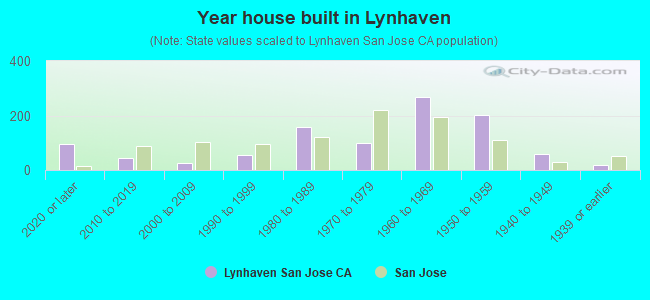
- Year house built in Lynhaven
- 952020 or later
- 442010 to 2019
- 272000 to 2009
- 551990 to 1999
- 1591980 to 1989
- 1001970 to 1979
- 2671960 to 1969
- 2001950 to 1959
- 591940 to 1949
- 181939 or earlier
City-data.com crime index for city in 2020 (higher means more crime):
| City: | 268.4 |
| U.S. average: | 219.5 |
Travel time to work (commute)
![Travel time to work (commute)]()
- 40Less than 5 minutes
- 865 to 9 minutes
- 19410 to 14 minutes
- 22815 to 19 minutes
- 25020 to 24 minutes
- 6925 to 29 minutes
- 15630 to 34 minutes
- 3035 to 39 minutes
- 7540 to 44 minutes
- 12845 to 59 minutes
- 6060 to 89 minutes
- 990 or more minutes

Means of transportation to work
![Means of transportation to work]()
- 73.5%600Drove a car alone
- 5.9%48Carpooled
- 8.2%67Bus
- 1.3%11Subway or elevated rail
- 2.3%19Long-distance train or commuter rail
- 1.1%9Light rail, streetcar or trolley
- 7.1%58Motorcycle
- 2.6%21Bicycle
- 5.4%44Walked
- 1.8%15Other means
- 14.9%122Worked at home

Time leaving home to go to work
![Time leaving home to go to work]()
- 4112:00 a.m. to 4:59 a.m.
- 515:00 a.m. to 5:29 a.m.
- 55:30 a.m. to 5:59 a.m.
- 806:00 a.m. to 6:29 a.m.
- 606:30 a.m. to 6:59 a.m.
- 2597:00 a.m. to 7:29 a.m.
- 1347:30 a.m. to 7:59 a.m.
- 1118:00 a.m. to 8:29 a.m.
- 548:30 a.m. to 8:59 a.m.
- 1609:00 a.m. to 9:59 a.m.
- 14610:00 a.m. to 10:59 a.m.
- 3611:00 a.m. to 11:59 a.m.
- 10212:00 p.m. to 3:59 p.m.
- 74:00 p.m. to 11:59 p.m.

Occupations of males:
- Percentage of males in management occupations (except farmers):
Here: 11.8% city: 13.0%
- Percentage of males in business and financial operations occupations:
Here: 7.7% city: 4.6%
- Percentage of males in computer and mathematical occupations:
Here: 6.7% city: 13.6%
- Percentage of males in architecture and engineering occupations:
Here: 10.3% city: 10.2%
- Percentage of males in life, physical, and social science occupations:
Here: 1.0% city: 1.1%
- Percentage of males in legal occupations:
Here: 3.1% city: 0.8%
- Percentage of males in education, training, and library occupations:
Here: 10.3% city: 2.8%
- Percentage of males in arts, design, entertainment, sports, and media occupations:
Here: 1.2% city: 1.8%
- Percentage of males in healthcare practitioners and technical occupations:
Here: 1.1% city: 2.0%
- Percentage of males in service occupations:
Here: 2.4% city: 12.7%
- Percentage of males in sales and office occupations:
Here: 6.9% city: 12.8%
- Percentage of males in construction, extraction, and maintenance occupations:
Here: 22.2% city: 7.8%
- Percentage of males in material moving occupations:
Here: 4.8% city: 3.1%
Occupations of females:
- Percentage of females in management occupations (except farmers):
Here: 20.4% city: 11.0%
- Percentage of females in business and financial operations occupations:
Here: 11.0% city: 8.6%
- Percentage of females in computer and mathematical occupations:
Here: 8.2% city: 5.4%
- Percentage of females in life, physical, and social science occupations:
Here: 2.2% city: 1.7%
- Percentage of females in legal occupations:
Here: 6.8% city: 1.3%
- Percentage of females in education, training, and library occupations:
Here: 15.9% city: 8.1%
- Percentage of females in arts, design, entertainment, sports, and media occupations:
Here: 10.2% city: 2.0%
- Percentage of females in service occupations:
Here: 10.6% city: 21.7%
- Percentage of females in sales and office occupations:
Here: 14.7% city: 22.0%
Percentage of people 16-64 in Armed Forces:
| Lynhaven: | 0.0% |
| San Jose: | 0.0% |
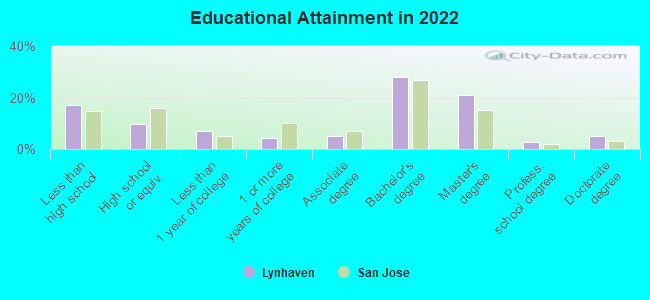
Education in this neighborhood (subdivision or community):
- Percentage of people 3 years and older in K-12 schools:
Lynhaven: 26.5% San Jose: 16.1%
- Percentage of people 3 years and older in undergraduate colleges:
Lynhaven: 7.7% San Jose: 6.5%
- Percentage of people 3 years and older in grad. or professional schools:
Lynhaven: 1.7% San Jose: 2.0%
- Percentage of students K-12 enrolled in private schools:
Lynhaven: 41.0% San Jose: 14.9%
Percentage of population below poverty level:
| Lynhaven: | 3.1% |
| San Jose: | 9.0% |
Median year renter moved in (as recorded in 2022):
| Lynhaven: | 2017 |
| San Jose: | 2020 |
Percentage of married-couple families with both working:
| Lynhaven: | 66.9% |
| San Jose: | 72.5% |
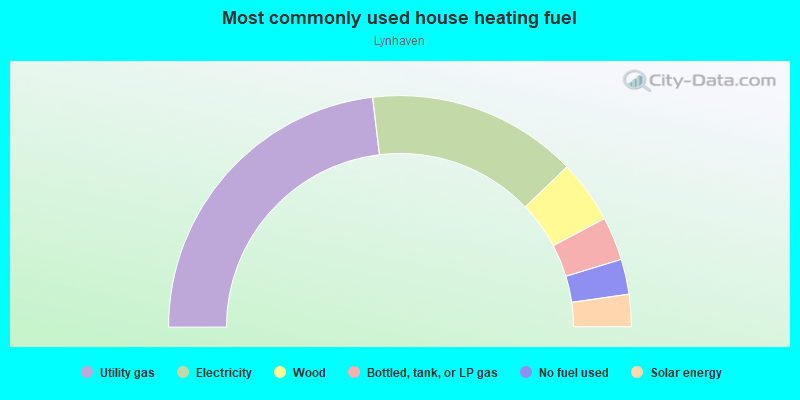
- 46.2%Utility gas
- 29.4%Electricity
- 8.8%Wood
- 6.1%Bottled, tank, or LP gas
- 4.9%No fuel used
- 4.5%Solar energy
Roads and streets:
Williams Rd
Length: 0.71 miles
Direction: E-W
Address range: 3151 to 3698
Direction: E-W
Address range: 3151 to 3698
Eden Ave
Length: 0.45 miles
Directions: N-S, SW-NE
Address range: 650 to 999
Directions: N-S, SW-NE
Address range: 650 to 999
S Cypress Ave
Length: 0.40 miles
Direction: N-S
Address range: 652 to 999
Direction: N-S
Address range: 652 to 999
Opal Dr
Length: 0.40 miles
Directions: N-S, SE-NW
Address range: 700 to 999
Directions: N-S, SE-NW
Address range: 700 to 999
Lynn Oaks Dr
Length: 0.36 miles
Directions: E-W, SW-NE
Address range: 3200 to 3499
Directions: E-W, SW-NE
Address range: 3200 to 3499
Lindenoaks Dr
Length: 0.36 miles
Direction: E-W
Address range: 3200 to 3499
Direction: E-W
Address range: 3200 to 3499
Rosedale Dr
Length: 0.35 miles
Direction: E-W
Address range: 3200 to 3499
Direction: E-W
Address range: 3200 to 3499
Riddle Rd
Length: 0.31 miles
Direction: E-W
Address range: 3100 to 3299
Direction: E-W
Address range: 3100 to 3299
Neal Ave
Length: 0.24 miles
Directions: E-W, SE-NW
Address range: 3100 to 3299
Directions: E-W, SE-NW
Address range: 3100 to 3299
Teresi Ct
Length: 0.19 miles
Directions: N-S, SE-NW
Address range: 700 to 899
Directions: N-S, SE-NW
Address range: 700 to 899
Widget Dr
Length: 0.18 miles
Directions: N-S, SW-NE
Address range: 700 to 899
Directions: N-S, SW-NE
Address range: 700 to 899
Shearton Dr
Length: 0.18 miles
Direction: N-S
Address range: 700 to 899
Direction: N-S
Address range: 700 to 899
Madonna Dr
Length: 0.17 miles
Directions: E-W, SE-NW
Address range: 3300 to 3499
Directions: E-W, SE-NW
Address range: 3300 to 3499
Garnet Dr
Length: 0.16 miles
Direction: E-W
Address range: 3100 to 3299
Direction: E-W
Address range: 3100 to 3299
Emerald Way
Length: 0.15 miles
Direction: N-S
Address range: 900 to 999
Direction: N-S
Address range: 900 to 999
Margate Ave
Length: 0.14 miles
Direction: E-W
Address range: 3500 to 3599
Direction: E-W
Address range: 3500 to 3599
Myles Ct
Length: 0.14 miles
Directions: E-W, SE-NW
Address range: 3200 to 3299
Directions: E-W, SE-NW
Address range: 3200 to 3299
Appleton Dr
Length: 0.12 miles
Directions: E-W, SW-NE
Address range: 3500 to 3599
Directions: E-W, SW-NE
Address range: 3500 to 3599
Ancil Way
Length: 0.12 miles
Directions: E-W, SE-NW, SW-NE
Address range: 3500 to 3599
Directions: E-W, SE-NW, SW-NE
Address range: 3500 to 3599
Vicar Ln
Length: 0.11 miles
Direction: N-S
Address range: 900 to 999
Direction: N-S
Address range: 900 to 999
Radcliffe Dr
Length: 0.09 miles
Directions: N-S, SE-NW
Address range: 900 to 999
Directions: N-S, SE-NW
Address range: 900 to 999
Trifone Dr
Length: 0.09 miles
Directions: N-S, SW-NE
Address range: 900 to 999
Directions: N-S, SW-NE
Address range: 900 to 999
Jade Ave
Length: 0.08 miles
Direction: E-W
Address range: 3200 to 3299
Direction: E-W
Address range: 3200 to 3299
Onyx Ct
Length: 0.06 miles
Direction: N-S
Address range: 700 to 899
Direction: N-S
Address range: 700 to 899
Bordenrae Ct
Length: 0.06 miles
Direction: N-S
Address range: 700 to 899
Direction: N-S
Address range: 700 to 899
Blaisdell Ct
Length: 0.06 miles
Direction: N-S
Address range: 700 to 899
Direction: N-S
Address range: 700 to 899
Starlight Ct
Length: 0.06 miles
Direction: N-S
Address range: 700 to 899
Direction: N-S
Address range: 700 to 899
Nazarene Way
Length: 0.05 miles
Directions: N-S, SE-NW
Address range: 900 to 999
Directions: N-S, SE-NW
Address range: 900 to 999
S Winchester Blvd
Length: 0.05 miles
Direction: N-S
Address range: 600 to 654
Direction: N-S
Address range: 600 to 654
del Monte Pl
Length: 0.04 miles
Direction: N-S
Address range: 900 to 999
Direction: N-S
Address range: 900 to 999
Oakdell Pl
Length: 0.04 miles
Direction: N-S
Address range: 900 to 999
Direction: N-S
Address range: 900 to 999
Westmont Ct
Length: 0.04 miles
Direction: N-S
Address range: 900 to 999
Direction: N-S
Address range: 900 to 999
Magliocco Ct
Length: 0.03 miles
Direction: E-W
Direction: E-W