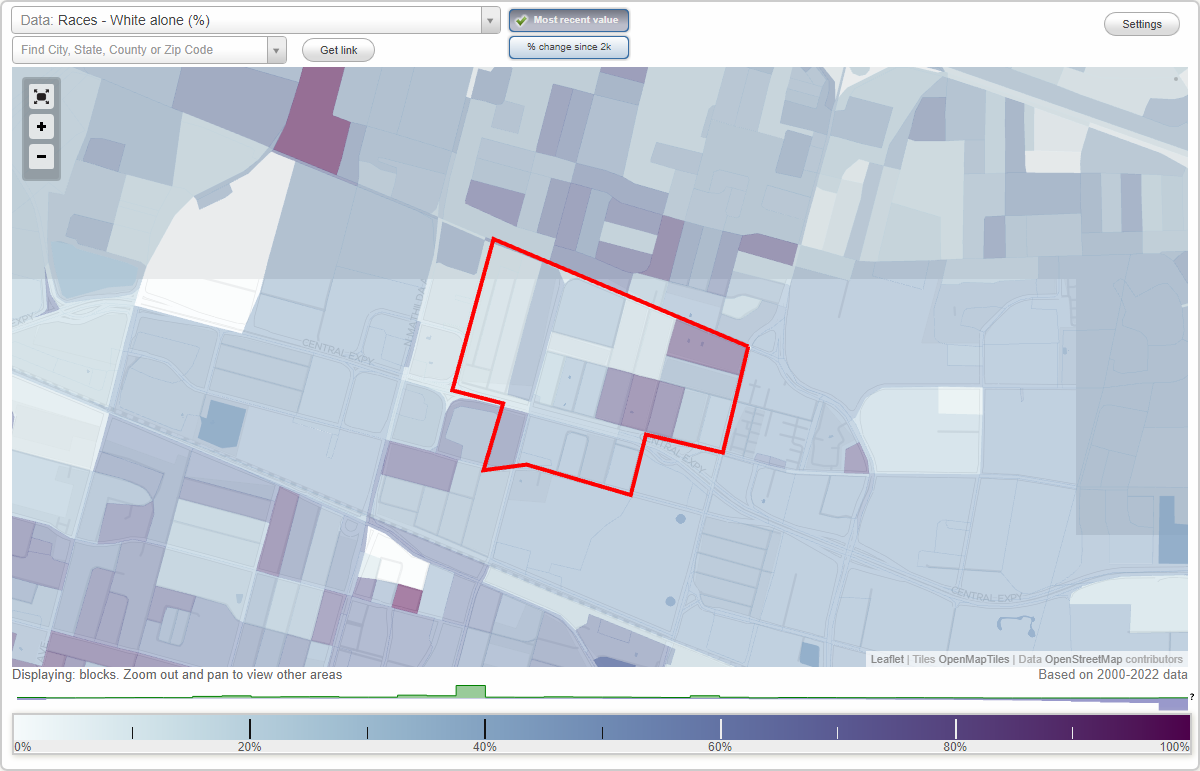
Lowlanders neighborhood in Sunnyvale, California (CA), 94086 detailed profile
Settings
X

Business Search - 14 Million verified businesses
Area: 0.252 square miles
Population: 3,306
Population density:
| Lowlanders: | 13,095 people per square mile |
| Sunnyvale: | 6,978 people per square mile |

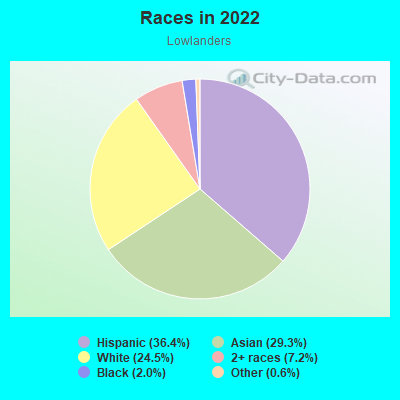
- 1,20436.4%Hispanic or Latino
- 96929.3%Asian
- 81024.5%White
- 2377.2%Two or more races
- 652.0%Black
- 190.6%Some other race
Median household income in 2022:
| Lowlanders: | $134,663 |
| Sunnyvale: | $169,781 |
Distribution of median household income
![Distribution of median household income]()
- 31Less than $10,000
- 38$10,000 to $19,999
- 86$20,000 to $29,999
- 62$30,000 to $39,999
- 70$40,000 to $49,999
- 65$50,000 to $59,999
- 117$60,000 to $74,999
- 85$75,000 to $99,999
- 160$100,000 to $124,999
- 158$125,000 to $149,999
- 155$150,000 to $199,999
- 383$200,000 or more

Distribution of owner-occupied house/condo value
![Distribution of owner-occupied house/condo value]()
- 17$150,000 to $199,999
- 13$750,000 to $999,999
- 406$1,000,000 or more

Distribution of rent paid by renters
![Distribution of rent paid by renters]()
- 60$1,000 to $1,249
- 47$1,250 to $1,499
- 105$1,500 to $1,999
- 725$2,000 or more

Median rent in 2022:
| Lowlanders: | $2,545 |
| Sunnyvale: | $2,001 |
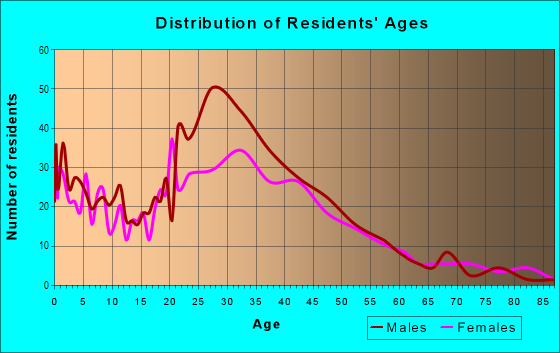
| Males: | 1,871 |
| Females: | 1,434 |
Males:
| This neighborhood: | 38.3 years |
| Whole city: | 34.2 years |
| This neighborhood: | 34.7 years |
| Whole city: | 37.1 years |
Average household size:
| Lowlanders: | 2.5 people |
| Sunnyvale: | 2.6 people |
Percentage of family households:
| Lowlanders: | 44.8% |
| Sunnyvale: | 47.1% |
| Here: | 42.6% |
| Sunnyvale: | 50.8% |
Percentage of married-couple families with children (among all households):
| Lowlanders: | 25.6% |
| Sunnyvale: | 33.2% |
Percentage of single-mother households (among all households):
| Lowlanders: | 10.5% |
| Sunnyvale: | 4.2% |
Percentage of never married males 15 years old and over:
Percentage of never married females 15 years old and over:
| Lowlanders: | 24.1% |
| Sunnyvale: | 23.3% |
Percentage of never married females 15 years old and over:
| Lowlanders: | 16.6% |
| city: | 13.4% |
Percentage of people that speak English not well or not at all:
| Lowlanders: | 8.8% |
| Sunnyvale: | 8.1% |
Percentage of people born in this state:
Percentage of people born in another U.S. state:
Percentage of native residents but born outside the U.S.:
Percentage of foreign born residents:
| Here: | 37.3% |
| Sunnyvale: | 37.8% |
Percentage of people born in another U.S. state:
| Lowlanders: | 12.9% |
| Sunnyvale: | 12.0% |
Percentage of native residents but born outside the U.S.:
| Here: | 1.3% |
| city: | 1.7% |
Percentage of foreign born residents:
| Here: | 48.5% |
| Sunnyvale: | 48.5% |
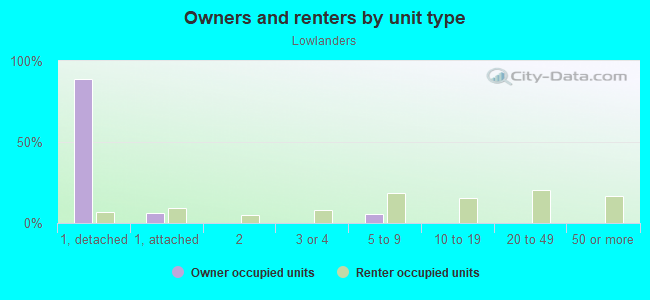
Owner-occupied
Renter-occupied

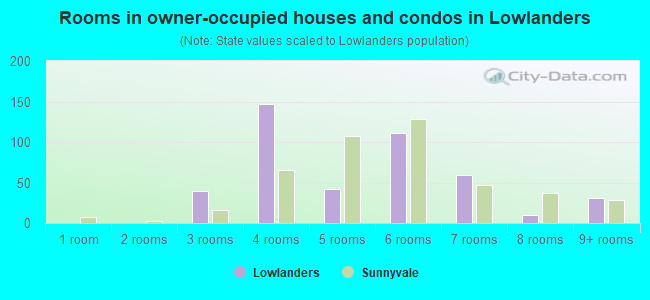
- Rooms in owner-occupied houses and condos in Lowlanders
- 01 room
- 02 rooms
- 403 rooms
- 1474 rooms
- 425 rooms
- 1116 rooms
- 597 rooms
- 108 rooms
- 319+ rooms
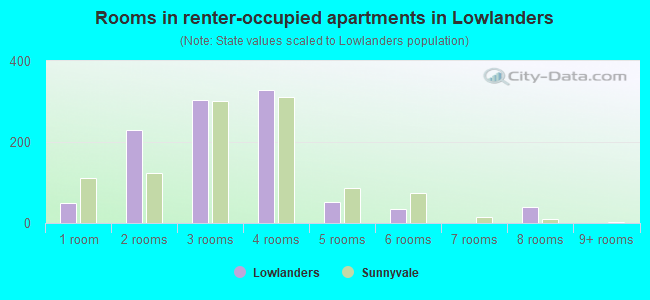
- Rooms in renter-occupied apartments in Lowlanders
- 501 room
- 2302 rooms
- 3043 rooms
- 3284 rooms
- 515 rooms
- 346 rooms
- 07 rooms
- 398 rooms
- 09+ rooms
Owner-occupied
Renter-occupied
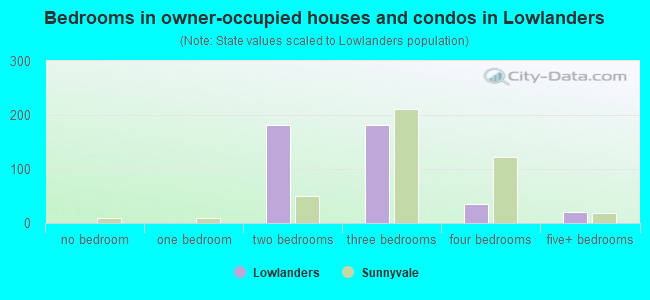
- Bedrooms in owner-occupied houses and condos in Lowlanders
- 0no bedroom
- 01 bedroom
- 1812 bedrooms
- 1823 bedrooms
- 364 bedrooms
- 215+ bedrooms
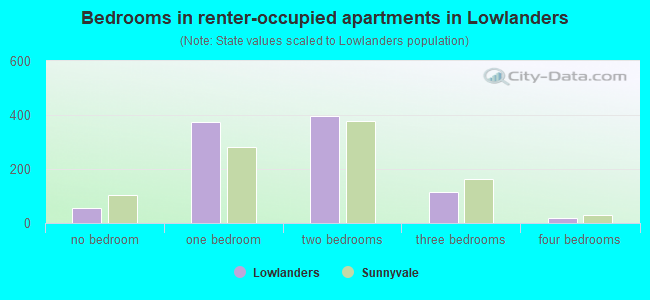
- Bedrooms in renter-occupied apartments in Lowlanders
- 57no bedroom
- 3741 bedroom
- 3962 bedrooms
- 1153 bedrooms
- 174 bedrooms
- 05+ bedrooms
Average number of cars or other vehicles available in houses/condos:
Average number of cars or other vehicles available in apartments:
| This neighborhood: | 2.6 |
| Sunnyvale: | 2.0 |
Average number of cars or other vehicles available in apartments:
| Here: | 1.4 |
| city: | 1.5 |
Percentage of units with a mortgage:
| Lowlanders: | 71.7% |
| Sunnyvale: | 57.7% |
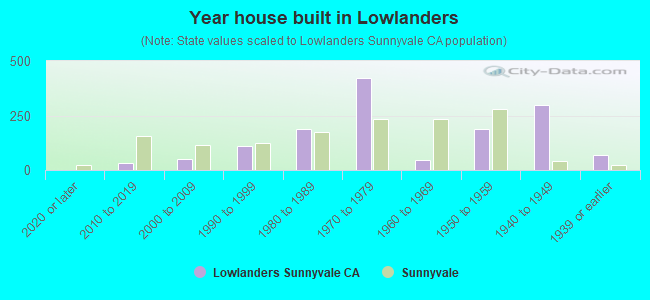
- Year house built in Lowlanders
- 02020 or later
- 332010 to 2019
- 512000 to 2009
- 1091990 to 1999
- 1881980 to 1989
- 4241970 to 1979
- 451960 to 1969
- 1891950 to 1959
- 2991940 to 1949
- 711939 or earlier
City-data.com crime index for city in 2020 (higher means more crime):
| City: | 151.0 |
| U.S. average: | 219.5 |
Travel time to work (commute)
![Travel time to work (commute)]()
- 29Less than 5 minutes
- 1375 to 9 minutes
- 31710 to 14 minutes
- 48915 to 19 minutes
- 24420 to 24 minutes
- 6425 to 29 minutes
- 44730 to 34 minutes
- 3635 to 39 minutes
- 4740 to 44 minutes
- 9945 to 59 minutes
- 7760 to 89 minutes
- 1390 or more minutes

Means of transportation to work
![Means of transportation to work]()
- 66.5%1,458Drove a car alone
- 8.9%196Carpooled
- 3.0%65Bus
- 1.3%28Subway or elevated rail
- 1.7%37Long-distance train or commuter rail
- 0.7%16Motorcycle
- 3.0%66Bicycle
- 1.6%34Walked
- 1.2%27Other means
- 13.5%296Worked at home

Time leaving home to go to work
![Time leaving home to go to work]()
- 6112:00 a.m. to 4:59 a.m.
- 505:00 a.m. to 5:29 a.m.
- 215:30 a.m. to 5:59 a.m.
- 86:00 a.m. to 6:29 a.m.
- 796:30 a.m. to 6:59 a.m.
- 1037:00 a.m. to 7:29 a.m.
- 2457:30 a.m. to 7:59 a.m.
- 3218:00 a.m. to 8:29 a.m.
- 1528:30 a.m. to 8:59 a.m.
- 3069:00 a.m. to 9:59 a.m.
- 19410:00 a.m. to 10:59 a.m.
- 5311:00 a.m. to 11:59 a.m.
- 9312:00 p.m. to 3:59 p.m.
- 3114:00 p.m. to 11:59 p.m.

Occupations of males:
- Percentage of males in management occupations (except farmers):
Here: 5.4% city: 12.9%
- Percentage of males in business and financial operations occupations:
Here: 2.6% city: 3.9%
- Percentage of males in computer and mathematical occupations:
Here: 31.5% city: 36.0%
- Percentage of males in architecture and engineering occupations:
Here: 9.1% city: 11.7%
- Percentage of males in life, physical, and social science occupations:
Here: 2.1% city: 1.9%
- Percentage of males in community and social services occupations:
Here: 1.0% city: 0.5%
- Percentage of males in arts, design, entertainment, sports, and media occupations:
Here: 1.5% city: 1.0%
- Percentage of males in service occupations:
Here: 10.1% city: 6.8%
- Percentage of males in sales and office occupations:
Here: 16.6% city: 9.4%
- Percentage of males in construction, extraction, and maintenance occupations:
Here: 4.1% city: 3.0%
- Percentage of males in production occupations:
Here: 7.3% city: 2.8%
- Percentage of males in transportation occupations:
Here: 2.0% city: 2.9%
- Percentage of males in material moving occupations:
Here: 2.7% city: 1.2%
Occupations of females:
- Percentage of females in management occupations (except farmers):
Here: 4.7% city: 12.6%
- Percentage of females in business and financial operations occupations:
Here: 8.0% city: 9.5%
- Percentage of females in computer and mathematical occupations:
Here: 14.1% city: 17.6%
- Percentage of females in architecture and engineering occupations:
Here: 5.0% city: 5.6%
- Percentage of females in education, training, and library occupations:
Here: 10.9% city: 7.5%
- Percentage of females in arts, design, entertainment, sports, and media occupations:
Here: 3.6% city: 3.5%
- Percentage of females in healthcare practitioners and technical occupations:
Here: 2.3% city: 5.1%
- Percentage of females in service occupations:
Here: 34.1% city: 12.0%
- Percentage of females in sales and office occupations:
Here: 15.4% city: 16.1%
- Percentage of females in production occupations:
Here: 1.9% city: 2.9%
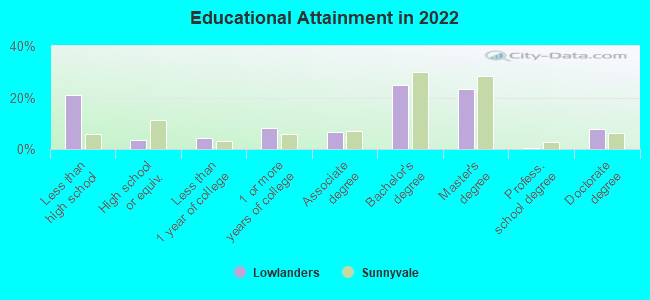
Education in this neighborhood (subdivision or community):
- Percentage of people 3 years and older in K-12 schools:
Lowlanders: 11.2% Sunnyvale: 12.5%
- Percentage of people 3 years and older in undergraduate colleges:
Lowlanders: 5.5% Sunnyvale: 5.1%
- Percentage of people 3 years and older in grad. or professional schools:
Lowlanders: 0.6% Sunnyvale: 2.3%
- Percentage of students K-12 enrolled in private schools:
Lowlanders: 9.6% Sunnyvale: 14.9%
Percentage of population below poverty level:
| Lowlanders: | 8.4% |
| Sunnyvale: | 6.2% |
Median year owner moved in (as recorded in 2022):
Median year renter moved in (as recorded in 2022):
| Lowlanders: | 2004 |
| Sunnyvale: | 2008 |
Median year renter moved in (as recorded in 2022):
| Lowlanders: | 2016 |
| Sunnyvale: | 2021 |
Percentage of married-couple families with both working:
| Lowlanders: | 99.2% |
| Sunnyvale: | 69.8% |
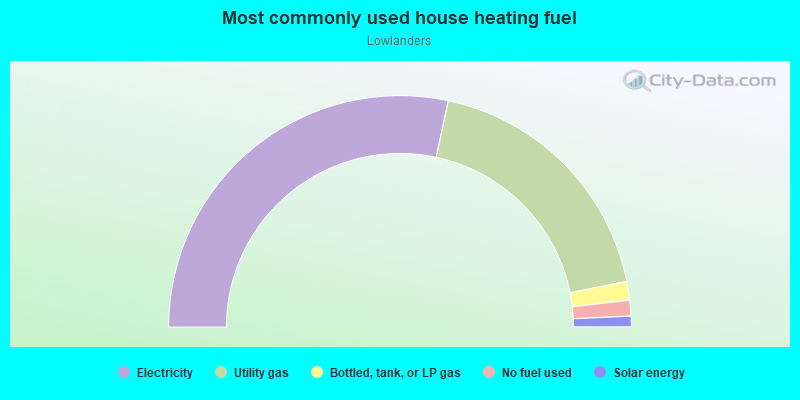
- 56.7%Electricity
- 37.0%Utility gas
- 2.6%Bottled, tank, or LP gas
- 2.2%No fuel used
- 1.5%Solar energy
Limited-access highways (interstate or state) in this neighborhood:
Central Expy
Length: 0.34 miles
Direction: E-W
Direction: E-W
Roads and streets:
E Arques Ave
Length: 0.65 miles
Direction: E-W
Address range: 100 to 599
Direction: E-W
Address range: 100 to 599
Taylor Ave
Length: 0.57 miles
Direction: E-W
Address range: 200 to 599
Direction: E-W
Address range: 200 to 599
Morse Ave
Length: 0.44 miles
Directions: N-S, SW-NE
Address range: 200 to 499
Directions: N-S, SW-NE
Address range: 200 to 499
Roosevelt Ave
Length: 0.39 miles
Directions: N-S, SW-NE
Address range: 200 to 499
Directions: N-S, SW-NE
Address range: 200 to 499
N Bayview Ave
Length: 0.38 miles
Directions: N-S, SW-NE
Address range: 200 to 499
Directions: N-S, SW-NE
Address range: 200 to 499
E Maude Ave
Length: 0.35 miles
Directions: E-W, SE-NW
Address range: 100 to 453
Directions: E-W, SE-NW
Address range: 100 to 453
Stowell Ave
Length: 0.34 miles
Direction: N-S
Address range: 300 to 399
Direction: N-S
Address range: 300 to 399
N Murphy Ave
Length: 0.33 miles
Directions: N-S, SW-NE
Address range: 300 to 399
Directions: N-S, SW-NE
Address range: 300 to 399
N Sunnyvale Ave
Length: 0.32 miles
Directions: N-S, SW-NE
Address range: 300 to 499
Directions: N-S, SW-NE
Address range: 300 to 499
Orchard Ave
Length: 0.25 miles
Direction: N-S
Address range: 300 to 399
Direction: N-S
Address range: 300 to 399
Columbia Ave
Length: 0.23 miles
Direction: E-W
Address range: 500 to 599
Direction: E-W
Address range: 500 to 599
Hazelton Ave
Length: 0.19 miles
Direction: E-W
Address range: 200 to 299
Direction: E-W
Address range: 200 to 299
N Fairoaks Ave
Length: 0.19 miles
Direction: N-S
Address range: 300 to 449
Direction: N-S
Address range: 300 to 449
E California Ave
Length: 0.15 miles
Direction: E-W
Address range: 300 to 499
Direction: E-W
Address range: 300 to 499
W Arques Ave
Length: 0.14 miles
Direction: E-W
Address range: 100 to 199
Direction: E-W
Address range: 100 to 199
Schroeder Ave
Length: 0.12 miles
Direction: N-S
Address range: 300 to 399
Direction: N-S
Address range: 300 to 399
Jackson Ave
Length: 0.12 miles
Direction: N-S
Address range: 300 to 399
Direction: N-S
Address range: 300 to 399
Lastreto Ave
Length: 0.12 miles
Directions: N-S, SW-NE
Address range: 300 to 399
Directions: N-S, SW-NE
Address range: 300 to 399
America Ave
Length: 0.12 miles
Direction: N-S
Address range: 300 to 399
Direction: N-S
Address range: 300 to 399
Bayview Ave
Length: 0.10 miles
Directions: E-W, N-S, SE-NW, SW-NE
Directions: E-W, N-S, SE-NW, SW-NE
Chestnut Ave
Length: 0.08 miles
Direction: E-W
Address range: 100 to 199
Direction: E-W
Address range: 100 to 199
Walnut Ave
Length: 0.08 miles
Direction: E-W
Address range: 100 to 199
Direction: E-W
Address range: 100 to 199
W Maude Ave
Length: 0.08 miles
Direction: E-W
Address range: 100 to 199
Direction: E-W
Address range: 100 to 199
Banning Ave
Length: 0.08 miles
Direction: E-W
Address range: 400 to 499
Direction: E-W
Address range: 400 to 499