Los Gatos neighborhood in San Jose, California (CA), 95124 detailed profile
Settings
X

Business Search - 14 Million verified businesses
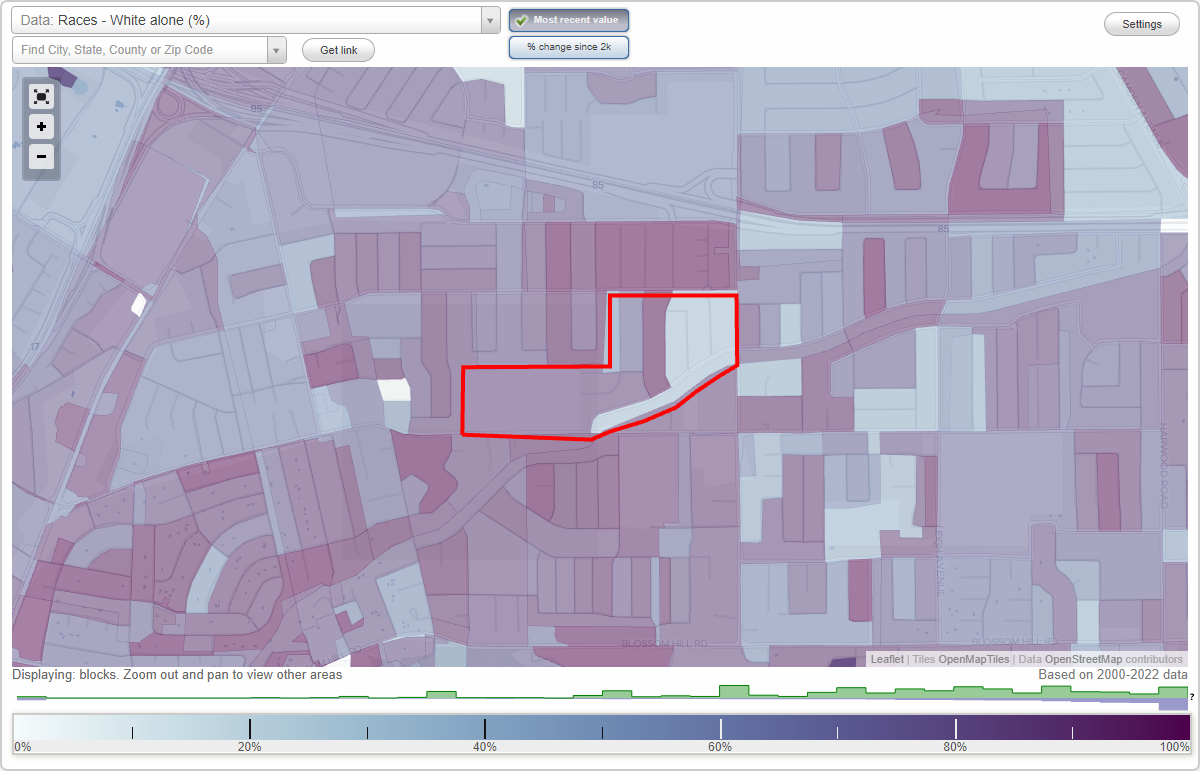
Area: 0.134 square miles
Population: 1,339
Population density:
| Los Gatos: | 9,985 people per square mile |
| San Jose: | 5,554 people per square mile |

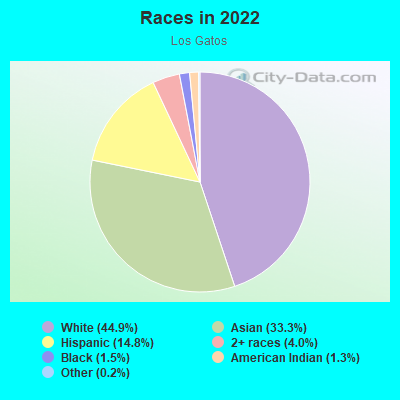
- 61044.9%White
- 45333.3%Asian
- 20114.8%Hispanic or Latino
- 544.0%Two or more races
- 201.5%Black
- 181.3%American Indian
- 30.2%Some other race
Median household income in 2022:
| Los Gatos: | $192,530 |
| San Jose: | $133,835 |
Distribution of median household income
![Distribution of median household income]()
- 40Less than $10,000
- 15$10,000 to $19,999
- 8$20,000 to $29,999
- 18$30,000 to $39,999
- 99$40,000 to $49,999
- 31$50,000 to $59,999
- 12$60,000 to $74,999
- 16$75,000 to $99,999
- 19$100,000 to $124,999
- 17$125,000 to $149,999
- 109$150,000 to $199,999
- 177$200,000 or more

Distribution of owner-occupied house/condo value
![Distribution of owner-occupied house/condo value]()
- 27Less than $50,000
- 7$100,000 to $149,999
- 6$400,000 to $499,999
- 5$500,000 to $749,999
- 6$750,000 to $999,999
- 339$1,000,000 or more

Distribution of rent paid by renters
![Distribution of rent paid by renters]()
- 3$500 to $599
- 2$1,000 to $1,249
- 4$1,250 to $1,499
- 57$1,500 to $1,999
- 68$2,000 or more

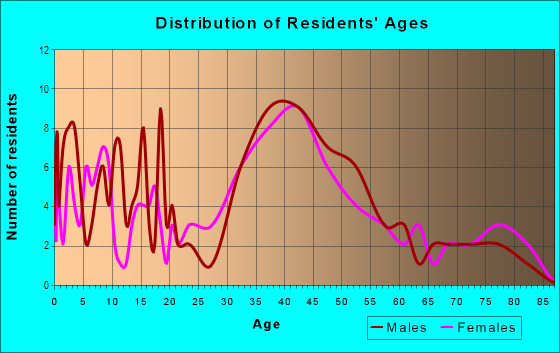
| Males: | 755 |
| Females: | 583 |
Males:
| This neighborhood: | 40.5 years |
| Whole city: | 37.6 years |
| This neighborhood: | 42.9 years |
| Whole city: | 39.1 years |
Average household size:
| Los Gatos: | 11.9 people |
| San Jose: | 2.9 people |
Percentage of family households:
| Los Gatos: | 72.0% |
| San Jose: | 49.9% |
| Here: | 77.0% |
| San Jose: | 53.0% |
Percentage of married-couple families with children (among all households):
| Los Gatos: | 32.5% |
| San Jose: | 25.8% |
Percentage of single-mother households (among all households):
| Los Gatos: | 0.4% |
| San Jose: | 5.2% |
Percentage of never married males 15 years old and over:
Percentage of never married females 15 years old and over:
| Los Gatos: | 19.7% |
| San Jose: | 20.9% |
Percentage of never married females 15 years old and over:
| Los Gatos: | 6.5% |
| city: | 16.7% |
Percentage of people that speak English not well or not at all:
| Los Gatos: | 3.2% |
| San Jose: | 11.4% |
Percentage of people born in this state:
Percentage of people born in another U.S. state:
Percentage of native residents but born outside the U.S.:
Percentage of foreign born residents:
| Here: | 52.7% |
| San Jose: | 46.1% |
Percentage of people born in another U.S. state:
| Los Gatos: | 18.5% |
| San Jose: | 10.4% |
Percentage of native residents but born outside the U.S.:
| Here: | 0.4% |
| city: | 1.7% |
Percentage of foreign born residents:
| Here: | 28.4% |
| San Jose: | 41.8% |
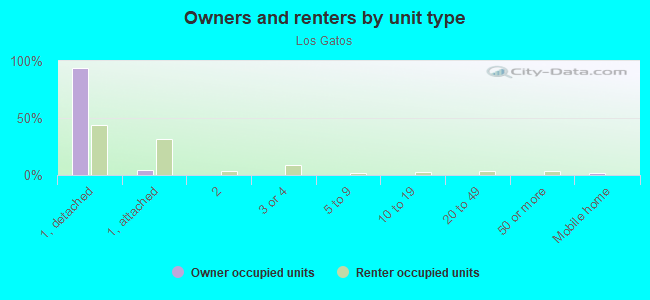
Owner-occupied
Renter-occupied

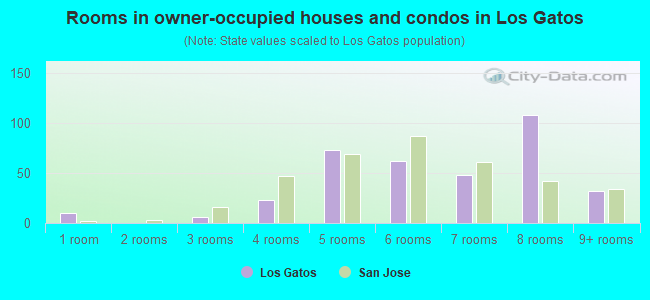
- Rooms in owner-occupied houses and condos in Los Gatos
- 101 room
- 02 rooms
- 63 rooms
- 234 rooms
- 735 rooms
- 626 rooms
- 487 rooms
- 1088 rooms
- 329+ rooms
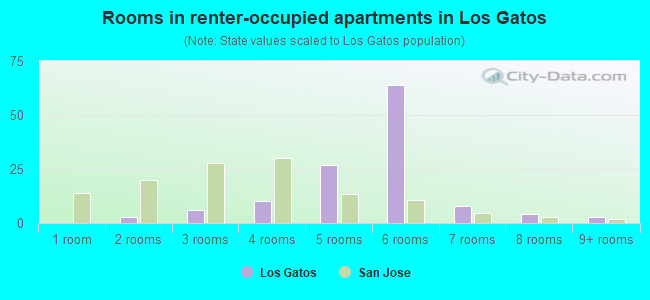
- Rooms in renter-occupied apartments in Los Gatos
- 01 room
- 32 rooms
- 63 rooms
- 104 rooms
- 275 rooms
- 646 rooms
- 87 rooms
- 48 rooms
- 39+ rooms
Owner-occupied
Renter-occupied
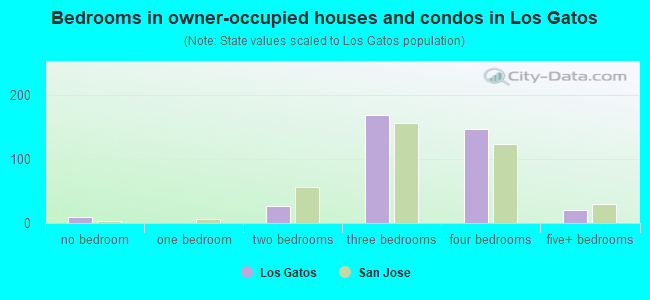
- Bedrooms in owner-occupied houses and condos in Los Gatos
- 10no bedroom
- 01 bedroom
- 272 bedrooms
- 1693 bedrooms
- 1474 bedrooms
- 215+ bedrooms
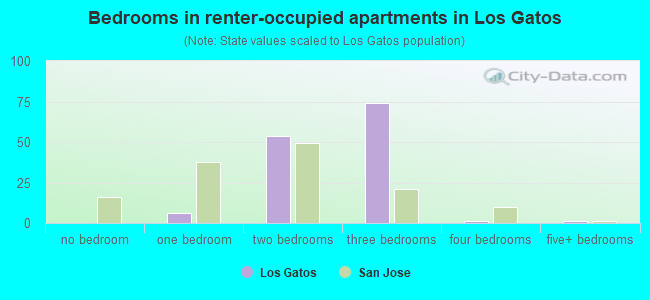
- Bedrooms in renter-occupied apartments in Los Gatos
- 0no bedroom
- 61 bedroom
- 542 bedrooms
- 743 bedrooms
- 14 bedrooms
- 15+ bedrooms
Average number of cars or other vehicles available in houses/condos:
Average number of cars or other vehicles available in apartments:
| This neighborhood: | 2.4 |
| San Jose: | 2.3 |
Average number of cars or other vehicles available in apartments:
| Here: | 2.4 |
| city: | 1.6 |
Percentage of units with a mortgage:
| Los Gatos: | 83.4% |
| San Jose: | 66.9% |
Average estimated value of detached houses in 2022 (96.7% of all units):
| Los Gatos: | $1,857,906 |
| San Jose: | $1,532,815 |
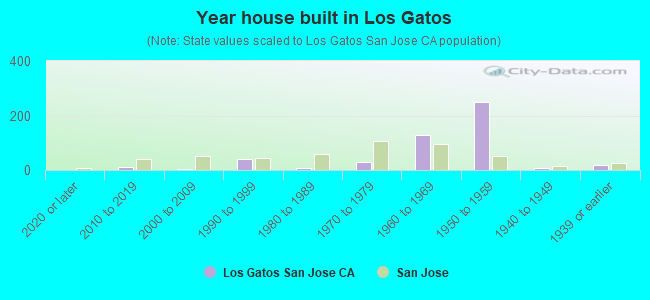
- Year house built in Los Gatos
- 02020 or later
- 112010 to 2019
- 52000 to 2009
- 401990 to 1999
- 71980 to 1989
- 301970 to 1979
- 1291960 to 1969
- 2491950 to 1959
- 61940 to 1949
- 201939 or earlier
City-data.com crime index for city in 2020 (higher means more crime):
| City: | 268.4 |
| U.S. average: | 219.5 |
Travel time to work (commute)
![Travel time to work (commute)]()
- 2Less than 5 minutes
- 295 to 9 minutes
- 4810 to 14 minutes
- 7015 to 19 minutes
- 5720 to 24 minutes
- 1325 to 29 minutes
- 3930 to 34 minutes
- 835 to 39 minutes
- 4040 to 44 minutes
- 2245 to 59 minutes
- 760 to 89 minutes
- 1490 or more minutes

Means of transportation to work
![Means of transportation to work]()
- 67.7%485Drove a car alone
- 1.0%7Carpooled
- 0.8%6Bus
- 0.7%5Taxi
- 0.1%1Bicycle
- 1.3%9Walked
- 3.1%22Other means
- 28.1%201Worked at home

Time leaving home to go to work
![Time leaving home to go to work]()
- 1312:00 a.m. to 4:59 a.m.
- 175:00 a.m. to 5:29 a.m.
- 55:30 a.m. to 5:59 a.m.
- 326:00 a.m. to 6:29 a.m.
- 246:30 a.m. to 6:59 a.m.
- 437:00 a.m. to 7:29 a.m.
- 337:30 a.m. to 7:59 a.m.
- 548:00 a.m. to 8:29 a.m.
- 218:30 a.m. to 8:59 a.m.
- 559:00 a.m. to 9:59 a.m.
- 1410:00 a.m. to 10:59 a.m.
- 311:00 a.m. to 11:59 a.m.
- 2012:00 p.m. to 3:59 p.m.
- 184:00 p.m. to 11:59 p.m.

Occupations of males:
- Percentage of males in management occupations (except farmers):
Here: 14.1% city: 13.0%
- Percentage of males in business and financial operations occupations:
Here: 16.3% city: 4.6%
- Percentage of males in computer and mathematical occupations:
Here: 11.8% city: 13.6%
- Percentage of males in architecture and engineering occupations:
Here: 12.1% city: 10.2%
- Percentage of males in life, physical, and social science occupations:
Here: 1.0% city: 1.1%
- Percentage of males in education, training, and library occupations:
Here: 4.3% city: 2.8%
- Percentage of males in healthcare practitioners and technical occupations:
Here: 2.5% city: 2.0%
- Percentage of males in service occupations:
Here: 27.0% city: 12.7%
- Percentage of males in sales and office occupations:
Here: 8.2% city: 12.8%
Occupations of females:
- Percentage of females in management occupations (except farmers):
Here: 31.6% city: 11.0%
- Percentage of females in business and financial operations occupations:
Here: 6.8% city: 8.6%
- Percentage of females in computer and mathematical occupations:
Here: 9.4% city: 5.4%
- Percentage of females in community and social services occupations:
Here: 1.7% city: 1.8%
- Percentage of females in education, training, and library occupations:
Here: 7.9% city: 8.1%
- Percentage of females in healthcare practitioners and technical occupations:
Here: 7.5% city: 6.8%
- Percentage of females in service occupations:
Here: 19.8% city: 21.7%
- Percentage of females in sales and office occupations:
Here: 13.4% city: 22.0%
- Percentage of females in production occupations:
Here: 1.7% city: 4.0%
- Percentage of females in material moving occupations:
Here: 2.4% city: 1.5%
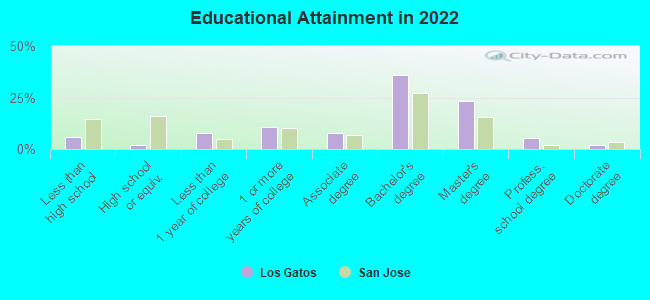
Education in this neighborhood (subdivision or community):
- Percentage of people 3 years and older in K-12 schools:
Los Gatos: 23.6% San Jose: 16.1%
- Percentage of people 3 years and older in undergraduate colleges:
Los Gatos: 2.5% San Jose: 6.5%
- Percentage of people 3 years and older in grad. or professional schools:
Los Gatos: 1.5% San Jose: 2.0%
- Percentage of students K-12 enrolled in private schools:
Los Gatos: 17.5% San Jose: 14.9%
Percentage of population below poverty level:
| Los Gatos: | 3.0% |
| San Jose: | 9.0% |
Median year owner moved in (as recorded in 2022):
Median year renter moved in (as recorded in 2022):
| Los Gatos: | 2008 |
| San Jose: | 2008 |
Median year renter moved in (as recorded in 2022):
| Los Gatos: | 2017 |
| San Jose: | 2020 |
Percentage of married-couple families with both working:
| Los Gatos: | 88.1% |
| San Jose: | 72.5% |
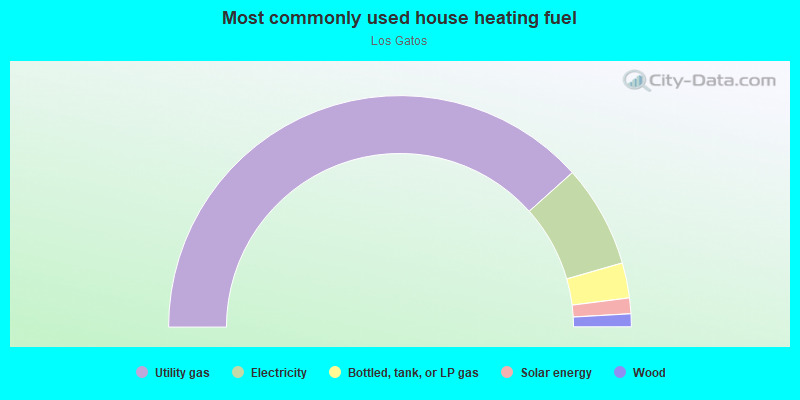
- 76.7%Utility gas
- 14.3%Electricity
- 4.9%Bottled, tank, or LP gas
- 2.2%Solar energy
- 1.8%Wood
Roads and streets:
Rosswood Dr
Length: 0.50 miles
Directions: E-W, N-S, SW-NE
Address range: 2000 to 2199
Directions: E-W, N-S, SW-NE
Address range: 2000 to 2199
Los Gatos Almaden Rd
Length: 0.33 miles
Direction: E-W
Address range: 2176 to 15628
Direction: E-W
Address range: 2176 to 15628
Bel Canto Dr
Length: 0.20 miles
Directions: E-W, N-S, SE-NW
Address range: 4900 to 5099
Directions: E-W, N-S, SE-NW
Address range: 4900 to 5099
Bel Estos Dr
Length: 0.19 miles
Directions: N-S, SE-NW
Address range: 4901 to 5098
Directions: N-S, SE-NW
Address range: 4901 to 5098
Sufonet Dr
Length: 0.18 miles
Direction: E-W
Address range: 2100 to 2199
Direction: E-W
Address range: 2100 to 2199
Brewster Ave
Length: 0.15 miles
Directions: E-W, N-S, SW-NE
Address range: 4901 to 5198
Directions: E-W, N-S, SW-NE
Address range: 4901 to 5198
Esther Dr
Length: 0.07 miles
Directions: N-S, SE-NW
Directions: N-S, SE-NW
Union Ave
Length: 0.04 miles
Direction: N-S
Address range: 5000 to 5099
Direction: N-S
Address range: 5000 to 5099
Other features:
Ross Crk
Length: 0.44 miles
Directions: E-W, SW-NE
Directions: E-W, SW-NE