Lomita Park (Lomita) neighborhood in San Bruno, California (CA), 94066, 94030 detailed profile
Settings
X

Business Search - 14 Million verified businesses
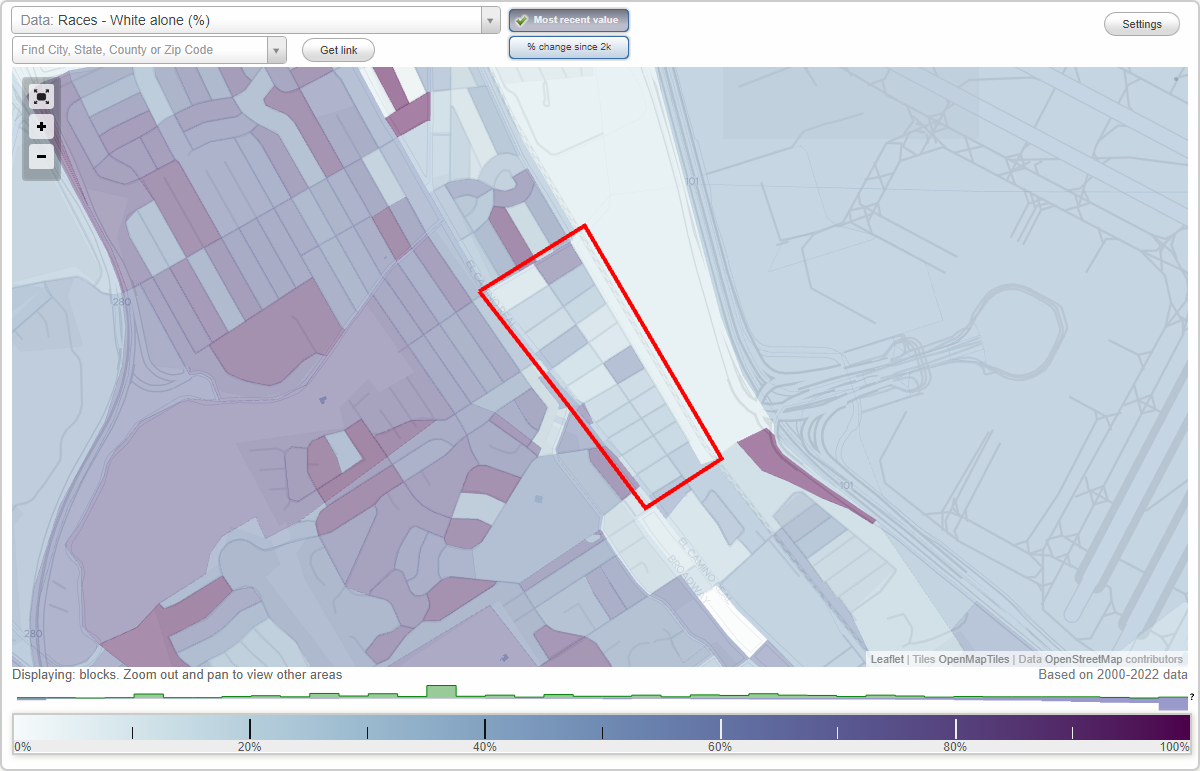
Area: 0.160 square miles
Population: 1,428
Population density:
| Lomita Park (Lomita): | 8,945 people per square mile |
| San Bruno: | 7,913 people per square mile |

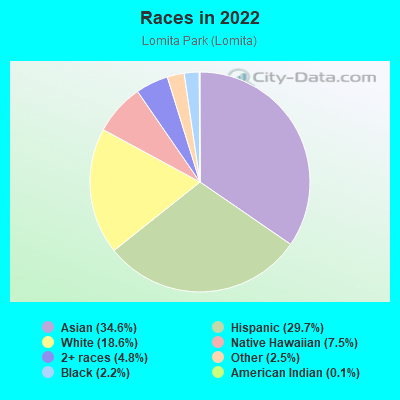
- 50134.6%Asian
- 43129.7%Hispanic or Latino
- 27018.6%White
- 1087.5%Native Hawaiian and Other
Pacific Islander - 694.8%Two or more races
- 362.5%Some other race
- 322.2%Black
- 20.1%American Indian
Median household income in 2022:
| Lomita Park (Lomita): | $128,721 |
| San Bruno: | $131,669 |
Distribution of median household income
![Distribution of median household income]()
- 30Less than $10,000
- 159$10,000 to $19,999
- 58$20,000 to $29,999
- 40$30,000 to $39,999
- 14$40,000 to $49,999
- 11$50,000 to $59,999
- 27$60,000 to $74,999
- 60$75,000 to $99,999
- 41$100,000 to $124,999
- 75$125,000 to $149,999
- 94$150,000 to $199,999
- 77$200,000 or more

Distribution of owner-occupied house/condo value
![Distribution of owner-occupied house/condo value]()
- 3Less than $50,000
- 9$50,000 to $99,999
- 8$100,000 to $149,999
- 16$150,000 to $199,999
- 30$200,000 to $249,999
- 5$300,000 to $399,999
- 9$400,000 to $499,999
- 13$500,000 to $749,999
- 39$750,000 to $999,999
- 317$1,000,000 or more

Distribution of rent paid by renters
![Distribution of rent paid by renters]()
- 9$900 to $999
- 45$1,000 to $1,249
- 7$1,250 to $1,499
- 118$1,500 to $1,999
- 219$2,000 or more

Median rent in 2022:
| Lomita Park (Lomita): | $2,283 |
| San Bruno: | $2,001 |
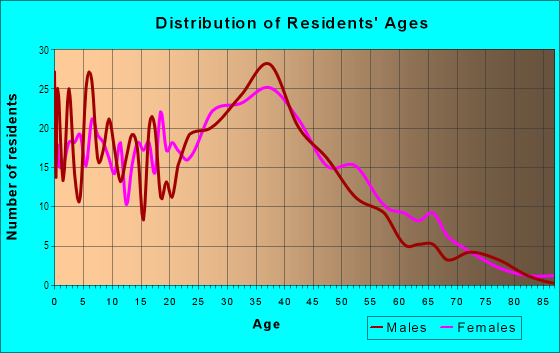
| Males: | 708 |
| Females: | 720 |
Males:
| This neighborhood: | 36.5 years |
| Whole city: | 36.8 years |
| This neighborhood: | 45.1 years |
| Whole city: | 41.6 years |
Average household size:
| Lomita Park (Lomita): | 3.2 people |
| San Bruno: | 2.8 people |
Percentage of family households:
| Lomita Park (Lomita): | 47.3% |
| San Bruno: | 45.6% |
| Here: | 45.3% |
| San Bruno: | 52.4% |
Percentage of married-couple families with children (among all households):
| Lomita Park (Lomita): | 26.2% |
| San Bruno: | 27.4% |
Percentage of single-mother households (among all households):
| Lomita Park (Lomita): | 5.7% |
| San Bruno: | 5.2% |
Percentage of never married males 15 years old and over:
Percentage of never married females 15 years old and over:
| Lomita Park (Lomita): | 20.4% |
| San Bruno: | 20.4% |
Percentage of never married females 15 years old and over:
| Lomita Park (Lomita): | 15.4% |
| city: | 15.1% |
Percentage of people that speak English not well or not at all:
| Lomita Park (Lomita): | 7.7% |
| San Bruno: | 7.3% |
Percentage of people born in this state:
Percentage of people born in another U.S. state:
Percentage of native residents but born outside the U.S.:
Percentage of foreign born residents:
| Here: | 52.4% |
| San Bruno: | 53.6% |
Percentage of people born in another U.S. state:
| Lomita Park (Lomita): | 5.1% |
| San Bruno: | 7.8% |
Percentage of native residents but born outside the U.S.:
| Here: | 1.0% |
| city: | 1.5% |
Percentage of foreign born residents:
| Here: | 41.5% |
| San Bruno: | 37.2% |
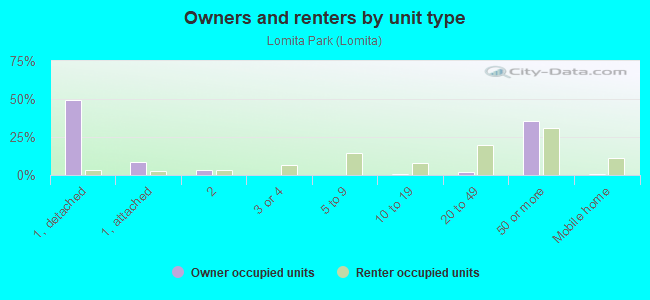
Owner-occupied
Renter-occupied

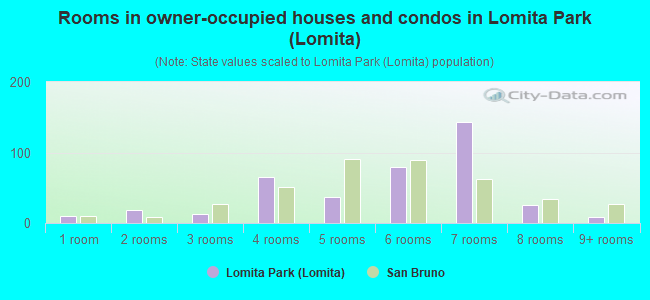
- Rooms in owner-occupied houses and condos in Lomita Park <
> - 101 room
- 182 rooms
- 133 rooms
- 654 rooms
- 375 rooms
- 796 rooms
- 1437 rooms
- 268 rooms
- 89+ rooms
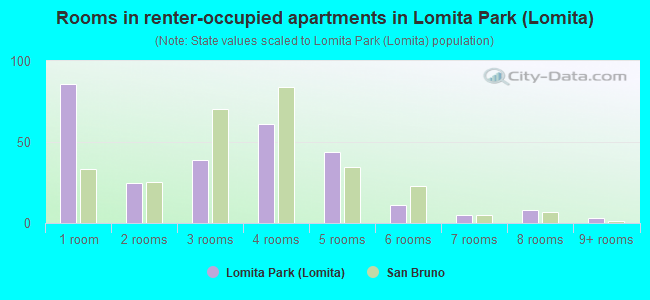
- Rooms in renter-occupied apartments in Lomita Park <
> - 861 room
- 252 rooms
- 393 rooms
- 614 rooms
- 445 rooms
- 116 rooms
- 57 rooms
- 88 rooms
- 39+ rooms
Owner-occupied
Renter-occupied
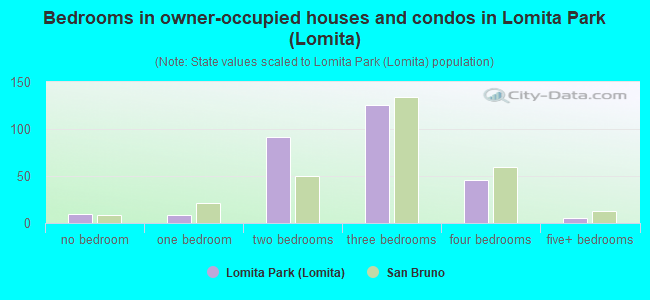
- Bedrooms in owner-occupied houses and condos in Lomita Park <
> - 10no bedroom
- 81 bedroom
- 912 bedrooms
- 1263 bedrooms
- 464 bedrooms
- 55+ bedrooms
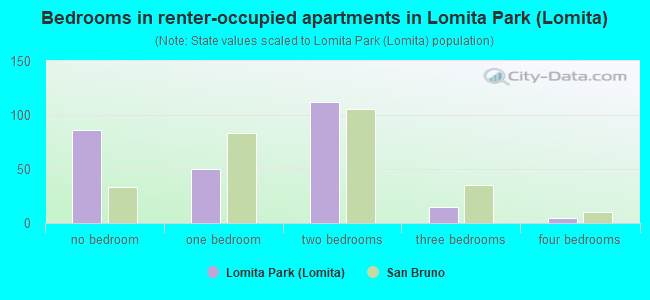
- Bedrooms in renter-occupied apartments in Lomita Park <
> - 86no bedroom
- 501 bedroom
- 1122 bedrooms
- 153 bedrooms
- 54 bedrooms
- 05+ bedrooms
Average number of cars or other vehicles available in houses/condos:
Average number of cars or other vehicles available in apartments:
| This neighborhood: | 2.2 |
| San Bruno: | 2.2 |
Average number of cars or other vehicles available in apartments:
| Here: | 1.6 |
| city: | 1.6 |
Percentage of units with a mortgage:
| Lomita Park (Lomita): | 74.2% |
| San Bruno: | 69.6% |
Average estimated value of detached houses in 2022 (49.3% of all units):
| Lomita Park (Lomita): | $967,511 |
| California: | $988,808 |
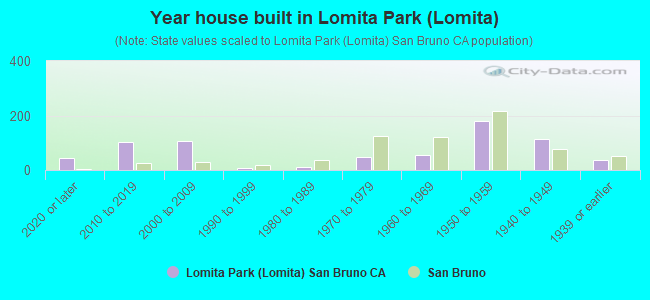
- Year house built in Lomita Park <
> - 442020 or later
- 1042010 to 2019
- 1052000 to 2009
- 81990 to 1999
- 101980 to 1989
- 491970 to 1979
- 551960 to 1969
- 1811950 to 1959
- 1151940 to 1949
- 361939 or earlier
City-data.com crime index for city in 2020 (higher means more crime):
| City: | 177.8 |
| U.S. average: | 219.5 |
Travel time to work (commute)
![Travel time to work (commute)]()
- 23Less than 5 minutes
- 645 to 9 minutes
- 14210 to 14 minutes
- 14715 to 19 minutes
- 11020 to 24 minutes
- 1825 to 29 minutes
- 14030 to 34 minutes
- 935 to 39 minutes
- 1340 to 44 minutes
- 6045 to 59 minutes
- 4660 to 89 minutes
- 1690 or more minutes

Means of transportation to work
![Means of transportation to work]()
- 60.3%485Drove a car alone
- 7.6%61Carpooled
- 4.5%36Bus
- 4.6%37Subway or elevated rail
- 3.2%26Long-distance train or commuter rail
- 0.1%1Taxi
- 1.6%13Motorcycle
- 4.8%39Walked
- 1.5%12Other means
- 14.8%119Worked at home

Time leaving home to go to work
![Time leaving home to go to work]()
- 3312:00 a.m. to 4:59 a.m.
- 655:00 a.m. to 5:29 a.m.
- 165:30 a.m. to 5:59 a.m.
- 546:00 a.m. to 6:29 a.m.
- 466:30 a.m. to 6:59 a.m.
- 1037:00 a.m. to 7:29 a.m.
- 697:30 a.m. to 7:59 a.m.
- 698:00 a.m. to 8:29 a.m.
- 298:30 a.m. to 8:59 a.m.
- 1149:00 a.m. to 9:59 a.m.
- 2710:00 a.m. to 10:59 a.m.
- 1611:00 a.m. to 11:59 a.m.
- 5512:00 p.m. to 3:59 p.m.
- 414:00 p.m. to 11:59 p.m.

Occupations of males:
- Percentage of males in management occupations (except farmers):
Here: 15.7% city: 12.7%
- Percentage of males in business and financial operations occupations:
Here: 1.3% city: 4.2%
- Percentage of males in computer and mathematical occupations:
Here: 12.4% city: 9.0%
- Percentage of males in architecture and engineering occupations:
Here: 1.7% city: 4.1%
- Percentage of males in life, physical, and social science occupations:
Here: 3.7% city: 2.6%
- Percentage of males in arts, design, entertainment, sports, and media occupations:
Here: 3.6% city: 1.7%
- Percentage of males in healthcare practitioners and technical occupations:
Here: 1.1% city: 2.6%
- Percentage of males in service occupations:
Here: 19.8% city: 17.6%
- Percentage of males in sales and office occupations:
Here: 12.6% city: 13.7%
- Percentage of males in construction, extraction, and maintenance occupations:
Here: 11.6% city: 9.3%
- Percentage of males in production occupations:
Here: 6.2% city: 5.4%
- Percentage of males in transportation occupations:
Here: 4.7% city: 5.9%
Occupations of females:
- Percentage of females in management occupations (except farmers):
Here: 13.6% city: 11.1%
- Percentage of females in business and financial operations occupations:
Here: 8.9% city: 10.4%
- Percentage of females in computer and mathematical occupations:
Here: 3.2% city: 3.0%
- Percentage of females in life, physical, and social science occupations:
Here: 1.2% city: 3.2%
- Percentage of females in education, training, and library occupations:
Here: 6.8% city: 5.5%
- Percentage of females in healthcare practitioners and technical occupations:
Here: 4.5% city: 9.0%
- Percentage of females in service occupations:
Here: 37.5% city: 20.3%
- Percentage of females in sales and office occupations:
Here: 12.2% city: 26.0%
- Percentage of females in production occupations:
Here: 2.0% city: 1.4%
- Percentage of females in transportation occupations:
Here: 2.9% city: 2.2%
- Percentage of females in material moving occupations:
Here: 6.6% city: 3.0%
Percentage of people 16-64 in Armed Forces:
| Lomita Park (Lomita): | 0.1% |
| San Bruno: | 0.2% |
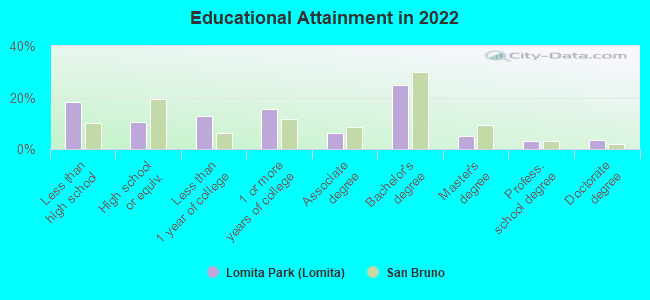
Education in this neighborhood (subdivision or community):
- Percentage of people 3 years and older in K-12 schools:
Lomita Park (Lomita): 22.5% San Bruno: 13.8%
- Percentage of people 3 years and older in undergraduate colleges:
Lomita Park (Lomita): 8.9% San Bruno: 6.2%
- Percentage of people 3 years and older in grad. or professional schools:
Lomita Park (Lomita): 1.7% San Bruno: 1.4%
- Percentage of students K-12 enrolled in private schools:
Lomita Park (Lomita): 28.0% San Bruno: 22.1%
Percentage of population below poverty level:
| Lomita Park (Lomita): | 3.1% |
| San Bruno: | 5.6% |
Median year owner moved in (as recorded in 2022):
Median year renter moved in (as recorded in 2022):
| Lomita Park (Lomita): | 2005 |
| San Bruno: | 2003 |
Median year renter moved in (as recorded in 2022):
| Lomita Park (Lomita): | 2014 |
| San Bruno: | 2015 |
Percentage of married-couple families with both working:
| Lomita Park (Lomita): | 84.4% |
| San Bruno: | 80.8% |
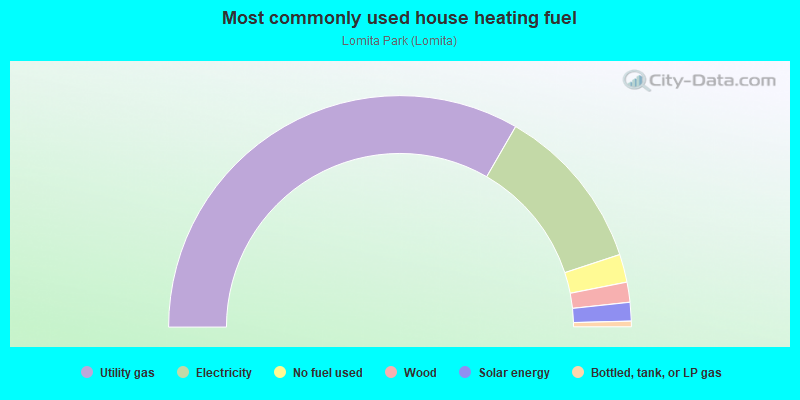
- 66.6%Utility gas
- 23.2%Electricity
- 3.9%No fuel used
- 2.8%Wood
- 2.6%Solar energy
- 0.8%Bottled, tank, or LP gas
Highways in this neighborhood:
el Camino Real (Mission St, State Hwy 82)
Length: 0.71 miles
Directions: E-W, N-S, SE-NW, SW-NE
Address range: 1463 to 1669
Directions: E-W, N-S, SE-NW, SW-NE
Address range: 1463 to 1669
Roads and streets:
San Anselmo Ave S
Length: 0.60 miles
Direction: SE-NW
Address range: 100 to 1099
Direction: SE-NW
Address range: 100 to 1099
San Antonio Ave
Length: 0.58 miles
Direction: SE-NW
Address range: 100 to 143
Direction: SE-NW
Address range: 100 to 143
San Felipe Ave
Length: 0.27 miles
Direction: SW-NE
Address range: 100 to 598
Direction: SW-NE
Address range: 100 to 598
San Luis Ave
Length: 0.26 miles
Direction: SW-NE
Address range: 114 to 261
Direction: SW-NE
Address range: 114 to 261
San Marco Ave
Length: 0.25 miles
Direction: SW-NE
Address range: 100 to 299
Direction: SW-NE
Address range: 100 to 299
Santa Domingo Ave
Length: 0.24 miles
Direction: SW-NE
Address range: 100 to 259
Direction: SW-NE
Address range: 100 to 259
Santa Lucia Ave
Length: 0.23 miles
Direction: SW-NE
Address range: 100 to 299
Direction: SW-NE
Address range: 100 to 299
San Benito Ave
Length: 0.22 miles
Direction: SW-NE
Address range: 100 to 299
Direction: SW-NE
Address range: 100 to 299
Santa Inez Ave
Length: 0.22 miles
Directions: E-W, SW-NE
Address range: 100 to 299
Directions: E-W, SW-NE
Address range: 100 to 299
San Diego Ave
Length: 0.21 miles
Directions: N-S, SW-NE
Address range: 100 to 299
Directions: N-S, SW-NE
Address range: 100 to 299
Santa Clara Ave
Length: 0.21 miles
Direction: SW-NE
Address range: 100 to 299
Direction: SW-NE
Address range: 100 to 299
Santa Maria Ave
Length: 0.19 miles
Direction: SW-NE
Address range: 100 to 247
Direction: SW-NE
Address range: 100 to 247
Santa Helena Ave
Length: 0.18 miles
Direction: SW-NE
Address range: 100 to 299
Direction: SW-NE
Address range: 100 to 299
San Juan Ave
Length: 0.11 miles
Direction: SW-NE
Address range: 100 to 199
Direction: SW-NE
Address range: 100 to 199
San Anselmo Ave S (San Anselmo Ave)
Length: 0.06 miles
Direction: SE-NW
Address range: 1100 to 1198
Direction: SE-NW
Address range: 1100 to 1198
Railroad features:
Union Pacific RR
Length: 0.67 miles
Direction: SE-NW
Direction: SE-NW
Caltrain
Length: 0.02 miles
Direction: SE-NW
Direction: SE-NW