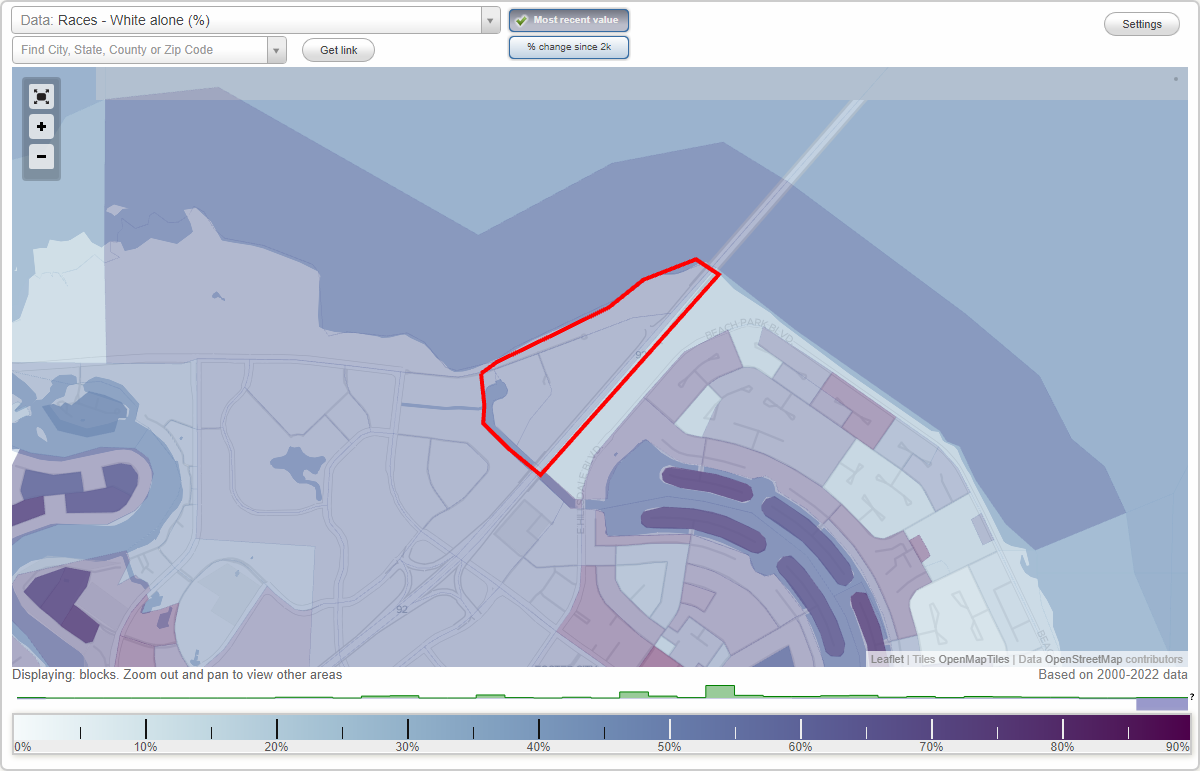
Lincoln neighborhood in San Mateo, California (CA), 94404 detailed profile
Settings
X

Business Search - 14 Million verified businesses
Area: 0.109 square miles
Population: 473
Population density:
| Lincoln: | 4,349 people per square mile |
| San Mateo: | 8,266 people per square mile |

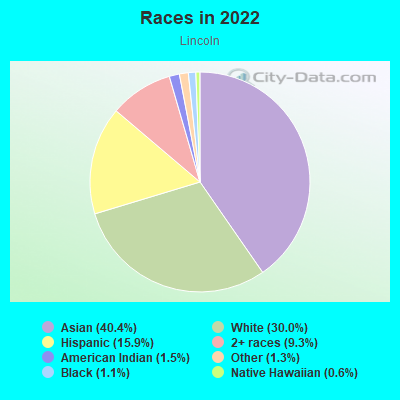
- 19140.4%Asian
- 14230.0%White
- 7515.9%Hispanic or Latino
- 449.3%Two or more races
- 71.5%American Indian
- 61.3%Some other race
- 51.1%Black
- 30.6%Native Hawaiian and Other
Pacific Islander
Median household income in 2022:
| Lincoln: | $187,143 |
| San Mateo: | $159,275 |
Distribution of median household income
![Distribution of median household income]()
- 2Less than $10,000
- 3$10,000 to $19,999
- 23$20,000 to $29,999
- 6$30,000 to $39,999
- 3$40,000 to $49,999
- 2$50,000 to $59,999
- 5$60,000 to $74,999
- 5$75,000 to $99,999
- 10$100,000 to $124,999
- 14$125,000 to $149,999
- 31$150,000 to $199,999
- 94$200,000 or more

Distribution of owner-occupied house/condo value
![Distribution of owner-occupied house/condo value]()
- 3$150,000 to $199,999
- 2$200,000 to $249,999
- 2$250,000 to $299,999
- 8$500,000 to $749,999
- 74$1,000,000 or more

Distribution of rent paid by renters
![Distribution of rent paid by renters]()
- 6$1,000 to $1,249
- 4$1,250 to $1,499
- 7$1,500 to $1,999
- 94$2,000 or more

Median rent in 2022:
| Lincoln: | $3,501 |
| San Mateo: | $2,001 |
| Males: | 203 |
| Females: | 269 |
Males:
| This neighborhood: | 39.3 years |
| Whole city: | 37.8 years |
| This neighborhood: | 38.5 years |
| Whole city: | 40.5 years |
Average household size:
| Lincoln: | 2.5 people |
| San Mateo: | 2.6 people |
Percentage of family households:
| Lincoln: | 63.6% |
| San Mateo: | 41.3% |
| Here: | 49.8% |
| San Mateo: | 48.9% |
Percentage of married-couple families with children (among all households):
| Lincoln: | 23.9% |
| San Mateo: | 29.2% |
Percentage of single-mother households (among all households):
| Lincoln: | 15.0% |
| San Mateo: | 5.8% |
Percentage of never married males 15 years old and over:
Percentage of never married females 15 years old and over:
| Lincoln: | 10.8% |
| San Mateo: | 18.2% |
Percentage of never married females 15 years old and over:
| Lincoln: | 16.8% |
| city: | 17.0% |
Percentage of people that speak English not well or not at all:
| Lincoln: | 0.0% |
| San Mateo: | 6.3% |
Percentage of people born in this state:
Percentage of people born in another U.S. state:
Percentage of native residents but born outside the U.S.:
Percentage of foreign born residents:
| Here: | 46.7% |
| San Mateo: | 48.0% |
Percentage of people born in another U.S. state:
| Lincoln: | 13.7% |
| San Mateo: | 14.4% |
Percentage of native residents but born outside the U.S.:
| Here: | 1.7% |
| city: | 1.1% |
Percentage of foreign born residents:
| Here: | 37.9% |
| San Mateo: | 36.5% |
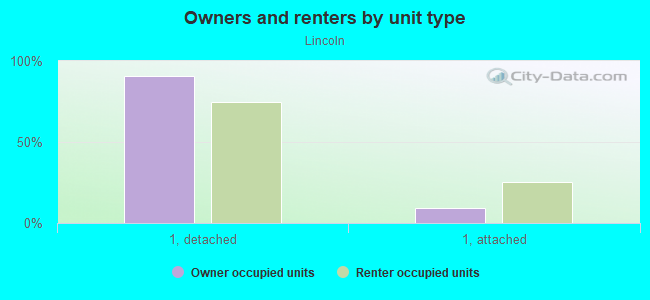
Owner-occupied
Renter-occupied

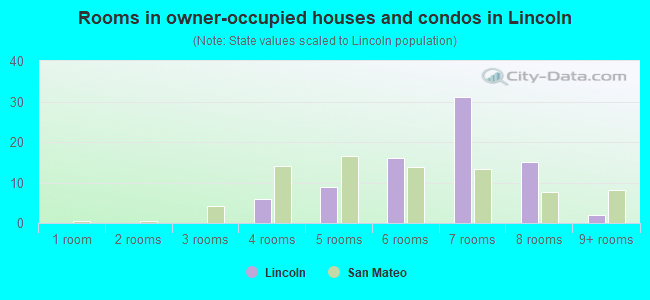
- Rooms in owner-occupied houses and condos in Lincoln
- 01 room
- 02 rooms
- 03 rooms
- 64 rooms
- 95 rooms
- 166 rooms
- 317 rooms
- 158 rooms
- 29+ rooms
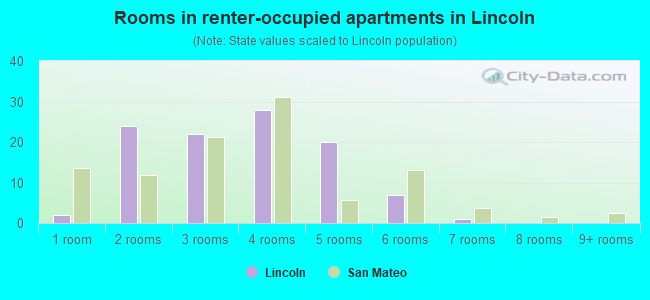
- Rooms in renter-occupied apartments in Lincoln
- 21 room
- 242 rooms
- 223 rooms
- 284 rooms
- 205 rooms
- 76 rooms
- 17 rooms
- 08 rooms
- 09+ rooms
Owner-occupied
Renter-occupied
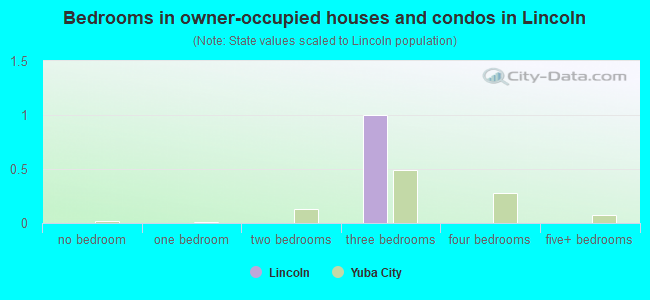
- Bedrooms in owner-occupied houses and condos in Lincoln
- 0no bedroom
- 01 bedroom
- 122 bedrooms
- 243 bedrooms
- 404 bedrooms
- 55+ bedrooms
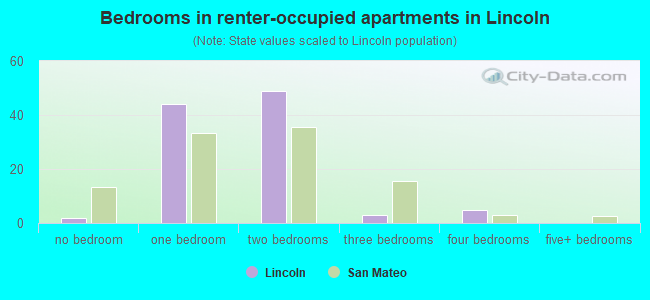
- Bedrooms in renter-occupied apartments in Lincoln
- 2no bedroom
- 441 bedroom
- 492 bedrooms
- 33 bedrooms
- 54 bedrooms
- 05+ bedrooms
Average number of cars or other vehicles available in houses/condos:
Average number of cars or other vehicles available in apartments:
| This neighborhood: | 1.9 |
| San Mateo: | 2.0 |
Average number of cars or other vehicles available in apartments:
| Here: | 1.5 |
| city: | 1.4 |
Percentage of units with a mortgage:
| Lincoln: | 64.2% |
| San Mateo: | 70.1% |
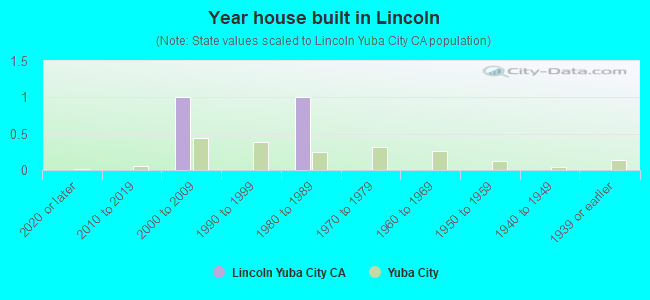
- Year house built in Lincoln
- 02020 or later
- 32010 to 2019
- 282000 to 2009
- 301990 to 1999
- 101980 to 1989
- 611970 to 1979
- 461960 to 1969
- 21950 to 1959
- 21940 to 1949
- 71939 or earlier
City-data.com crime index for city in 2020 (higher means more crime):
| City: | 202.6 |
| U.S. average: | 219.5 |
Travel time to work (commute)
![Travel time to work (commute)]()
- 1Less than 5 minutes
- 95 to 9 minutes
- 1010 to 14 minutes
- 3515 to 19 minutes
- 2720 to 24 minutes
- 2325 to 29 minutes
- 5130 to 34 minutes
- 835 to 39 minutes
- 1440 to 44 minutes
- 945 to 59 minutes
- 2660 to 89 minutes
- 590 or more minutes

Means of transportation to work
![Means of transportation to work]()
- 60.7%150Drove a car alone
- 13.4%33Carpooled
- 0.8%2Bus
- 0.8%2Subway or elevated rail
- 1.6%4Long-distance train or commuter rail
- 0.4%1Motorcycle
- 0.8%2Bicycle
- 0.4%1Walked
- 1.2%3Other means
- 18.2%45Worked at home

Time leaving home to go to work
![Time leaving home to go to work]()
- 112:00 a.m. to 4:59 a.m.
- 15:00 a.m. to 5:29 a.m.
- 206:00 a.m. to 6:29 a.m.
- 106:30 a.m. to 6:59 a.m.
- 257:00 a.m. to 7:29 a.m.
- 377:30 a.m. to 7:59 a.m.
- 228:00 a.m. to 8:29 a.m.
- 278:30 a.m. to 8:59 a.m.
- 529:00 a.m. to 9:59 a.m.
- 2710:00 a.m. to 10:59 a.m.
- 111:00 a.m. to 11:59 a.m.
- 1012:00 p.m. to 3:59 p.m.
- 84:00 p.m. to 11:59 p.m.

Occupations of males:
- Percentage of males in management occupations (except farmers):
Here: 21.1% city: 17.3%
- Percentage of males in business and financial operations occupations:
Here: 14.8% city: 5.6%
- Percentage of males in computer and mathematical occupations:
Here: 18.9% city: 15.5%
- Percentage of males in architecture and engineering occupations:
Here: 5.2% city: 4.6%
- Percentage of males in life, physical, and social science occupations:
Here: 4.5% city: 2.6%
- Percentage of males in legal occupations:
Here: 6.7% city: 1.3%
- Percentage of males in education, training, and library occupations:
Here: 2.2% city: 3.1%
- Percentage of males in arts, design, entertainment, sports, and media occupations:
Here: 3.4% city: 2.2%
- Percentage of males in healthcare practitioners and technical occupations:
Here: 5.4% city: 3.6%
- Percentage of males in service occupations:
Here: 7.1% city: 11.1%
- Percentage of males in sales and office occupations:
Here: 9.2% city: 12.6%
- Percentage of males in transportation occupations:
Here: 1.5% city: 3.4%
- Percentage of males in material moving occupations:
Here: 1.8% city: 2.3%
Occupations of females:
- Percentage of females in management occupations (except farmers):
Here: 11.4% city: 15.9%
- Percentage of females in business and financial operations occupations:
Here: 12.2% city: 11.0%
- Percentage of females in computer and mathematical occupations:
Here: 6.4% city: 6.6%
- Percentage of females in architecture and engineering occupations:
Here: 1.4% city: 1.6%
- Percentage of females in life, physical, and social science occupations:
Here: 2.6% city: 3.9%
- Percentage of females in legal occupations:
Here: 10.1% city: 1.7%
- Percentage of females in education, training, and library occupations:
Here: 2.4% city: 6.9%
- Percentage of females in arts, design, entertainment, sports, and media occupations:
Here: 1.7% city: 3.2%
- Percentage of females in healthcare practitioners and technical occupations:
Here: 23.0% city: 8.3%
- Percentage of females in service occupations:
Here: 8.7% city: 16.0%
- Percentage of females in sales and office occupations:
Here: 21.5% city: 19.6%
- Percentage of females in construction, extraction, and maintenance occupations:
Here: 3.6% city: 0.0%
- Percentage of females in production occupations:
Here: 2.9% city: 1.6%
- Percentage of females in transportation occupations:
Here: 1.1% city: 0.8%
Percentage of people 16-64 in Armed Forces:
| Lincoln: | 2.7% |
| San Mateo: | 0.0% |
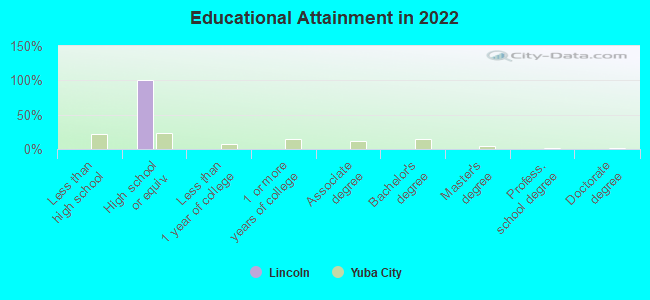
Education in this neighborhood (subdivision or community):
- Percentage of people 3 years and older in K-12 schools:
Lincoln: 18.2% San Mateo: 15.7%
- Percentage of people 3 years and older in undergraduate colleges:
Lincoln: 2.2% San Mateo: 4.9%
- Percentage of people 3 years and older in grad. or professional schools:
Lincoln: 0.2% San Mateo: 1.2%
- Percentage of students K-12 enrolled in private schools:
Lincoln: 44.0% San Mateo: 18.6%
Percentage of population below poverty level:
| Lincoln: | 2.6% |
| San Mateo: | 8.3% |
Median year owner moved in (as recorded in 2022):
Median year renter moved in (as recorded in 2022):
| Lincoln: | 2001 |
| San Mateo: | 2009 |
Median year renter moved in (as recorded in 2022):
| Lincoln: | 2015 |
| San Mateo: | 2021 |
Percentage of married-couple families with both working:
| Lincoln: | 67.4% |
| San Mateo: | 66.4% |
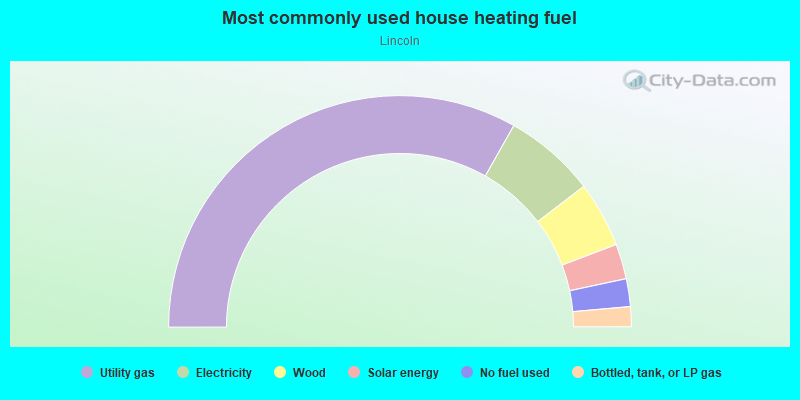
- 51.4%Electricity
- 44.5%Utility gas
- 2.2%No fuel used
- 1.0%Other fuel
- 0.9%Bottled, tank, or LP gas
Limited-access highways (interstate or state) in this neighborhood:
State Hwy 92 (J Arthur Younger Fwy)
Length: 0.53 miles
Direction: SW-NE
Direction: SW-NE
State Hwy 92
Length: 0.33 miles
Direction: SW-NE
Direction: SW-NE
Roads and streets:
E 3rd Ave
Length: 0.54 miles
Direction: E-W
Address range: 4000 to 4199
Direction: E-W
Address range: 4000 to 4199
Lincoln Centre Dr
Length: 0.19 miles
Directions: N-S, SE-NW, SW-NE
Address range: 100 to 899
Directions: N-S, SE-NW, SW-NE
Address range: 100 to 899