Lincoln Park neighborhood in Columbia, South Carolina (SC), 29203 detailed profile
Settings
X

Business Search - 14 Million verified businesses
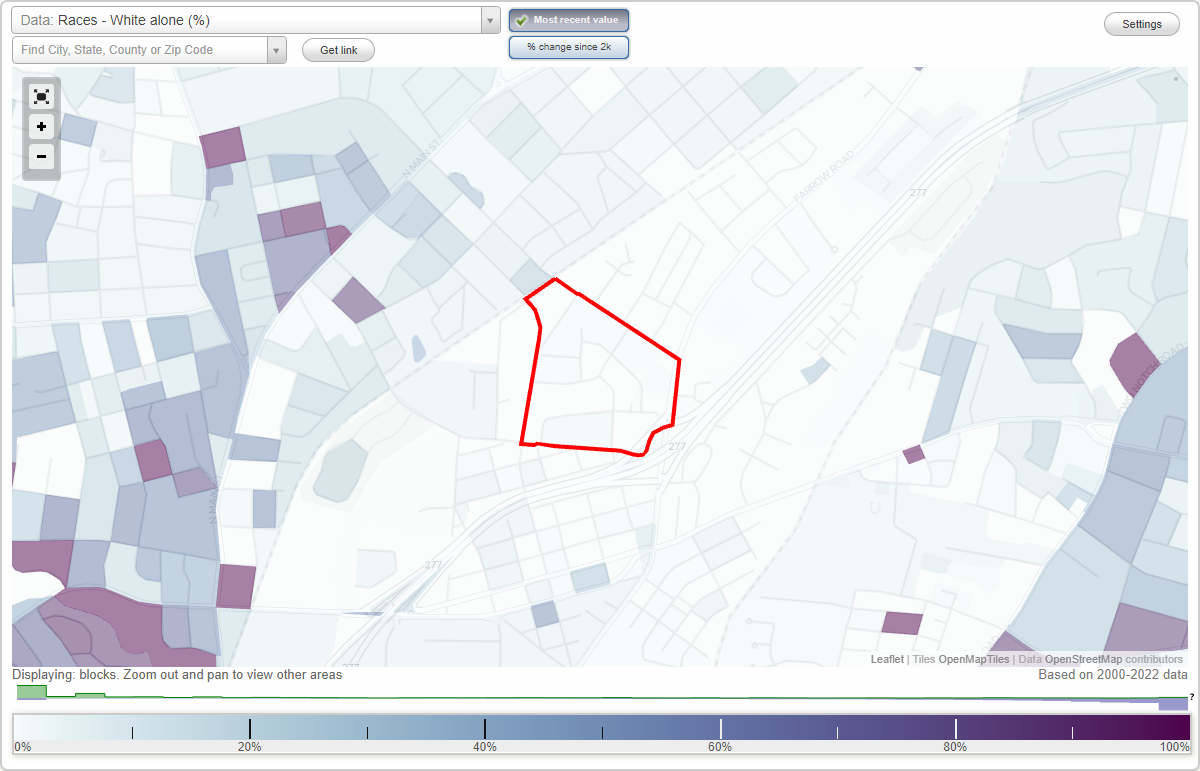
Area: 0.115 square miles
Population: 257
Population density:
| Lincoln Park: | 2,230 people per square mile |
| Columbia: | 1,113 people per square mile |

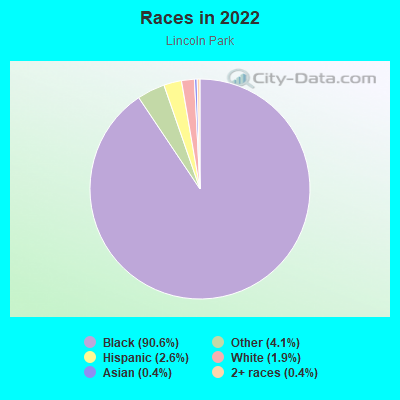
- 24290.6%Black
- 114.1%Some other race
- 72.6%Hispanic or Latino
- 51.9%White
- 10.4%Asian
- 10.4%Two or more races
Median household income in 2022:
| Lincoln Park: | $25,625 |
| Columbia: | $56,175 |
Distribution of median household income
![Distribution of median household income]()
- 30Less than $10,000
- 36$10,000 to $19,999
- 13$20,000 to $29,999
- 9$30,000 to $39,999
- 36$40,000 to $49,999
- 17$50,000 to $59,999
- 10$60,000 to $74,999
- 7$75,000 to $99,999
- 8$100,000 to $124,999
- 1$125,000 to $149,999
- 3$150,000 to $199,999
- 2$200,000 or more

Distribution of owner-occupied house/condo value
![Distribution of owner-occupied house/condo value]()
- 19Less than $50,000
- 33$50,000 to $99,999
- 18$100,000 to $149,999
- 7$150,000 to $199,999
- 29$200,000 to $249,999
- 1$1,000,000 or more

Distribution of rent paid by renters
![Distribution of rent paid by renters]()
- 6Less than $100
- 100$100 to $199
- 11$200 to $299
- 10$300 to $399
- 13$400 to $499
- 11$500 to $599
- 19$600 to $699
- 7$700 to $799
- 21$800 to $899
- 19$900 to $999
- 5$1,000 to $1,249

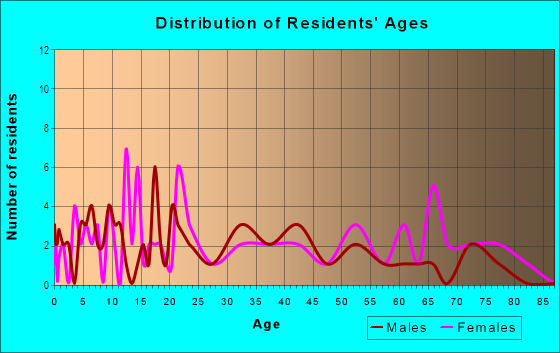
| Males: | 104 |
| Females: | 153 |
Males:
| This neighborhood: | 22.5 years |
| Whole city: | 27.5 years |
| This neighborhood: | 32.1 years |
| Whole city: | 29.3 years |
Average household size:
| Lincoln Park: | 2.4 people |
| Columbia: | 2.1 people |
Percentage of family households:
| Lincoln Park: | 21.2% |
| Columbia: | 35.2% |
| Here: | 8.8% |
| Columbia: | 27.5% |
Percentage of married-couple families with children (among all households):
| Lincoln Park: | 8.7% |
| Columbia: | 23.7% |
Percentage of single-mother households (among all households):
| Lincoln Park: | 42.1% |
| Columbia: | 12.1% |
Percentage of never married males 15 years old and over:
Percentage of never married females 15 years old and over:
| Lincoln Park: | 22.4% |
| Columbia: | 31.8% |
Percentage of never married females 15 years old and over:
| Lincoln Park: | 32.9% |
| city: | 26.3% |
Percentage of people that speak English not well or not at all:
| Lincoln Park: | 0.0% |
| Columbia: | 0.6% |
Percentage of people born in this state:
Percentage of people born in another U.S. state:
Percentage of native residents but born outside the U.S.:
Percentage of foreign born residents:
| Here: | 87.2% |
| Columbia: | 53.1% |
Percentage of people born in another U.S. state:
| Lincoln Park: | 11.4% |
| Columbia: | 40.1% |
Percentage of native residents but born outside the U.S.:
| Here: | 0.6% |
| city: | 2.2% |
Percentage of foreign born residents:
| Here: | 0.8% |
| Columbia: | 4.6% |
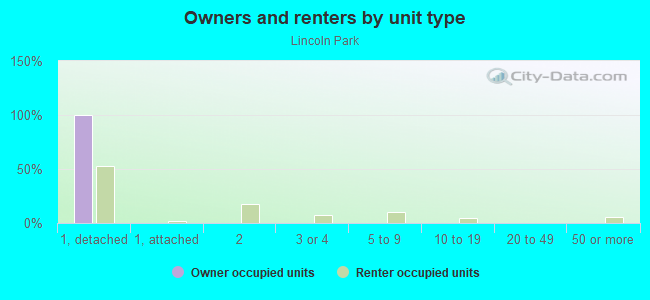
Owner-occupied
Renter-occupied

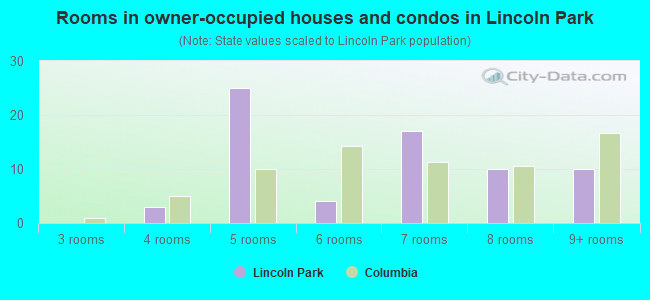
- Rooms in owner-occupied houses and condos in Lincoln Park
- 01 room
- 02 rooms
- 03 rooms
- 34 rooms
- 255 rooms
- 46 rooms
- 177 rooms
- 108 rooms
- 109+ rooms
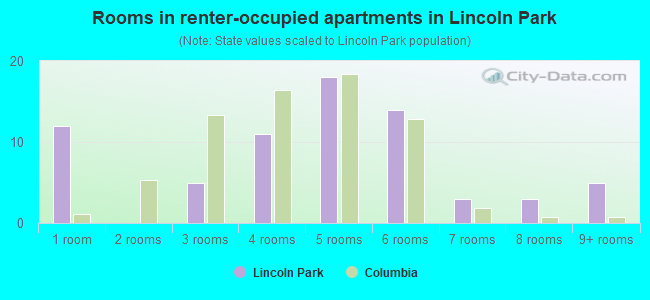
- Rooms in renter-occupied apartments in Lincoln Park
- 121 room
- 02 rooms
- 53 rooms
- 114 rooms
- 185 rooms
- 146 rooms
- 37 rooms
- 38 rooms
- 59+ rooms
Owner-occupied
Renter-occupied
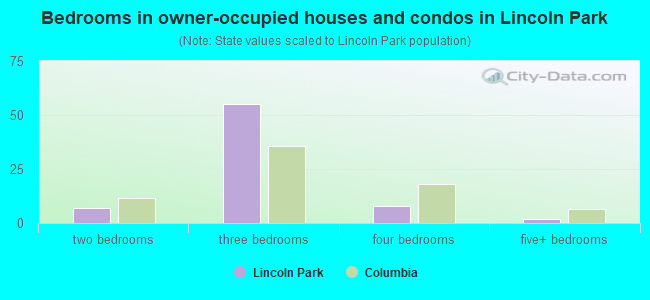
- Bedrooms in owner-occupied houses and condos in Lincoln Park
- 0no bedroom
- 01 bedroom
- 72 bedrooms
- 553 bedrooms
- 84 bedrooms
- 25+ bedrooms
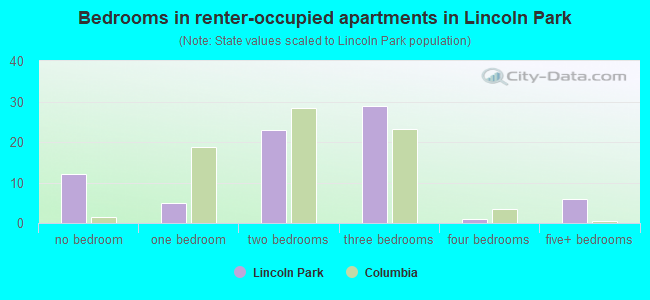
- Bedrooms in renter-occupied apartments in Lincoln Park
- 12no bedroom
- 51 bedroom
- 232 bedrooms
- 293 bedrooms
- 14 bedrooms
- 65+ bedrooms
Average number of cars or other vehicles available in houses/condos:
Average number of cars or other vehicles available in apartments:
| This neighborhood: | 1.4 |
| Columbia: | 1.8 |
Average number of cars or other vehicles available in apartments:
| Here: | 0.7 |
| city: | 1.3 |
Percentage of units with a mortgage:
| Lincoln Park: | 14.0% |
| Columbia: | 67.5% |
Average estimated value of detached houses in 2022 (86.5% of all units):
| Lincoln Park: | $136,093 |
| Columbia: | $305,357 |
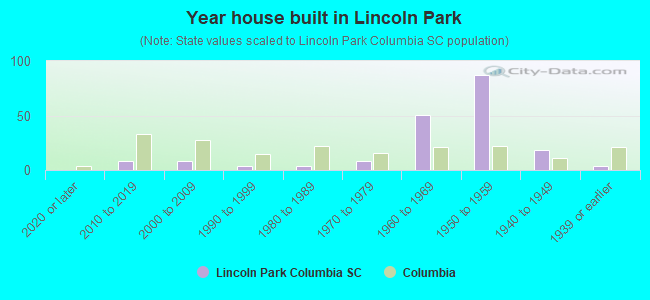
- Year house built in Lincoln Park
- 02020 or later
- 82010 to 2019
- 82000 to 2009
- 41990 to 1999
- 41980 to 1989
- 81970 to 1979
- 501960 to 1969
- 871950 to 1959
- 181940 to 1949
- 41939 or earlier
City-data.com crime index for city in 2020 (higher means more crime):
| City: | 446.0 |
| U.S. average: | 219.5 |
Travel time to work (commute)
![Travel time to work (commute)]()
- 6Less than 5 minutes
- 85 to 9 minutes
- 3210 to 14 minutes
- 2615 to 19 minutes
- 1220 to 24 minutes
- 225 to 29 minutes
- 1930 to 34 minutes
- 135 to 39 minutes
- 540 to 44 minutes
- 1545 to 59 minutes
- 1560 to 89 minutes
- 490 or more minutes

Means of transportation to work
![Means of transportation to work]()
- 58.7%58Drove a car alone
- 6.1%6Carpooled
- 9.1%9Bus
- 14.2%14Taxi
- 14.2%14Walked
- 9.1%9Worked at home

Time leaving home to go to work
![Time leaving home to go to work]()
- 1112:00 a.m. to 4:59 a.m.
- 25:00 a.m. to 5:29 a.m.
- 55:30 a.m. to 5:59 a.m.
- 36:00 a.m. to 6:29 a.m.
- 56:30 a.m. to 6:59 a.m.
- 157:00 a.m. to 7:29 a.m.
- 197:30 a.m. to 7:59 a.m.
- 208:00 a.m. to 8:29 a.m.
- 109:00 a.m. to 9:59 a.m.
- 210:00 a.m. to 10:59 a.m.
- 211:00 a.m. to 11:59 a.m.
- 1512:00 p.m. to 3:59 p.m.
- 64:00 p.m. to 11:59 p.m.

Occupations of males:
- Percentage of males in architecture and engineering occupations:
Here: 10.8% city: 2.3%
- Percentage of males in service occupations:
Here: 24.0% city: 18.4%
- Percentage of males in production occupations:
Here: 32.6% city: 3.9%
- Percentage of males in transportation occupations:
Here: 12.4% city: 4.1%
Occupations of females:
- Percentage of females in management occupations (except farmers):
Here: 5.4% city: 8.8%
- Percentage of females in business and financial operations occupations:
Here: 22.0% city: 6.4%
- Percentage of females in computer and mathematical occupations:
Here: 11.3% city: 2.3%
- Percentage of females in service occupations:
Here: 29.5% city: 20.2%
- Percentage of females in sales and office occupations:
Here: 22.8% city: 26.9%
- Percentage of females in production occupations:
Here: 4.8% city: 3.3%
- Percentage of females in material moving occupations:
Here: 3.8% city: 1.7%
Percentage of people 16-64 in Armed Forces:
| Lincoln Park: | 0.0% |
| Columbia: | 7.2% |
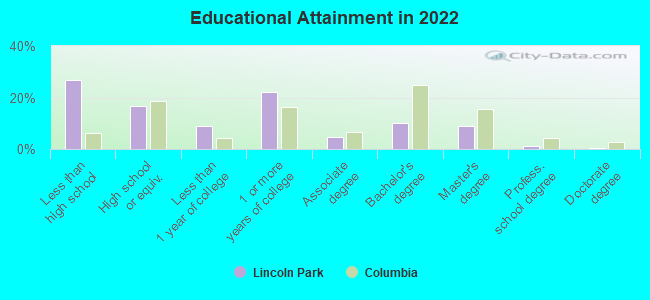
Education in this neighborhood (subdivision or community):
- Percentage of people 3 years and older in K-12 schools:
Lincoln Park: 37.8% Columbia: 12.2%
- Percentage of people 3 years and older in undergraduate colleges:
Lincoln Park: 8.0% Columbia: 16.2%
- Percentage of people 3 years and older in grad. or professional schools:
Lincoln Park: 3.2% Columbia: 3.5%
- Percentage of students K-12 enrolled in private schools:
Lincoln Park: 7.4% Columbia: 24.2%
Percentage of population below poverty level:
| Lincoln Park: | 50.8% |
| Columbia: | 20.7% |
Median year owner moved in (as recorded in 2022):
Median year renter moved in (as recorded in 2022):
| Lincoln Park: | 1991 |
| Columbia: | 2013 |
Median year renter moved in (as recorded in 2022):
| Lincoln Park: | 2016 |
| Columbia: | 2022 |
Percentage of married-couple families with both working:
| Lincoln Park: | 904.1% |
| Columbia: | 72.3% |
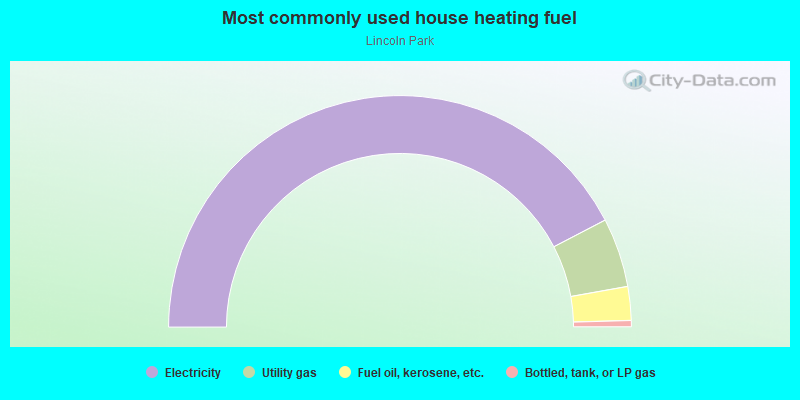
- 84.8%Electricity
- 9.7%Utility gas
- 4.7%Fuel oil, kerosene, etc.
- 0.9%Bottled, tank, or LP gas
Roads and streets:
Chappelle St
Length: 0.43 miles
Directions: E-W, N-S, SW-NE
Address range: 2200 to 2430
Directions: E-W, N-S, SW-NE
Address range: 2200 to 2430
Water St
Length: 0.35 miles
Directions: N-S, SE-NW, SW-NE
Address range: 3801 to 4598
Directions: N-S, SE-NW, SW-NE
Address range: 3801 to 4598
Columbia College Dr
Length: 0.34 miles
Directions: E-W, SE-NW
Address range: 1700 to 1999
Directions: E-W, SE-NW
Address range: 1700 to 1999
Lorick Ave
Length: 0.29 miles
Direction: E-W
Address range: 2152 to 2499
Direction: E-W
Address range: 2152 to 2499
Shaw St
Length: 0.28 miles
Directions: E-W, N-S, SE-NW
Address range: 3801 to 3999
Directions: E-W, N-S, SE-NW
Address range: 3801 to 3999
Farrow Rd
Length: 0.17 miles
Direction: N-S
Address range: 3800 to 3999
Direction: N-S
Address range: 3800 to 3999
Peale St
Length: 0.13 miles
Direction: N-S
Address range: 4000 to 4199
Direction: N-S
Address range: 4000 to 4199
Manse St
Length: 0.05 miles
Directions: E-W, SW-NE
Address range: 2300 to 2399
Directions: E-W, SW-NE
Address range: 2300 to 2399
Other features:
Bay Br
Length: 0.17 miles
Direction: E-W
Direction: E-W