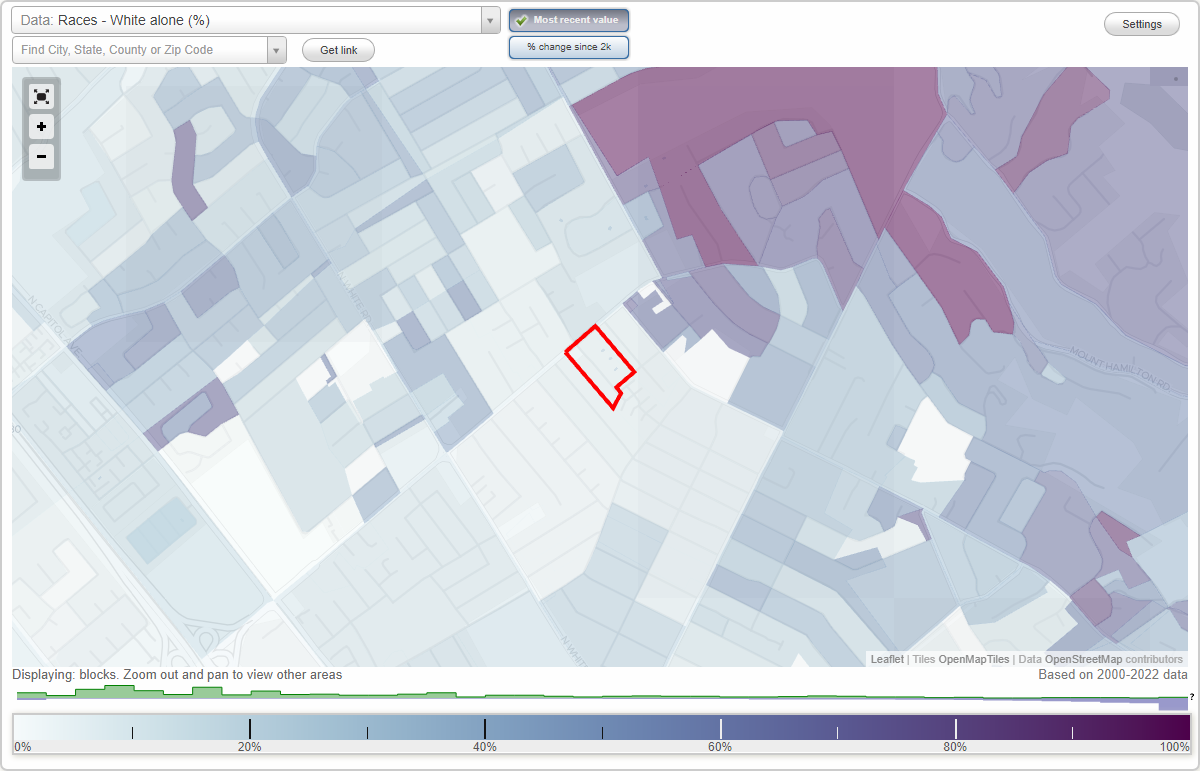
La Pala South neighborhood in San Jose, California (CA), 95127 detailed profile
Settings
X

Business Search - 14 Million verified businesses
Area: 0.014 square miles
Population: 108
Population density:
| La Pala South: | 7,605 people per square mile |
| San Jose: | 5,554 people per square mile |

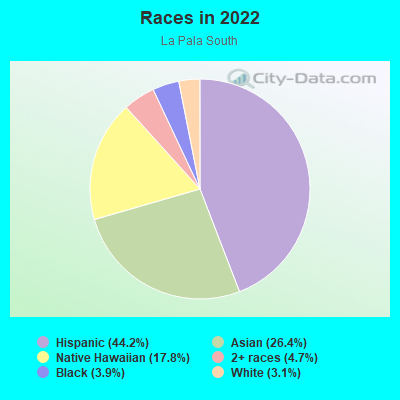
- 5744.2%Hispanic or Latino
- 3426.4%Asian
- 2317.8%Native Hawaiian and Other
Pacific Islander - 64.7%Two or more races
- 53.9%Black
- 43.1%White
Median household income in 2022:
| La Pala South: | $107,465 |
| San Jose: | $133,835 |
Distribution of median household income
![Distribution of median household income]()
- 4Less than $10,000
- 2$10,000 to $19,999
- 2$20,000 to $29,999
- 2$30,000 to $39,999
- 3$40,000 to $49,999
- 3$50,000 to $59,999
- 2$60,000 to $74,999
- 3$75,000 to $99,999
- 7$100,000 to $124,999
- 3$125,000 to $149,999
- 11$150,000 to $199,999
- 5$200,000 or more

Distribution of owner-occupied house/condo value
![Distribution of owner-occupied house/condo value]()
- 1$200,000 to $249,999
- 2$400,000 to $499,999
- 2$500,000 to $749,999
- 4$750,000 to $999,999
- 7$1,000,000 or more

Distribution of rent paid by renters
![Distribution of rent paid by renters]()
- 1$200 to $299
- 4$1,500 to $1,999
- 21$2,000 or more

Median rent in 2022:
| La Pala South: | $2,273 |
| San Jose: | $2,001 |
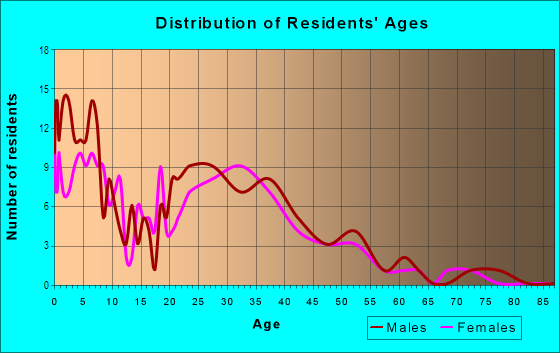
| Males: | 55 |
| Females: | 52 |
Males:
| This neighborhood: | 38.1 years |
| Whole city: | 37.6 years |
| This neighborhood: | 43.7 years |
| Whole city: | 39.1 years |
Average household size:
| La Pala South: | 2.9 people |
| San Jose: | 2.9 people |
Percentage of family households:
| La Pala South: | 50.1% |
| San Jose: | 49.9% |
| Here: | 56.2% |
| San Jose: | 53.0% |
Percentage of married-couple families with children (among all households):
| La Pala South: | 28.9% |
| San Jose: | 25.8% |
Percentage of single-mother households (among all households):
| La Pala South: | 6.3% |
| San Jose: | 5.2% |
Percentage of never married males 15 years old and over:
Percentage of never married females 15 years old and over:
| La Pala South: | 20.1% |
| San Jose: | 20.9% |
Percentage of never married females 15 years old and over:
| La Pala South: | 14.8% |
| city: | 16.7% |
Percentage of people born in this state:
Percentage of people born in another U.S. state:
Percentage of native residents but born outside the U.S.:
Percentage of foreign born residents:
| Here: | 49.8% |
| San Jose: | 46.1% |
Percentage of people born in another U.S. state:
| La Pala South: | 6.0% |
| San Jose: | 10.4% |
Percentage of native residents but born outside the U.S.:
| Here: | 1.8% |
| city: | 1.7% |
Percentage of foreign born residents:
| Here: | 42.4% |
| San Jose: | 41.8% |
Owner-occupied
Renter-occupied

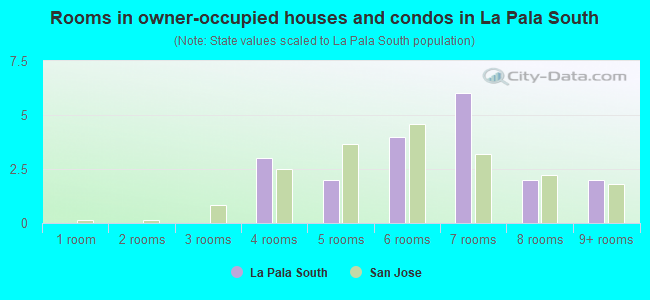
- Rooms in owner-occupied houses and condos in La Pala South
- 01 room
- 02 rooms
- 03 rooms
- 34 rooms
- 25 rooms
- 46 rooms
- 67 rooms
- 28 rooms
- 29+ rooms
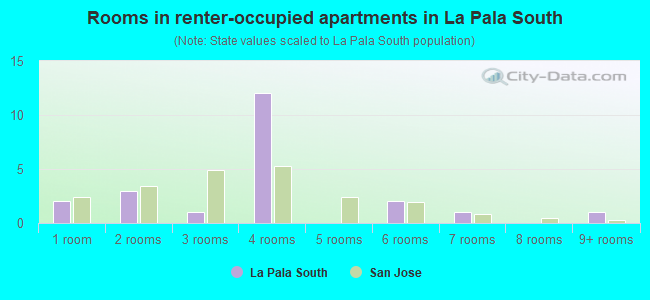
- Rooms in renter-occupied apartments in La Pala South
- 21 room
- 32 rooms
- 13 rooms
- 124 rooms
- 05 rooms
- 26 rooms
- 17 rooms
- 08 rooms
- 19+ rooms
Owner-occupied
Renter-occupied
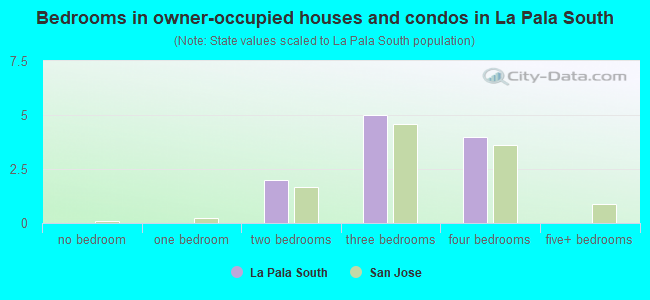
- Bedrooms in owner-occupied houses and condos in La Pala South
- 0no bedroom
- 01 bedroom
- 22 bedrooms
- 53 bedrooms
- 44 bedrooms
- 05+ bedrooms
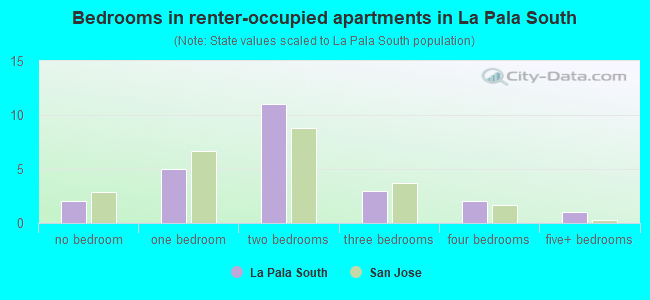
- Bedrooms in renter-occupied apartments in La Pala South
- 2no bedroom
- 51 bedroom
- 112 bedrooms
- 33 bedrooms
- 24 bedrooms
- 15+ bedrooms
Average number of cars or other vehicles available in houses/condos:
Average number of cars or other vehicles available in apartments:
| This neighborhood: | 2.5 |
| San Jose: | 2.3 |
Average number of cars or other vehicles available in apartments:
| Here: | 1.9 |
| city: | 1.6 |
Percentage of units with a mortgage:
| La Pala South: | 77.4% |
| San Jose: | 66.9% |
Housing prices:
- Average estimated value of detached houses in 2022 (43.2% of all units):
La Pala South: $1,022,258 San Jose: $1,532,815
- Average estimated value of townhouses or other attached units in 2022 (5.4% of all units):
This neighborhood: $481,895 city: $1,024,857
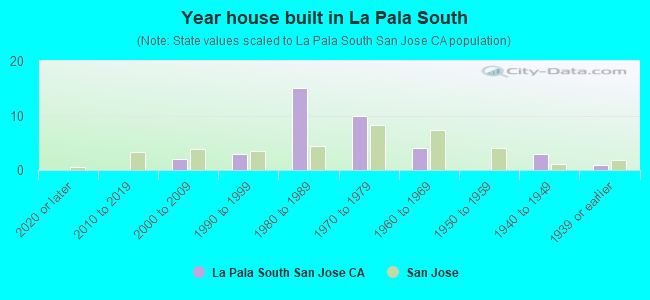
- Year house built in La Pala South
- 02020 or later
- 02010 to 2019
- 22000 to 2009
- 31990 to 1999
- 151980 to 1989
- 101970 to 1979
- 41960 to 1969
- 01950 to 1959
- 31940 to 1949
- 11939 or earlier
City-data.com crime index for city in 2020 (higher means more crime):
| City: | 268.4 |
| U.S. average: | 219.5 |
Travel time to work (commute)
![Travel time to work (commute)]()
- 15 to 9 minutes
- 710 to 14 minutes
- 2015 to 19 minutes
- 2420 to 24 minutes
- 425 to 29 minutes
- 2830 to 34 minutes
- 135 to 39 minutes
- 440 to 44 minutes
- 145 to 59 minutes
- 1160 to 89 minutes
- 190 or more minutes

Means of transportation to work
![Means of transportation to work]()
- 69.8%47Drove a car alone
- 5.9%4Carpooled
- 1.5%1Bus
- 1.5%1Taxi
- 3.0%2Walked
- 14.8%10Worked at home

Time leaving home to go to work
![Time leaving home to go to work]()
- 612:00 a.m. to 4:59 a.m.
- 55:00 a.m. to 5:29 a.m.
- 55:30 a.m. to 5:59 a.m.
- 176:00 a.m. to 6:29 a.m.
- 116:30 a.m. to 6:59 a.m.
- 107:00 a.m. to 7:29 a.m.
- 87:30 a.m. to 7:59 a.m.
- 128:00 a.m. to 8:29 a.m.
- 28:30 a.m. to 8:59 a.m.
- 159:00 a.m. to 9:59 a.m.
- 410:00 a.m. to 10:59 a.m.
- 111:00 a.m. to 11:59 a.m.
- 612:00 p.m. to 3:59 p.m.
- 44:00 p.m. to 11:59 p.m.

Occupations of males:
- Percentage of males in management occupations (except farmers):
Here: 12.2% city: 13.0%
- Percentage of males in business and financial operations occupations:
Here: 4.4% city: 4.6%
- Percentage of males in computer and mathematical occupations:
Here: 12.0% city: 13.6%
- Percentage of males in architecture and engineering occupations:
Here: 6.4% city: 10.2%
- Percentage of males in life, physical, and social science occupations:
Here: 4.6% city: 1.1%
- Percentage of males in education, training, and library occupations:
Here: 1.7% city: 2.8%
- Percentage of males in arts, design, entertainment, sports, and media occupations:
Here: 1.0% city: 1.8%
- Percentage of males in healthcare practitioners and technical occupations:
Here: 2.3% city: 2.0%
- Percentage of males in service occupations:
Here: 6.3% city: 12.7%
- Percentage of males in sales and office occupations:
Here: 12.5% city: 12.8%
- Percentage of males in farming, fishing, and forestry occupations:
Here: 5.2% city: 0.4%
- Percentage of males in construction, extraction, and maintenance occupations:
Here: 15.7% city: 7.8%
- Percentage of males in production occupations:
Here: 7.1% city: 5.5%
- Percentage of males in transportation occupations:
Here: 4.1% city: 3.6%
- Percentage of males in material moving occupations:
Here: 9.0% city: 3.1%
Occupations of females:
- Percentage of females in management occupations (except farmers):
Here: 4.7% city: 11.0%
- Percentage of females in business and financial operations occupations:
Here: 4.9% city: 8.6%
- Percentage of females in computer and mathematical occupations:
Here: 3.5% city: 5.4%
- Percentage of females in architecture and engineering occupations:
Here: 2.6% city: 2.8%
- Percentage of females in life, physical, and social science occupations:
Here: 3.6% city: 1.7%
- Percentage of females in community and social services occupations:
Here: 1.6% city: 1.8%
- Percentage of females in education, training, and library occupations:
Here: 8.3% city: 8.1%
- Percentage of females in arts, design, entertainment, sports, and media occupations:
Here: 9.6% city: 2.0%
- Percentage of females in healthcare practitioners and technical occupations:
Here: 10.5% city: 6.8%
- Percentage of females in service occupations:
Here: 49.4% city: 21.7%
- Percentage of females in sales and office occupations:
Here: 8.9% city: 22.0%
- Percentage of females in production occupations:
Here: 1.3% city: 4.0%
- Percentage of females in material moving occupations:
Here: 6.9% city: 1.5%
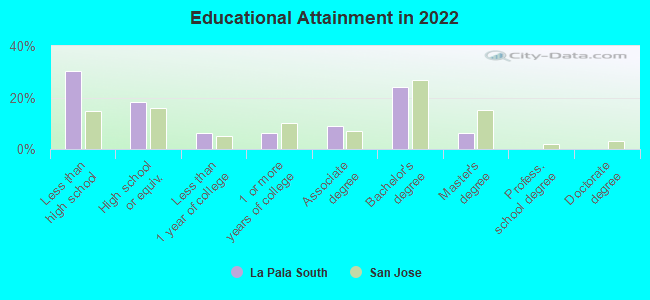
Education in this neighborhood (subdivision or community):
- Percentage of people 3 years and older in K-12 schools:
La Pala South: 24.8% San Jose: 16.1%
- Percentage of people 3 years and older in undergraduate colleges:
La Pala South: 1.9% San Jose: 6.5%
- Percentage of people 3 years and older in grad. or professional schools:
La Pala South: 0.0% San Jose: 2.0%
- Percentage of students K-12 enrolled in private schools:
La Pala South: 0.0% San Jose: 14.9%
Percentage of population below poverty level:
| La Pala South: | 4.6% |
| San Jose: | 9.0% |
Median year owner moved in (as recorded in 2022):
Median year renter moved in (as recorded in 2022):
| La Pala South: | 2003 |
| San Jose: | 2008 |
Median year renter moved in (as recorded in 2022):
| La Pala South: | 2019 |
| San Jose: | 2020 |
Percentage of married-couple families with both working:
| La Pala South: | 117.5% |
| San Jose: | 72.5% |
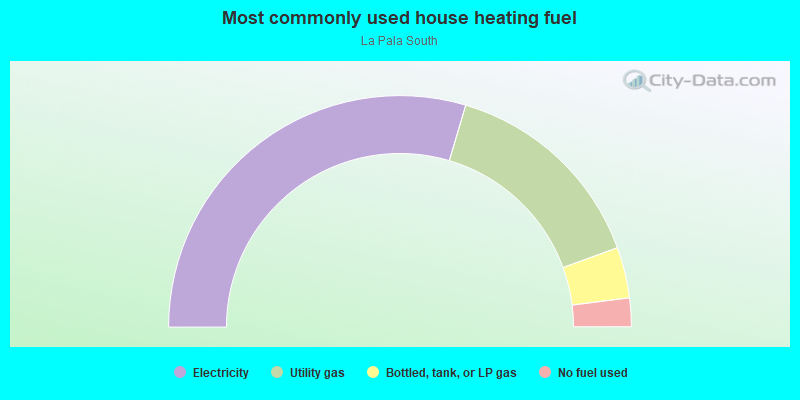
- 59.2%Electricity
- 29.7%Utility gas
- 7.1%Bottled, tank, or LP gas
- 4.0%No fuel used